AI Chatbot Providers Dashboard in Power BI is a ready-to-use Power BI dashboard template for AI product teams, SaaS analysts, support leaders, and consultants who need one place to review chatbot provider performance. Chatbot programs can generate thousands of conversations across providers, industries, channels, regions, model types, support levels, and plan tiers. That growth creates a reporting challenge: leadership wants revenue and profit, support teams want resolution and escalation quality, and product teams want adoption trends. This Power BI dashboard brings conversations, subscription revenue, resolution rate, active users, customer satisfaction, response time, support cost, and profitability into 5 focused report pages.
Power BI is well suited for this kind of recurring analysis because teams can connect, model, visualize, and refresh structured business data in a familiar Microsoft BI environment. Microsoft explains core Power BI concepts in its official documentation here: Microsoft Learn: What is Power BI?.
Key Features of AI Chatbot Providers Dashboard in Power BI
- 5 Power BI report pages: Overview, Engagement and Conversation Trends, Provider Analysis, Revenue and Profitability Insights, and Operations and Channels.
- High-level KPI cards: Track conversations, subscription revenue, resolution rate, active users, satisfaction, total cost, net profit, profit margin, ARPU, response time, and support cost.
- Provider performance analysis: Compare revenue, margin, net profit, conversation volume, active users, and satisfaction by provider.
- Conversation quality reporting: Monitor resolved conversations, escalation rate, response time, and resolution rate over time.
- Revenue and profit visibility: Analyze revenue, cost, net profit, ARPU, plan tiers, regions, industries, and model types.
- Operational channel review: Compare conversations by country, channel, model type, deployment type, and support level.
- Interactive filtering: Use date range, region, industry, model type, and plan tier filters to narrow the report quickly.
Dashboard Pages Explanation
1. Overview Page
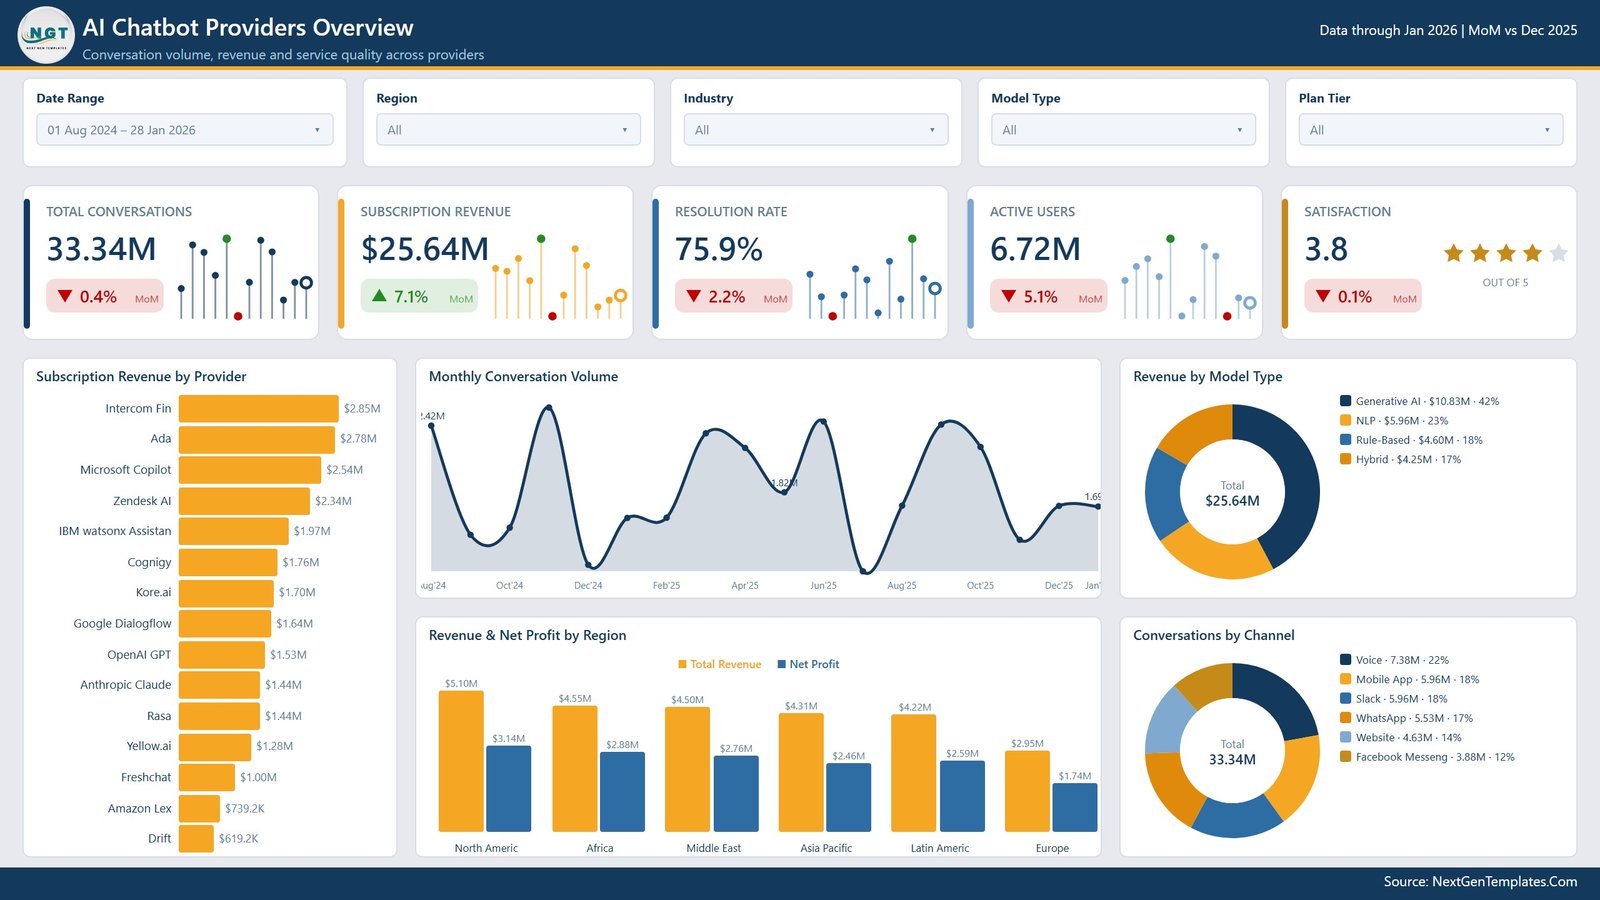
The Overview page gives the big picture first. At the top, the filters let users narrow the dashboard by date range, region, industry, model type, and plan tier. The KPI cards show total conversations, subscription revenue, resolution rate, active users, and satisfaction. Below the cards, users can compare subscription revenue by provider, follow monthly conversation volume, review revenue by model type, compare revenue and net profit by region, and see conversations by channel.
This page is useful for executives and managers who need a fast summary before moving into operational detail. It answers questions such as: Which providers are driving revenue? Is conversation volume rising? Which regions are profitable? Which channels are handling the most customer interactions?
2. Engagement and Conversation Trends
The Engagement and Conversation Trends page focuses on volume, resolution, escalation, response time, and active user momentum over time. Cards highlight total conversations, resolved conversations, escalation rate, average response time, and resolution rate. The main visual compares conversations with resolution rate by month, while the lower visuals show escalated conversations, average response time, and active users month by month.
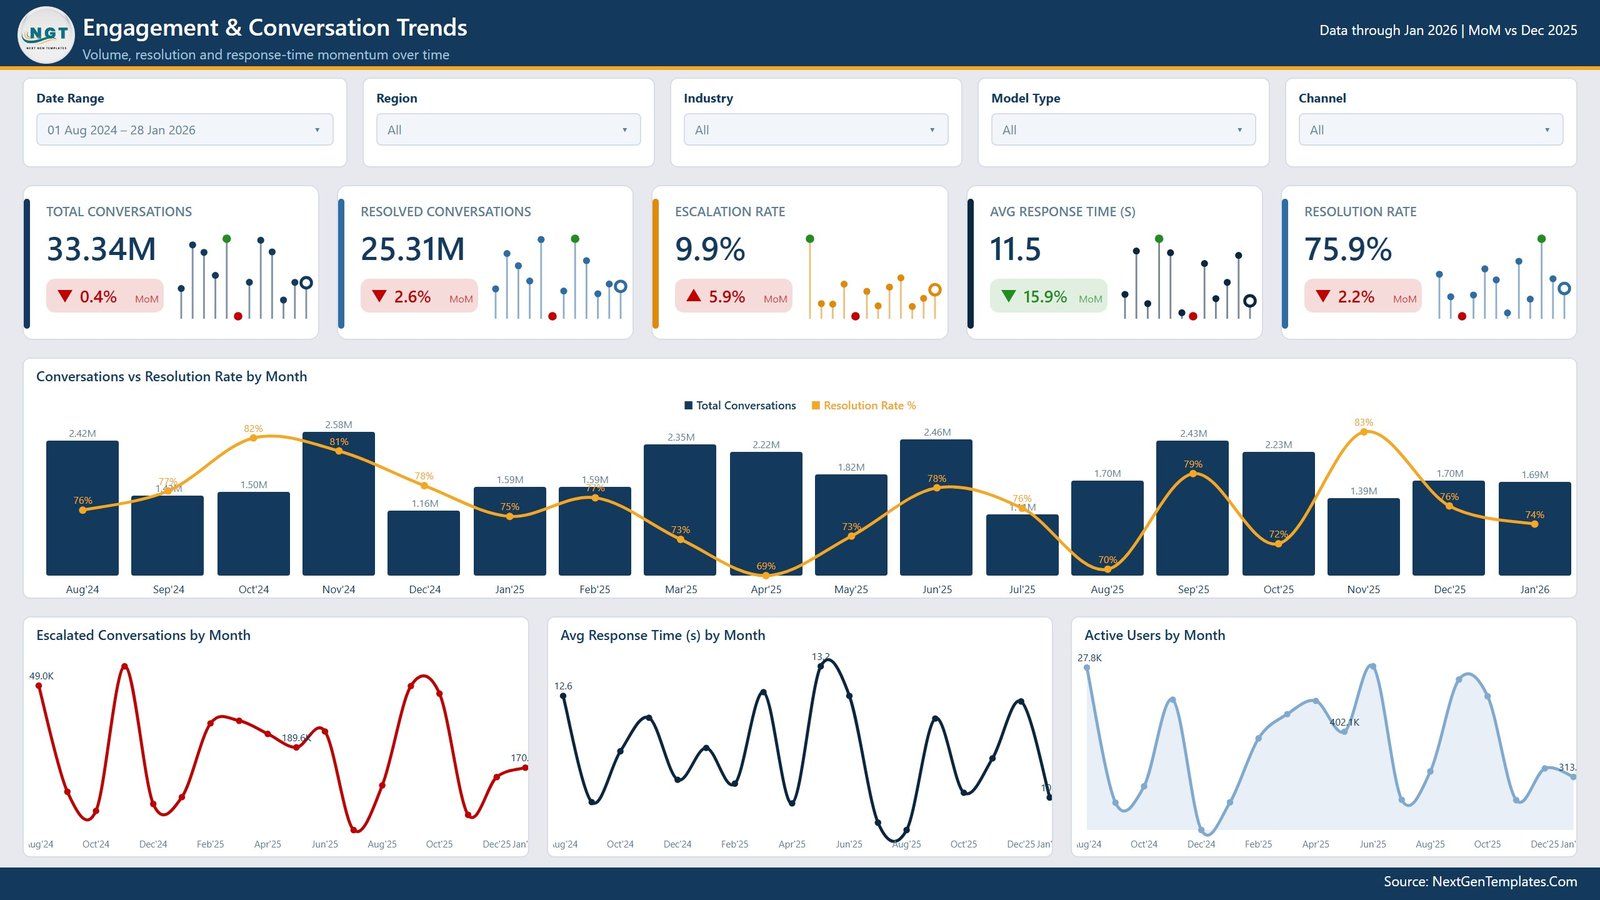
This page helps teams see whether growth is healthy. If conversations increase but resolution rate falls, the chatbot flow may need improvement. If escalation rate rises, support leaders can review which provider, channel, or model type is creating more human workload.
3. Provider Analysis
The Provider Analysis page shows where revenue, profit, and satisfaction are concentrated by provider. Users can quickly review subscription revenue, net profit, total conversations, active users, and satisfaction. The page compares revenue by provider, revenue against margin with conversation size, revenue by industry and provider, and a provider scorecard that brings revenue, net profit, conversations, and rating into one table.
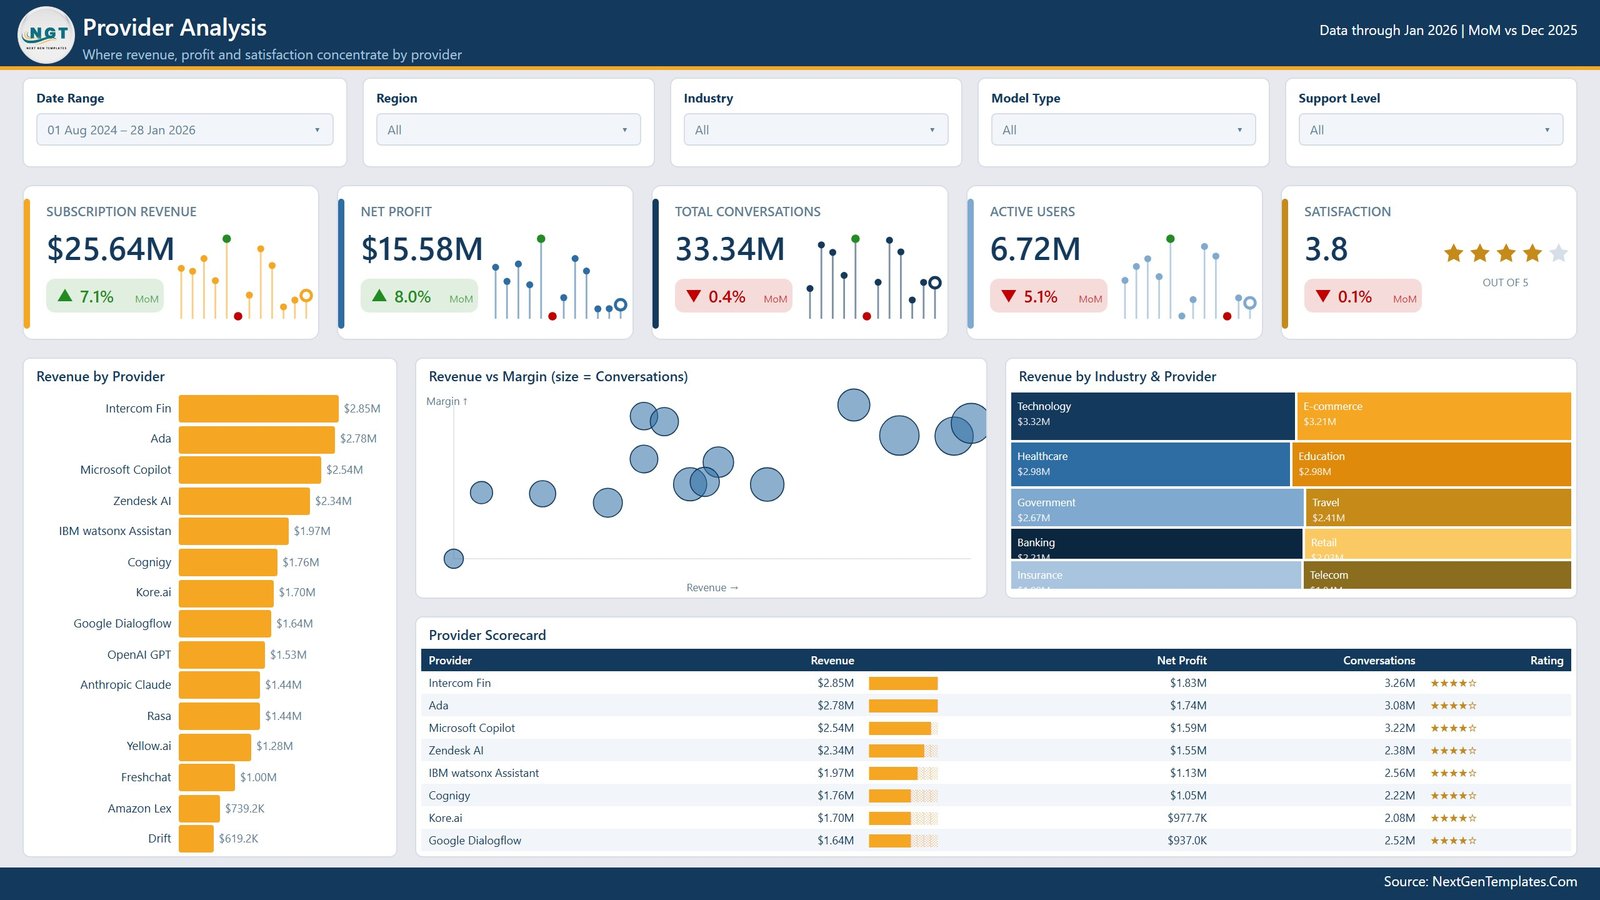
Provider-level reporting is useful when a company works with multiple chatbot platforms, models, vendors, or internal bot products. Instead of looking only at volume, the dashboard helps compare commercial return, satisfaction, active user adoption, and margin behavior together.
4. Revenue and Profitability Insights
The Revenue and Profitability Insights page shifts the focus to financial performance. Cards show subscription revenue, total cost, net profit, profit margin, and ARPU. This page breaks down revenue and margin by plan tier, revenue by region, regional profit and loss, and revenue by industry, helping users see which segments are driving stronger profitability.
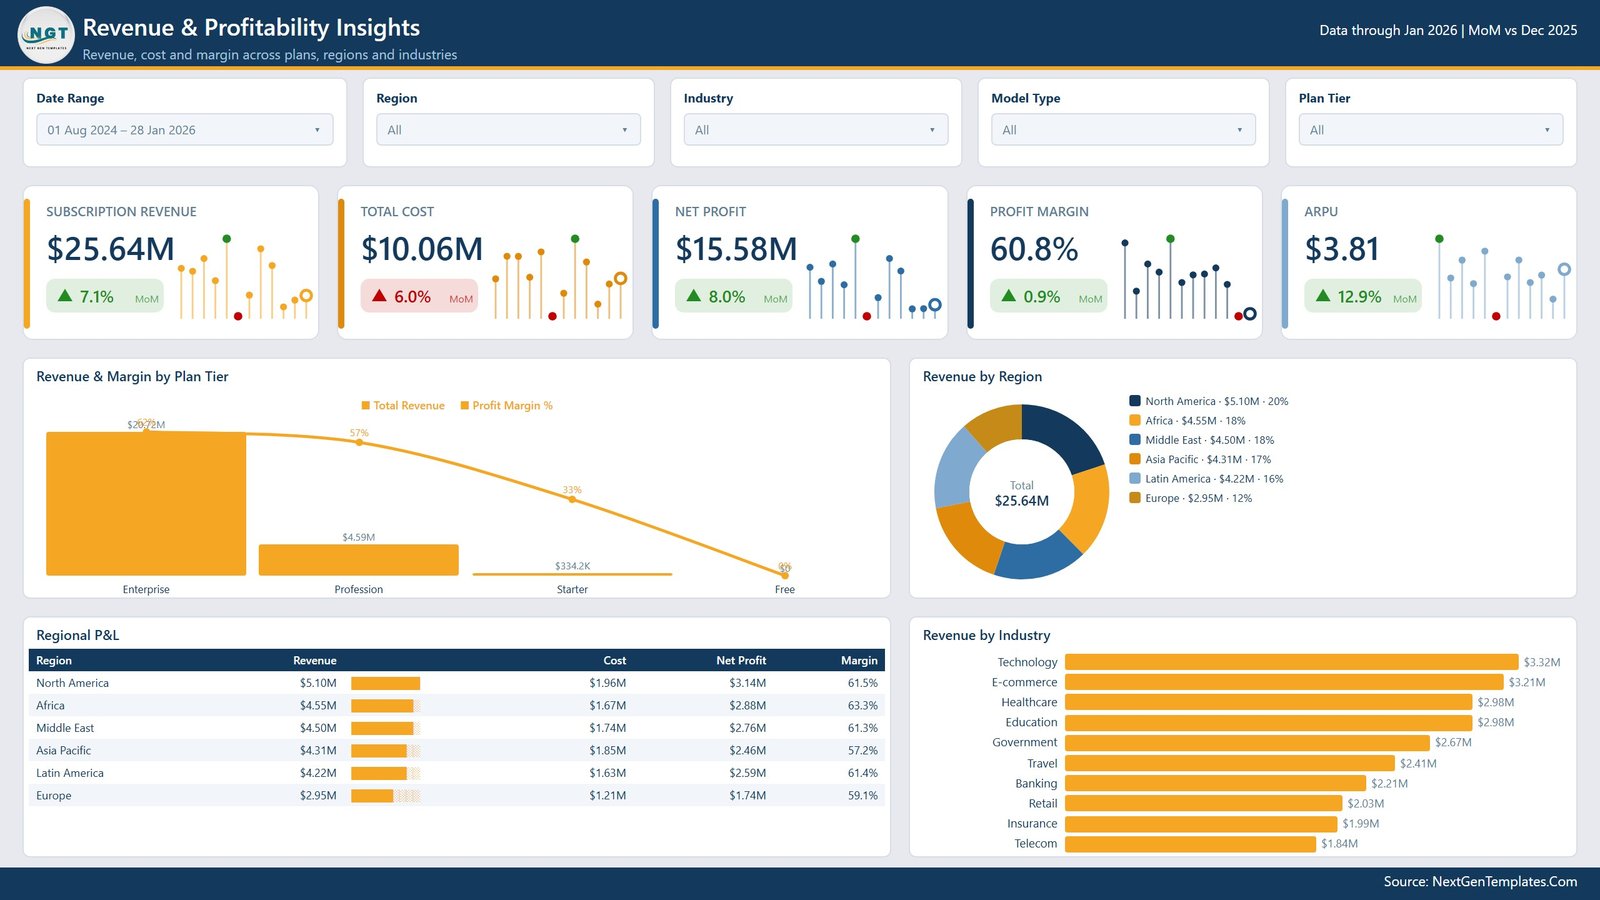
Finance and RevOps teams can use this page to evaluate plan tier performance, regional opportunity, and industry-level demand. It is especially helpful when chatbot revenue is growing but support cost or provider cost may be reducing net profit.
5. Operations and Channels
The Operations and Channels page monitors deployment, channel, and support performance across the chatbot fleet. KPI cards cover total conversations, escalation rate, average response time, resolution rate, and support cost. The visuals show conversations by country, channel, and model type, plus revenue by deployment type and support cost by support level.
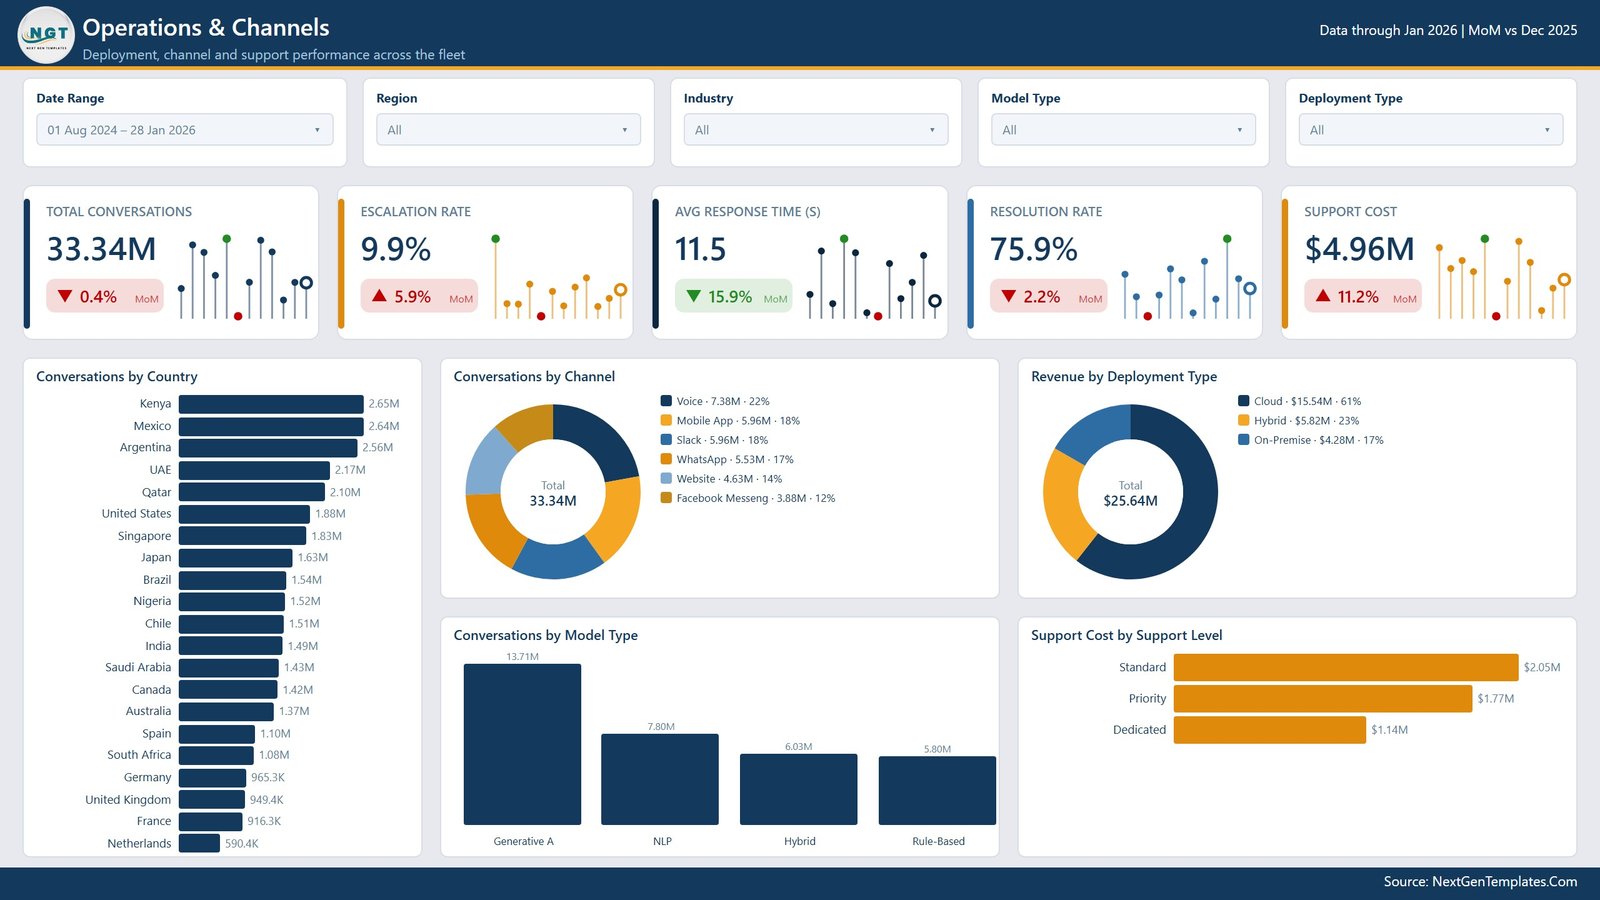
This page is useful for support operations and implementation teams. It helps them understand which countries, channels, model types, deployments, and support levels are creating the highest activity and cost.
AI Chatbot Providers Dashboard in Power BI vs. Tableau vs. Paid CRM/SaaS – Feature Comparison
| Feature | This Power BI dashboard | Tableau alternative | Paid CRM/SaaS alternative |
|---|---|---|---|
| Cost | One-time template purchase | Tableau license plus development time | Recurring subscription or per-seat pricing |
| Platform | Microsoft Power BI Desktop | Tableau Desktop or Cloud | Vendor-hosted CRM, support, or chatbot platform |
| Setup time | Open PBIX, replace source data, and refresh | Requires model and dashboard build | Requires onboarding and configuration |
| Real-time team collaboration | Available through Power BI Service with the right license | Available through Tableau Cloud/Server | Usually included with licensed users |
| Mobile access | Available through Power BI mobile/service workflows | Available through Tableau mobile/cloud workflows | Usually included |
| Customizable fields | Editable visuals, pages, measures, and model | Editable if you own the workbook | Depends on vendor permissions |
| Share with link | Possible through Power BI Service and permissions | Possible through Tableau Cloud/Server | Usually login-based |
| Year-1 cost at 5 users | Low template cost plus Microsoft licensing if published | Higher license and build cost | Often much higher due to subscription seats |
| Chatbot metrics | Revenue, conversations, users, resolution, escalation, CSAT, providers, channels, model types, regions, plan tiers, and support cost | Must be designed manually | Depends on product reporting depth |
Who Should Use This Template
This template is useful for AI chatbot providers, SaaS companies, support leaders, product managers, customer success teams, RevOps analysts, BI analysts, and consultants who prepare recurring chatbot performance reports. It works best when the user already has structured data from a chatbot platform, CRM, support desk, billing system, or monthly export.
It is not a replacement for a chatbot platform, ticketing system, live monitoring tool, API integration layer, billing engine, or CRM. It will not run conversations, train a model, process tickets, or sync automatically with every provider API by default. It is a reporting template for analysis-ready data.
Real-World Use Cases
Ananya, SaaS operations manager: uses the Overview and Provider Analysis pages to compare subscription revenue, active users, net profit, conversation volume, and satisfaction across chatbot providers before the monthly leadership review.
Michael, support director: reviews escalation rate, average response time, resolved conversations, resolution rate, and support cost to see whether chatbot automation is reducing workload or shifting it to a different channel.
Priya, AI consulting analyst: prepares client reporting by filtering provider performance by industry, region, plan tier, and model type. The provider scorecard helps her explain which bot programs are producing better return and which ones need tuning.
Advantages of AI Chatbot Providers Dashboard in Power BI
The main advantage is speed. Users start with an already structured PBIX report instead of designing pages, cards, slicers, charts, and model logic from a blank file. The dashboard also keeps commercial, engagement, provider, financial, and operations views together so teams do not need five separate reports.
The second advantage is flexibility. Because the template is built in Power BI, users can change visuals, add measures, adjust data fields, customize colors, and connect to a different source when they are ready. It is suitable for internal reviews, client reporting, product updates, support operations meetings, and management dashboards.
Opportunities for Improvement
The dashboard depends on the quality and structure of the input data. Provider names, channels, model types, plan tiers, regions, support levels, and dates should be consistent. If names are inconsistent, Power BI may split one provider or channel into multiple items.
The template is also not a live integration by itself. Teams that need automatic refresh from production systems may need Power Query setup, gateway configuration, API work, or a formal data warehouse. For many teams, a clean weekly or monthly export is enough; for real-time monitoring, a custom BI implementation may be better.
Best Practices
- Standardize provider names: Keep provider, model type, channel, region, industry, and plan tier values consistent before refresh.
- Validate financial definitions: Decide what counts as subscription revenue, total cost, net profit, support cost, and ARPU.
- Refresh before reviews: Update the source data, refresh the PBIX file, and check filters before sharing screenshots or exports.
- Review escalation patterns: Rising escalation rate can indicate weak bot coverage, unclear customer journeys, or complex support issues.
- Use filters for stakeholder views: Filter by region, industry, plan tier, or model type to tailor the story for finance, support, product, and sales teams.
Explore Relevant Templates
You can purchase the template here: AI Chatbot Providers Dashboard in Power BI.
For related reporting, explore AI Chatbot Providers Dashboard in Excel, Cloud Hosting Dashboard in Power BI, and DevOps Dashboard in Power BI. You can also browse more Power BI dashboard templates.
Frequently Asked Questions
What does the AI Chatbot Providers Dashboard in Power BI track?
It tracks conversations, subscription revenue, resolution rate, active users, satisfaction, escalation rate, response time, total cost, net profit, profit margin, ARPU, providers, regions, industries, channels, model types, plan tiers, countries, deployment types, and support levels.
How many report pages are included?
The Power BI report includes 5 pages: Overview, Engagement and Conversation Trends, Provider Analysis, Revenue and Profitability Insights, and Operations and Channels.
Can I use my own chatbot data?
Yes. Replace or map the sample source with your own structured chatbot provider data and refresh the report.
Do I need Power BI Desktop?
Yes. You need Microsoft Power BI Desktop to open and edit the PBIX file.
Can I customize the dashboard?
Yes. You can edit visuals, pages, measures, filters, colors, labels, and the data model in Power BI Desktop.
Is this a chatbot or CRM system?
No. It is a Power BI reporting dashboard, not a chatbot engine, help desk, CRM, billing system, or ticketing platform.
About the Author
Built by PK – Microsoft Certified Professional with 15+ years of Excel, Google Sheets, and Power BI experience. Founder of NextGenTemplates, reaching 300K+ subscribers across YouTube channels. Every template is hand-built and tested before release.
Conclusion
The AI Chatbot Providers Dashboard in Power BI gives teams a practical way to review chatbot conversations, subscription revenue, resolution quality, active users, provider performance, financial margin, operations, channels, support cost, and satisfaction in one PBIX report. It is best suited for teams that want a flexible Power BI reporting layer without starting from a blank dashboard.
Click here to purchase the AI Chatbot Providers Dashboard in Power BI
Instant download. One-time payment. No subscription for the template itself.
For step-by-step Excel, Power BI, and dashboard tutorials, visit youtube.com/@PKAnExcelExpert.
Last updated: August 11, 2026.