The concert promotion business moves quickly. A single tour or event season can include multiple cities, venues, artists, genres, marketing campaigns, sponsorship deals, merchandise streams, and expense categories. When those numbers stay scattered across raw spreadsheets, promoters lose time trying to answer basic questions: Which genre produces the highest profit? Which venue is under capacity? Which artist generated the most revenue? Where is marketing spend rising faster than sales?
The Concert Promoters Dashboard in Excel is built to answer those questions in one workbook. It gives concert promoters, venue teams, entertainment agencies, and event finance managers a structured Excel dashboard for tracking gross revenue, net profit, tickets sold, total expenses, marketing spend, sponsorship, merchandise, artist performance, city trends, event types, and regional profitability.
Click here to get the Concert Promoters Dashboard in Excel
Key Features of Concert Promoters Dashboard in Excel
- Ready-to-use Excel dashboard for concert promoter and live entertainment analytics.
- 7 worksheet tabs covering overview, revenue, event performance, marketing, sponsorship, artist insights, data, and support pivots.
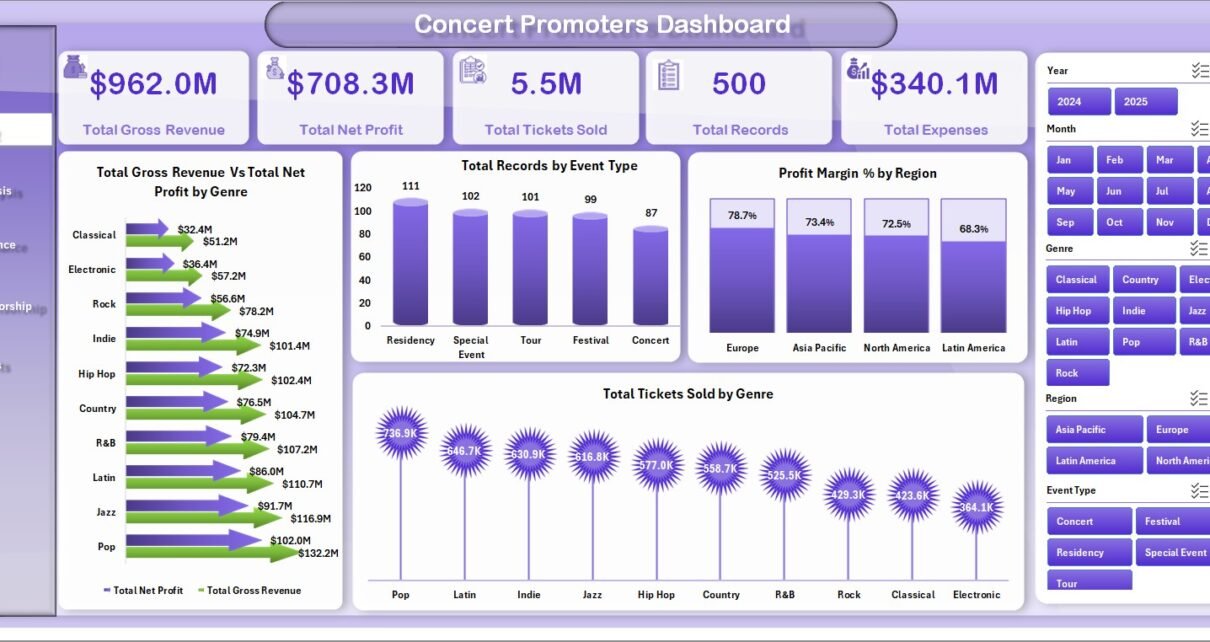
- 5 high-level KPI cards: Total Gross Revenue, Total Net Profit, Total Tickets Sold, Total Records, and Total Expenses.
- Multiple slicers for quick filtering and instant dashboard review.
- Revenue analysis by city, event type, year, and month.
- Ticket and capacity analysis by event type and venue.
- Marketing spend analysis by region, month, genre, artist, and event type.
- Artist insights for comparing tickets sold, genre revenue, and regional demand.
- Structured Data sheet for replacing the sample records with your own concert promoter data.
- Support sheet with pivot tables that feed the dashboard dynamically.
Dashboard Pages Explanation
This workbook includes multiple dashboard pages. Each page focuses on a different business question, while the slicers help you filter the data quickly and review a focused view of the dashboard.
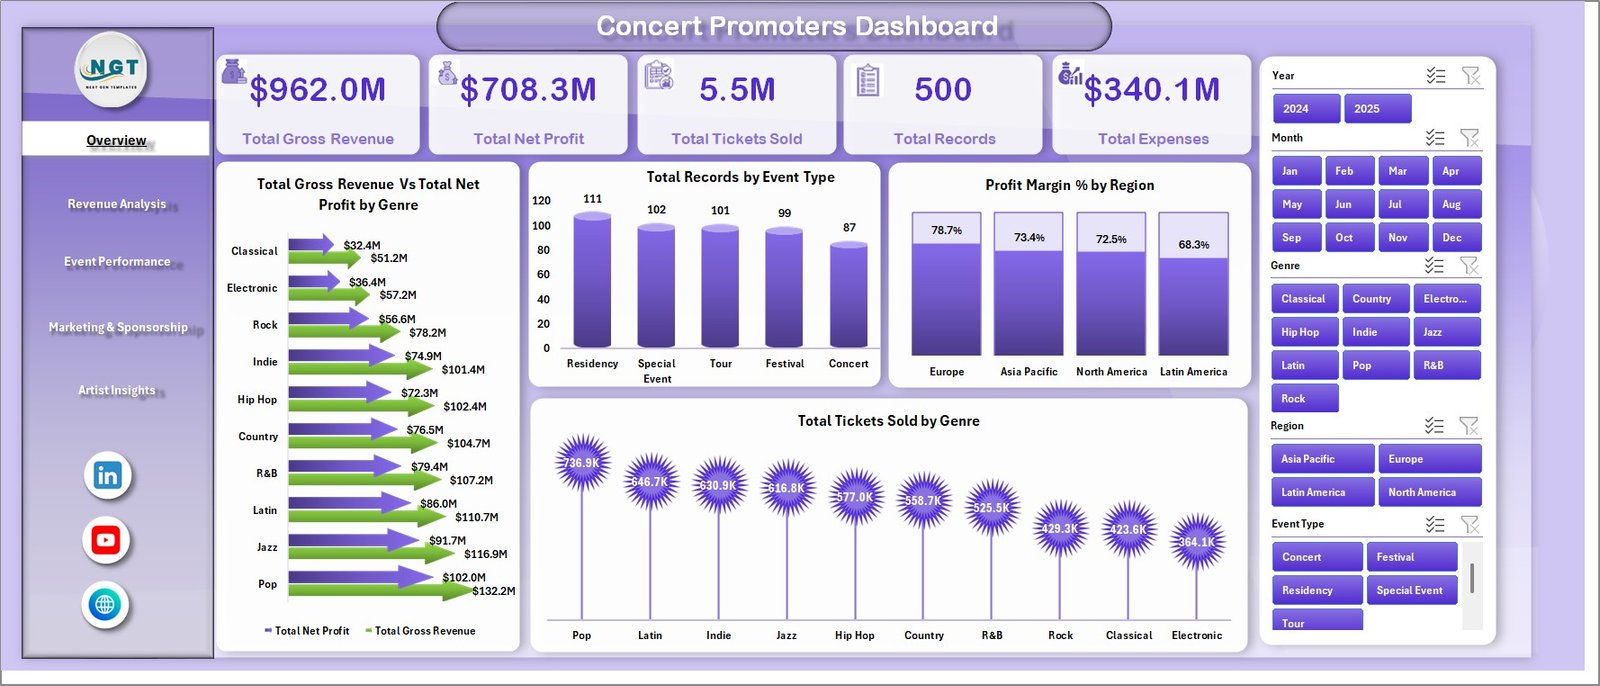
1. Overview Page
The Overview Page is the main executive summary page. At the top, it shows high-level cards for Total Gross Revenue, Total Net Profit, Total Tickets Sold, Total Records, and Total Expenses. These KPIs help managers understand the overall scale and financial condition of the concert portfolio before moving into deeper analysis.
The page also includes key charts such as Total Gross Revenue vs Total Net Profit by Genre, Total Records by Event Type, Profit Margin % by Region, and Total Tickets Sold by Genre. The genre comparison helps identify music categories that bring strong revenue and profit together. The event type and regional views help promoters decide where to focus future bookings, sponsorship efforts, and promotional budgets.
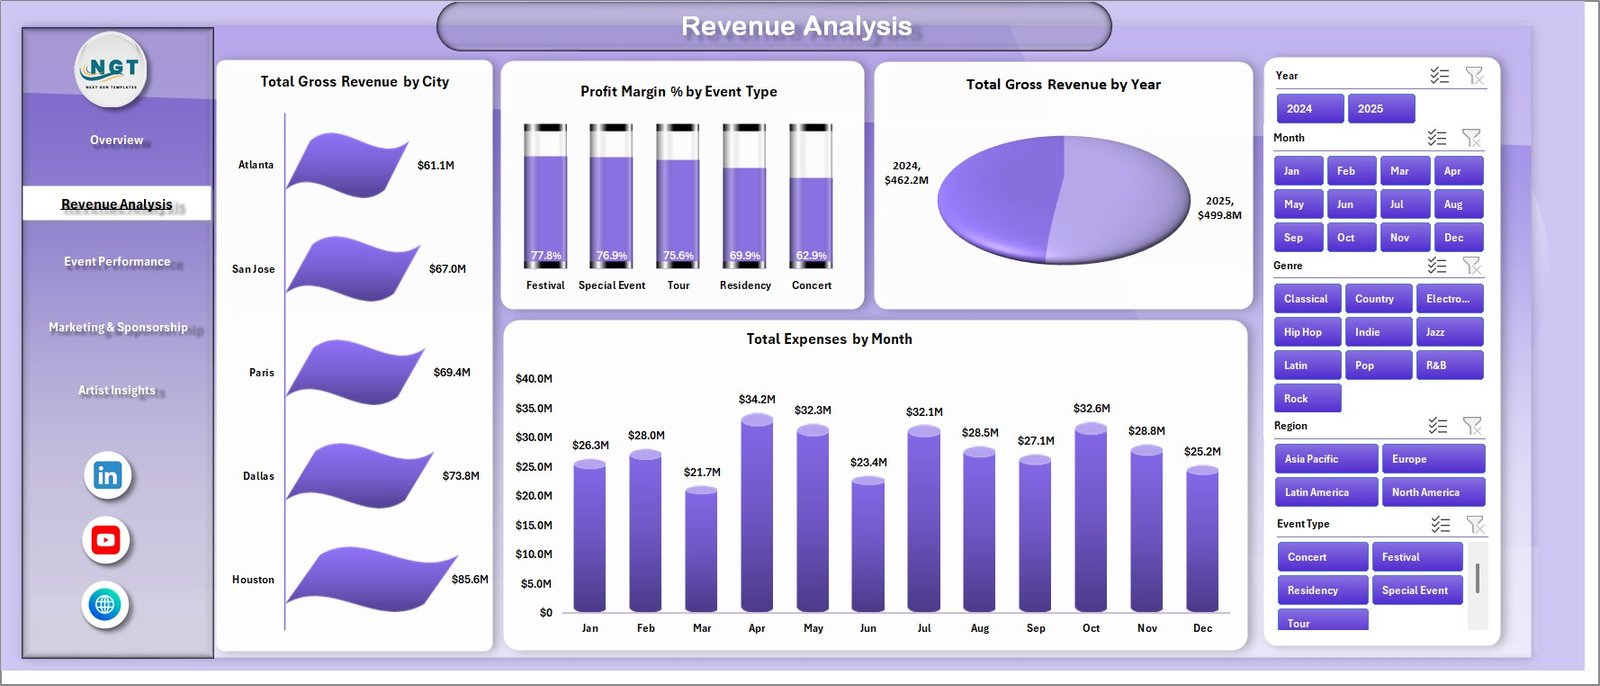
2. Revenue Analysis
The Revenue Analysis page focuses on financial performance. Total Gross Revenue by City helps identify the strongest city markets, while Profit Margin % by Event Type shows which event formats are profitable after costs. Total Gross Revenue by Year helps promoters review year-over-year growth, and Total Expenses by Month highlights seasonal or campaign-driven cost increases.
This page is useful during monthly finance reviews, investor updates, tour planning, and post-event performance discussions. Instead of reviewing revenue and expense columns manually, users can see the financial story in chart form.
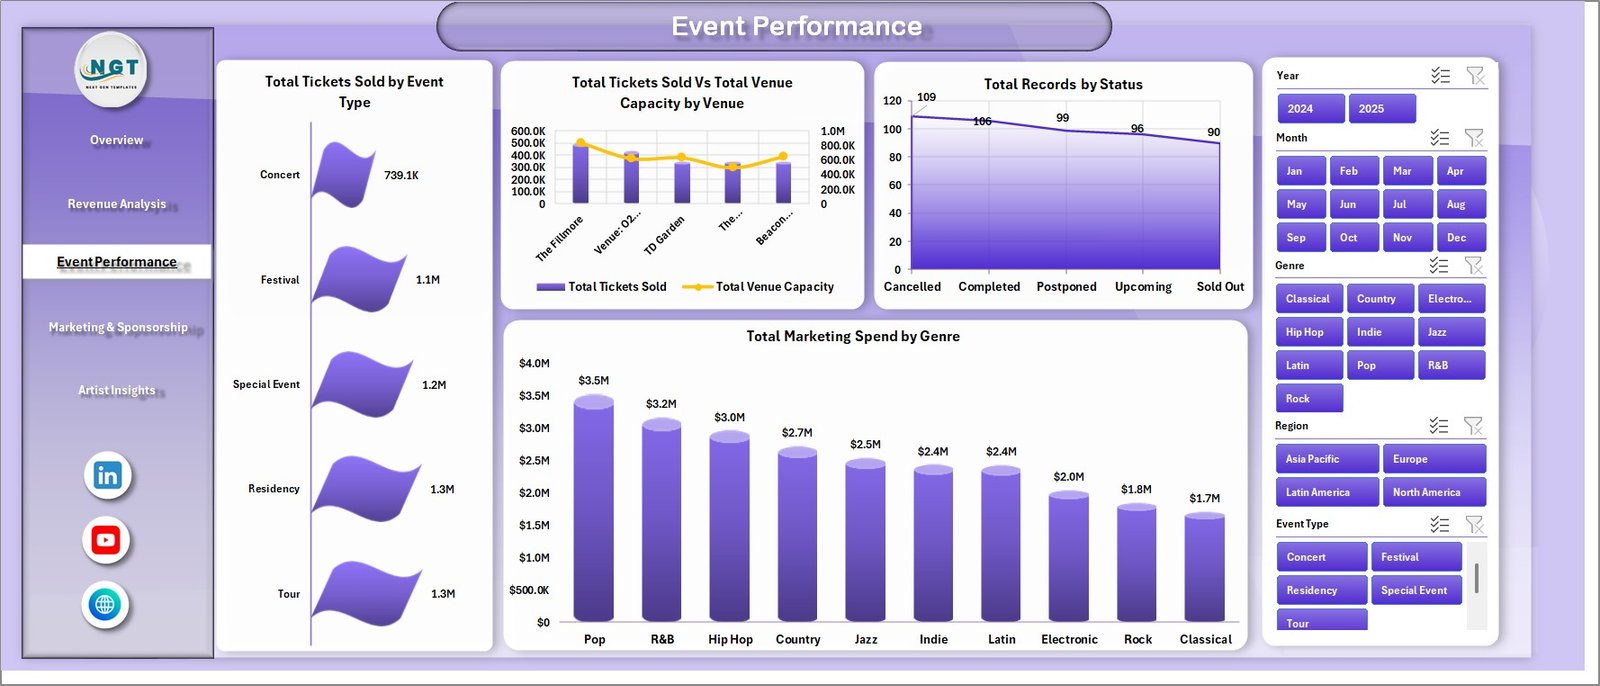
3. Event Performance
The Event Performance page reviews how well events performed operationally. Total Tickets Sold by Event Type shows which concert formats are attracting audience demand. Total Tickets Sold vs Total Venue Capacity by Venue helps identify where seating capacity is being used well and where demand is below the available venue size.
Total Records by Status gives a quick status breakdown of the event dataset, while Total Marketing Spend by Genre shows where promotional money is being allocated. Together, these views help promoters understand whether marketing investment is aligned with actual event performance.
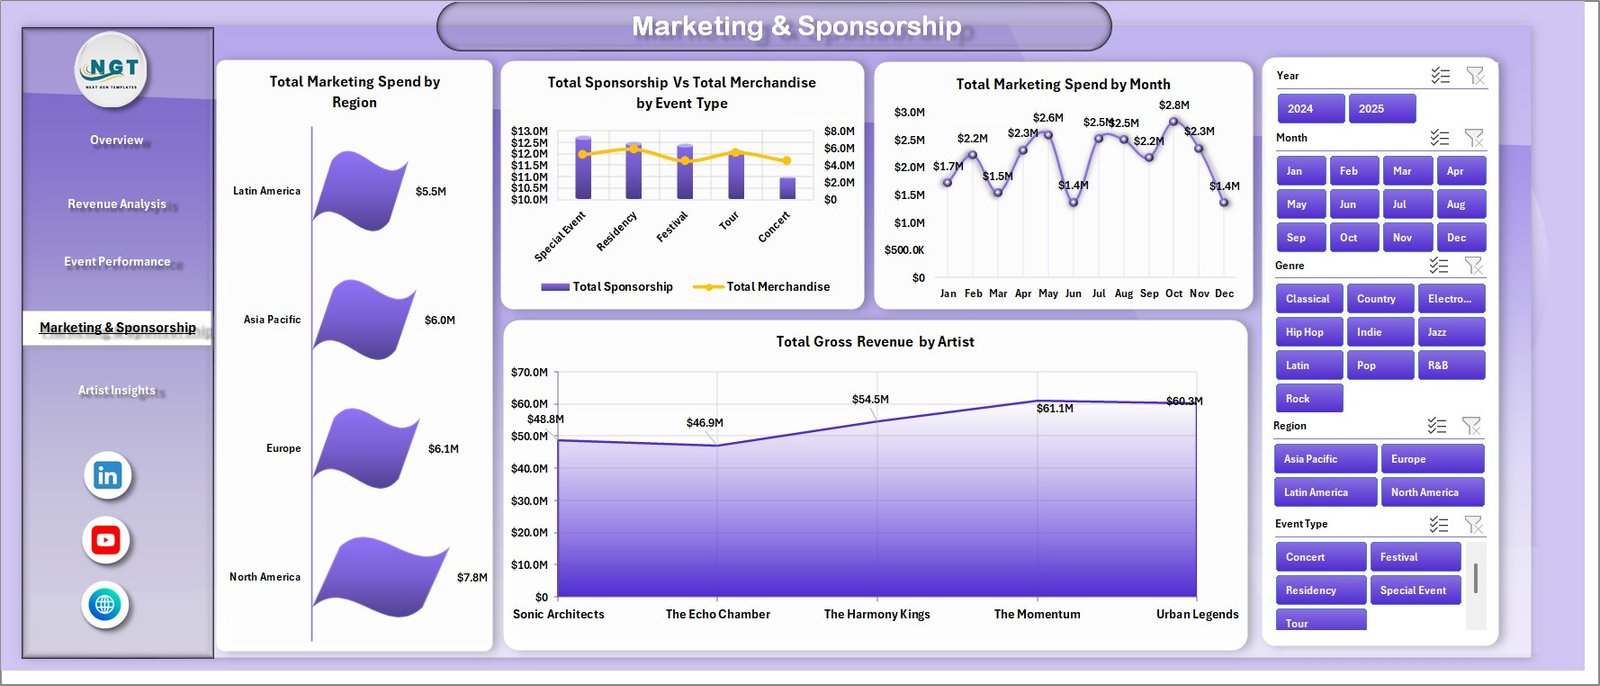
4. Marketing and Sponsorship
The Marketing and Sponsorship page connects promotional spend with revenue, sponsorship, and merchandise activity. Total Marketing Spend by Region helps teams see which regions are receiving the biggest campaign budgets. Total Sponsorship vs Total Merchandise by Event Type compares two important non-ticket revenue streams across event categories.
Total Marketing Spend by Month reveals timing patterns in promotion activity, while Total Gross Revenue by Artist helps promoters compare artist-level earning power. This page is especially useful when planning advertising budgets, sponsor packages, and artist booking priorities.
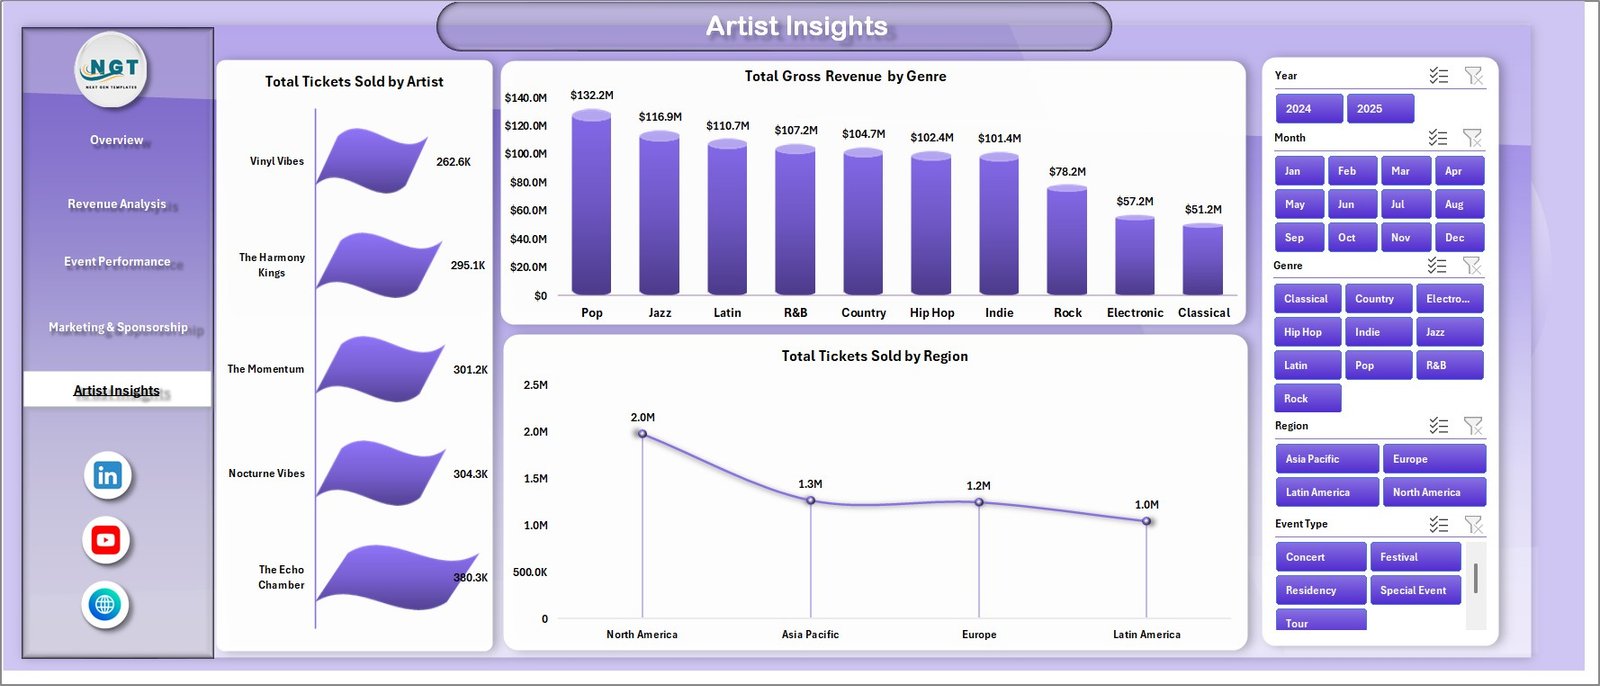
5. Artist Insights
The Artist Insights page is designed for artist and lineup decisions. Total Tickets Sold by Artist helps compare audience pull across performers. Total Gross Revenue by Genre shows which music categories contribute the most revenue, while Total Tickets Sold by Region reveals regional demand patterns.
Promoters can use this page before booking new shows, renewing artist agreements, choosing cities for repeat events, or planning future festival lineups. It turns artist performance into a visual comparison instead of a manual spreadsheet review.
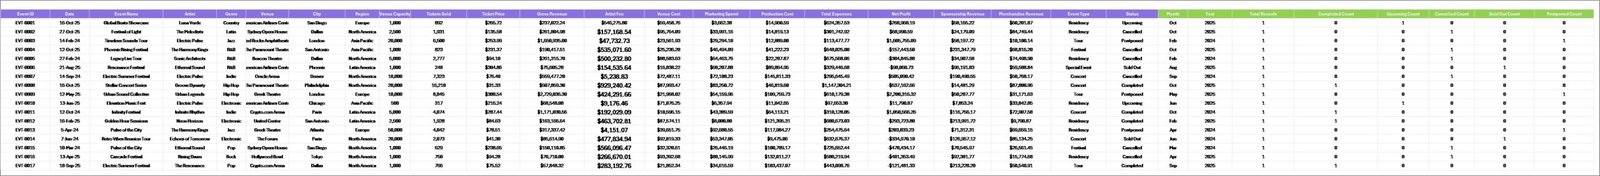
6. Data Sheet Tab
The Data sheet is the input area. This is where you add data in the same format as the sample records. Keep the column structure consistent so the pivot tables can read the data correctly. After replacing the sample rows with your own records, refresh the workbook to update every page.
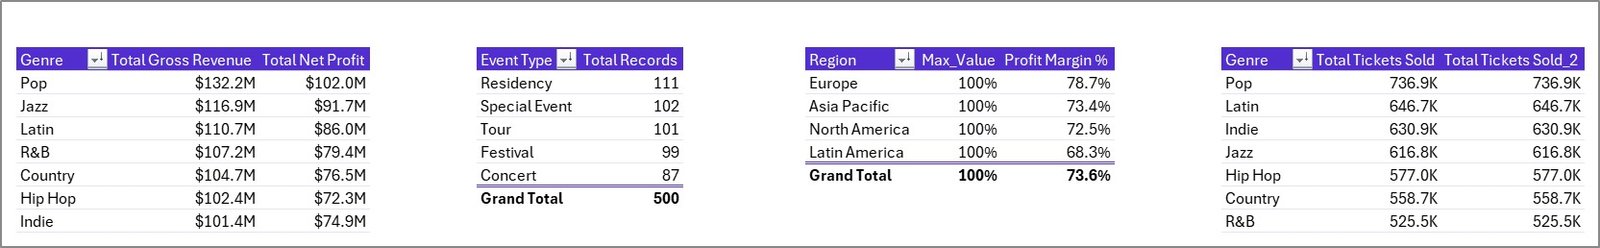
7. Support Sheet Tab
The Support sheet contains the pivot tables that create the dashboard dynamically. After updating the Data sheet, go to the Data tab in the Excel Ribbon and click Refresh All. The pivot tables and charts will refresh together. You can keep this sheet hidden during normal dashboard use.
For official Microsoft guidance on refreshing PivotTable data, see Microsoft Support: Refresh PivotTable data.
Concert Promoters Dashboard in Excel vs. Google Sheets vs. Paid Event SaaS – Feature Comparison
| Feature | Concert Promoters Dashboard in Excel | Google Sheets Alternative | Paid Event SaaS |
|---|---|---|---|
| Cost | One-time $17.99 sale price | Low cost but often needs custom setup | Monthly or annual subscription |
| Platform | Microsoft Excel | Google Sheets in browser | Vendor cloud platform |
| Setup time | Under 10 minutes after download | Depends on template and sharing setup | Days or weeks for configuration |
| Offline access | Yes | Limited offline mode | Usually no |
| Real-time team collaboration | Requires OneDrive or SharePoint | Built into Google Sheets | Usually included |
| Customizable fields | Editable workbook and pivot structure | Editable but formulas may need rebuilds | Limited by plan and permissions |
| Year-1 cost at 5 users | $17.99 plus existing Excel licenses | Low direct cost, higher setup effort | Can reach hundreds or thousands per year |
| Best use case | Fast Excel analytics for concert records | Shared planning and lightweight collaboration | Full ticketing, CRM, settlements, and automation |
Who Should Use This Template
- Concert promoters managing revenue, ticket sales, expenses, and artist performance.
- Venue managers comparing event capacity and ticket outcomes.
- Entertainment agencies reviewing artist, genre, and regional performance.
- Festival teams tracking sponsorship, merchandise, and promotional spend.
- Finance teams preparing event profitability reports.
- Marketing teams reviewing campaign spend by region, month, and genre.
Real-World Use Cases
Independent promoter: A promoter running 20 shows per quarter updates the Data sheet after each show, refreshes the workbook, and reviews gross revenue, net profit, and tickets sold before deciding which city to book next.
Venue operations team: A venue manager compares tickets sold vs venue capacity to see whether the current artist lineup is matching the room size. Underfilled events can be investigated by genre, region, or marketing spend.
Artist management team: An artist manager reviews Total Gross Revenue by Artist and Total Tickets Sold by Region before deciding where to focus the next tour segment.
Advantages of Concert Promoters Dashboard in Excel
- It keeps key concert promoter metrics in one familiar Excel workbook.
- It saves time compared with manually rebuilding pivot charts after each event.
- It supports fast filtering through slicers.
- It helps compare revenue, profit, expenses, ticket sales, sponsorship, merchandise, and marketing spend.
- It can be edited and adapted to different concert, festival, venue, and tour workflows.
- It uses a one-time purchase model instead of ongoing software fees.
Opportunities for Improvement
This template is a reporting dashboard, not a live event operations platform. It does not connect directly to ticketing systems, send sponsor invoices, process settlements, scan tickets, or automate CRM communication. If you need those workflows, use dedicated event software and export your data into Excel for reporting.
It is also important to keep the Data sheet clean. If column names are changed or formulas are overwritten, the pivot tables may need adjustment. For best results, keep a backup copy before making structural edits.
Best Practices
- Use the same data format every time you update the Data sheet.
- Refresh all pivots after every data update.
- Keep the Support sheet hidden for normal users to avoid accidental pivot edits.
- Review the Overview page first, then move into revenue, event, marketing, and artist pages.
- Use slicers to isolate one city, artist, genre, region, or event type before making decisions.
- Archive a copy of the workbook after each reporting cycle.
Explore Relevant Templates
- Concert Promoters Dashboard in Excel
- Ticketing and Live Events KPI Dashboard in Excel
- Music Industry KPI Dashboard in Power BI
- Political Campaign Dashboard in Power BI
- Browse more Excel Dashboard templates
Frequently Asked Questions
What is the Concert Promoters Dashboard in Excel?
It is a ready-to-use Excel dashboard for analyzing concert promoter data, including gross revenue, net profit, tickets sold, expenses, marketing spend, sponsorship, merchandise, artists, genres, regions, cities, venues, and event types.
How many pages are included?
The workbook includes Overview, Revenue Analysis, Event Performance, Marketing and Sponsorship, Artist Insights, Data Sheet, and Support Sheet tabs.
Can I replace the sample data?
Yes. Replace the sample records in the Data sheet while keeping the same structure, then refresh all pivots and charts.
Do I need advanced Excel knowledge?
No. Basic Excel knowledge is enough for normal use. You mainly need to update data, refresh the workbook, and use slicers.
Can I customize the workbook?
Yes. You can edit the workbook, adjust charts, change colors, update slicers, and modify pivot tables as needed.
Does it connect directly to ticketing software?
No. Export your event or ticketing data to Excel format, paste it into the Data sheet, and refresh the dashboard.
Can I hide the Support sheet?
Yes. The Support sheet contains pivot tables and can be hidden after setup.
About the Author
Built by PK – Microsoft Certified Professional with 15+ years of Excel, Google Sheets, and Power BI experience. Founder of NextGenTemplates, reaching 300K+ subscribers across YouTube channels. Every template is hand-built and tested before release.
Conclusion
The Concert Promoters Dashboard in Excel helps turn raw concert promoter data into a clear reporting system. With KPI cards, slicers, pivot-driven charts, data input, and support pivots, it gives event teams a practical way to review revenue, profit, expenses, tickets, marketing spend, sponsorship, merchandise, artist performance, and regional demand.
Click here to download the Concert Promoters Dashboard in Excel
For more Excel dashboard tutorials and step-by-step videos, visit YouTube.com/@PKAnExcelExpert.
Last updated: May 2026.