New: NextGenTemplates Academy - video courses on Excel formulas with AI and Pivot Tables & dashboards. Early-bird: 20% off with code EARLYBIRD20 - first 20 orders only.See the courses →
PKComments Off on Dating Events Dashboard in Power BI
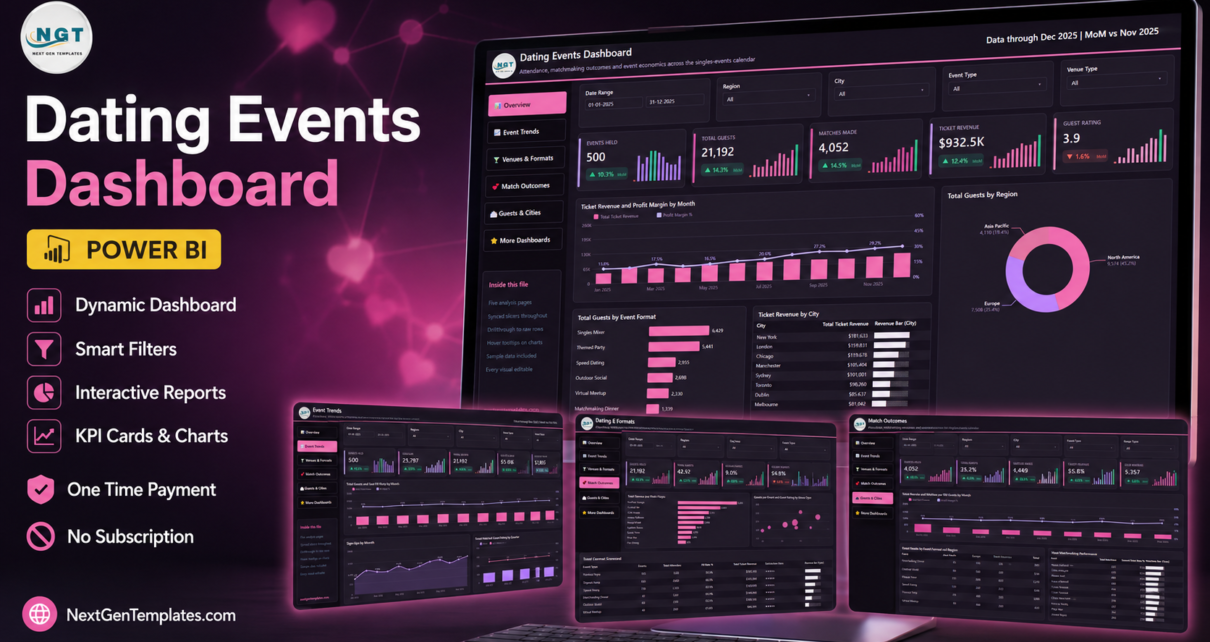
The Dating Events Dashboard in Power BI reports on a calendar of 500 singles events across 9 venue types, 6 event formats, 8 cities and 3 regions, using 35 DAX
PKComments Off on Dating Events Dashboard in Excel
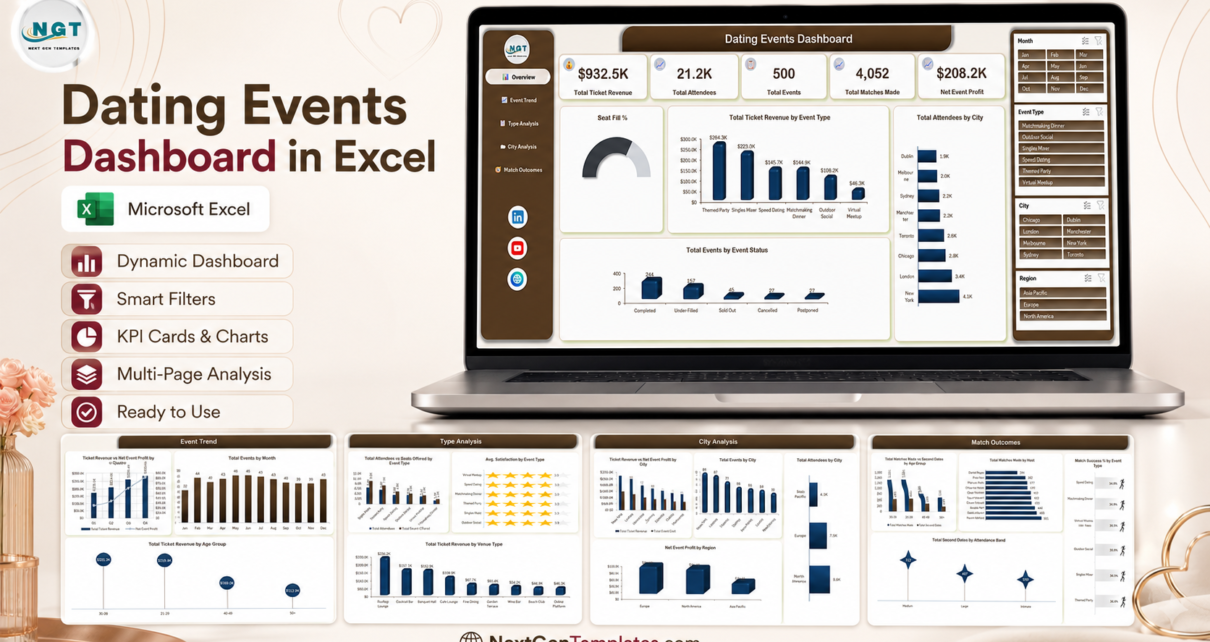
Running dating events as a business is an operations problem long before it is a romance one. A speed dating night has a room cost, a seat count, a no-show
PKComments Off on Concert Promoters Dashboard in Excel
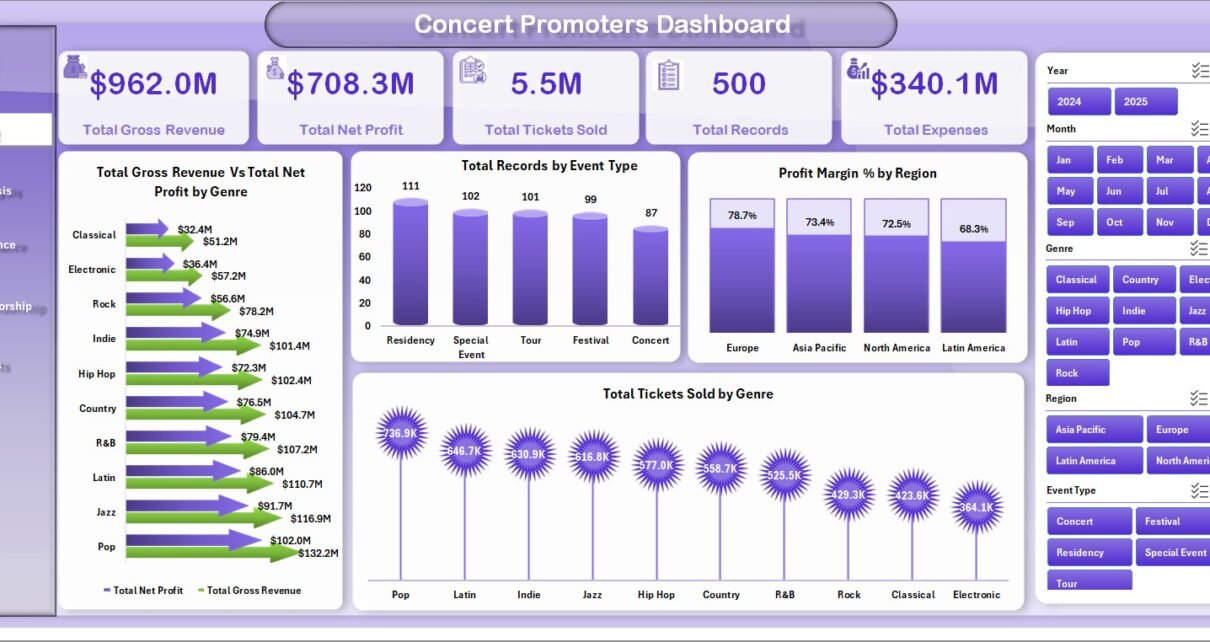
The concert promotion business moves quickly. A single tour or event season can include multiple cities, venues, artists, genres, marketing campaigns, sponsorship deals, merchandise streams, and expense categories. When those
PKComments Off on Event Management Analysis Dashboard in Power BI
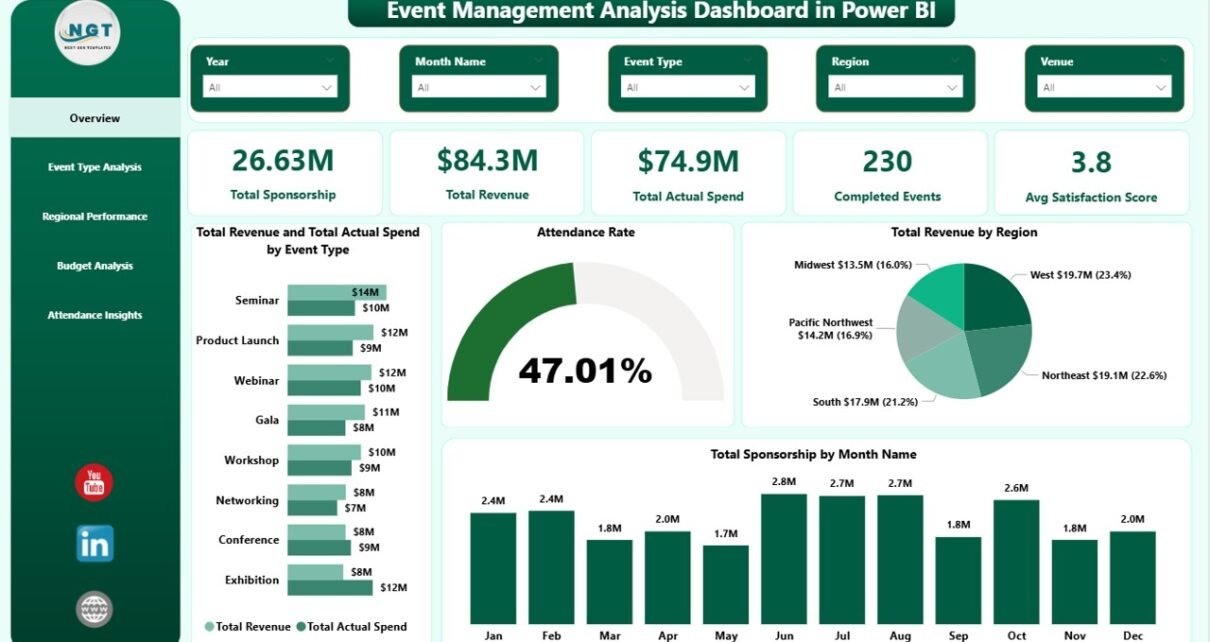
The Event Management Analysis Dashboard in Power BI is a 5-page .pbix template built for event managers who need to track sponsorship, revenue, spend, attendance, and satisfaction in one interactive
PKComments Off on Book Fairs Dashboard in Power BI
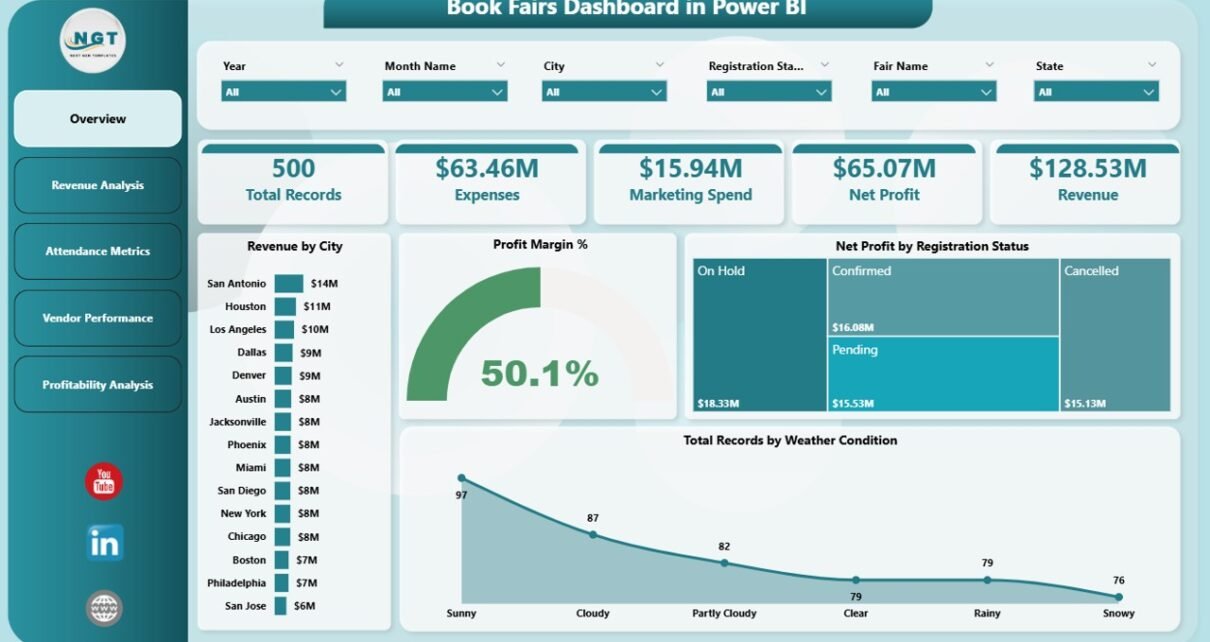
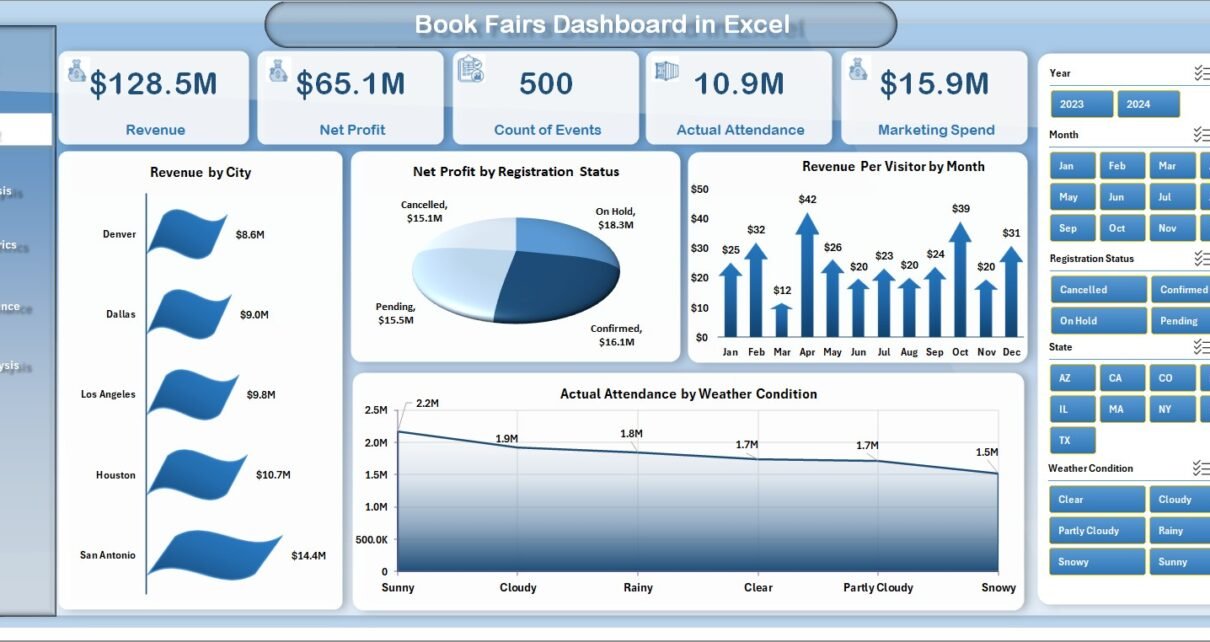
In today’s fast-growing event industry, book fairs generate massive amounts of data every single day. Organizers manage visitor attendance, vendor performance, ticket revenue, and profitability all at once. However, when
In today’s fast-changing event industry, book fairs generate a huge amount of data every single day. From visitor attendance to vendor sales and revenue tracking, organizers must handle multiple data
PKComments Off on Arts and Culture Dashboard in Power BI
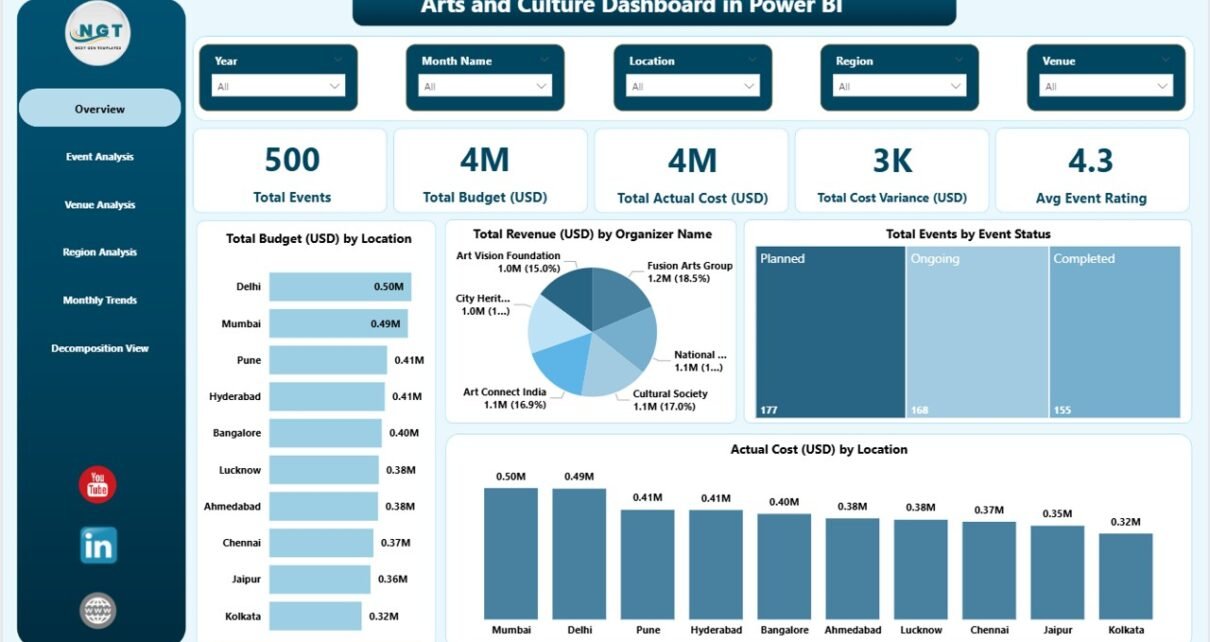
In today’s digital era, arts and culture organizations must balance creativity with efficient management. Museums, cultural institutions, art festivals, galleries, and event organizers handle multiple activities simultaneously, including budgeting, artist
PKComments Off on Ticketing and Live Events Dashboard in Power BI
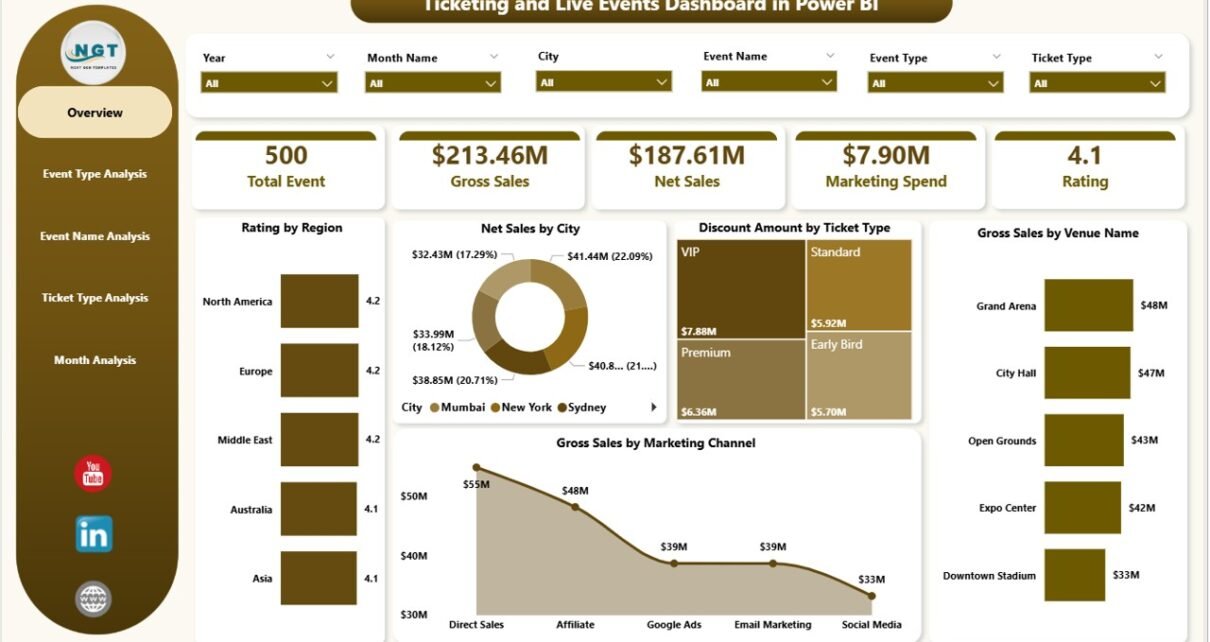
The live events industry moves fast. Ticket sales change daily. Marketing campaigns impact revenue instantly. Audience ratings influence future bookings. Therefore, event organizers must track everything in real time. However,
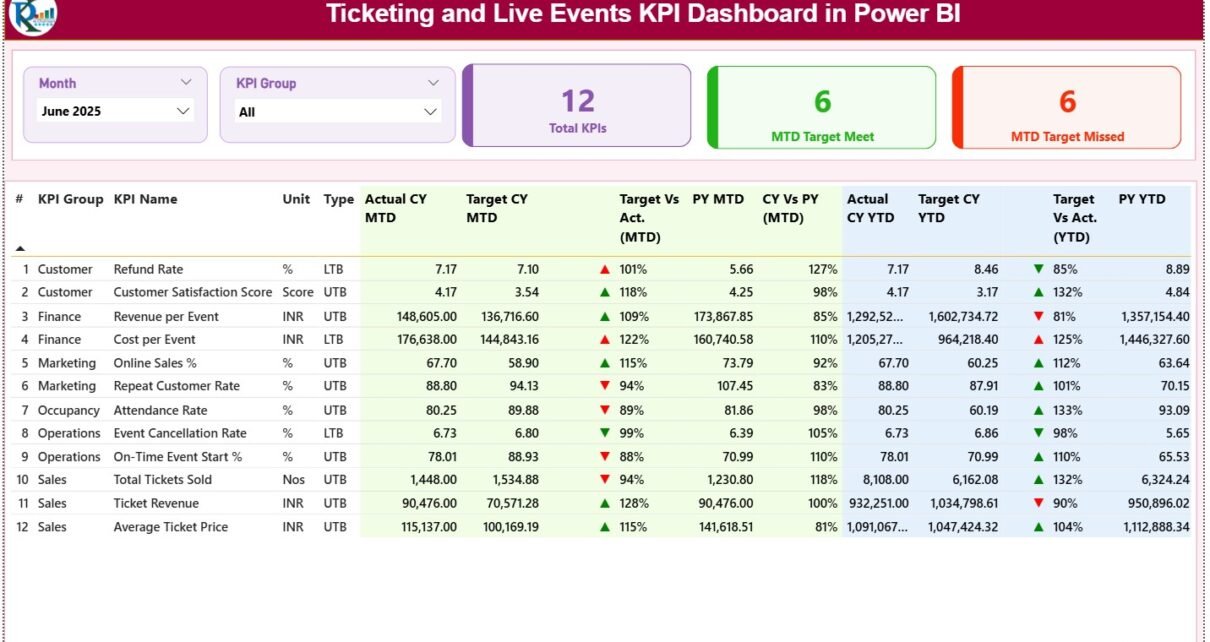
PKComments Off on Ticketing and Live Events KPI Dashboard in Power BI
The ticketing and live events industry runs on timing, accuracy, and fast decisions. Concerts, sports events, exhibitions, and festivals generate huge volumes of data every month. Ticket sales, attendance, revenue,
PKComments Off on Ticketing and Live Events KPI Dashboard in Excel
The ticketing and live events industry moves fast. Every concert, sports event, exhibition, or festival generates massive data around ticket sales, attendance, revenue, refunds, and customer engagement. Therefore, event organizers,