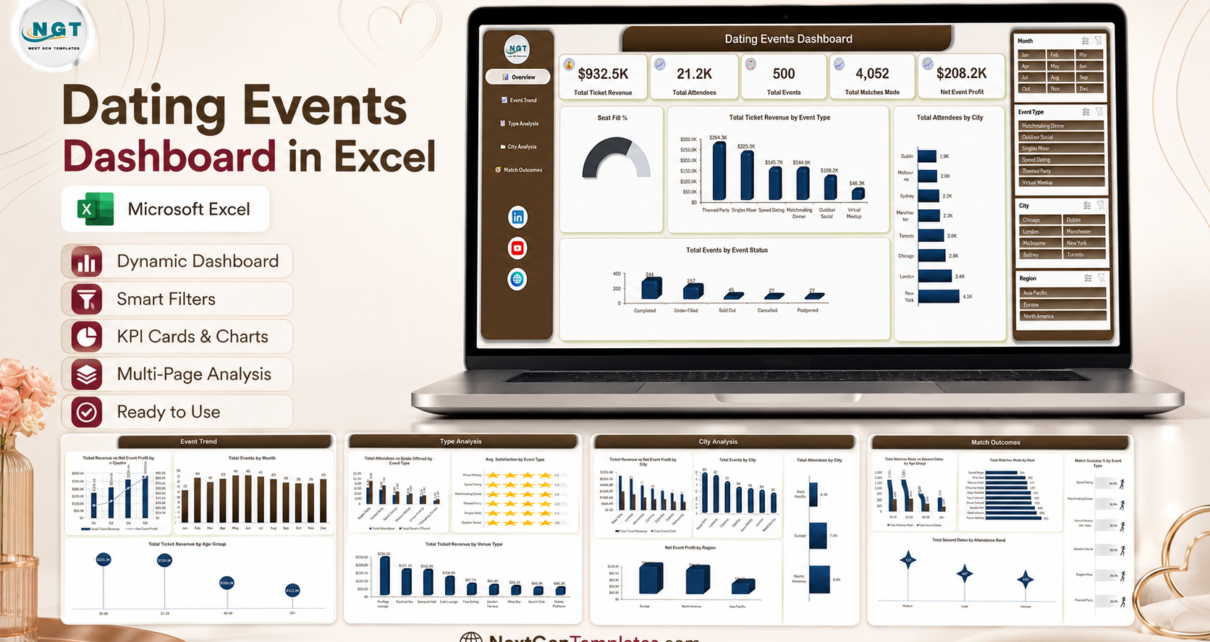
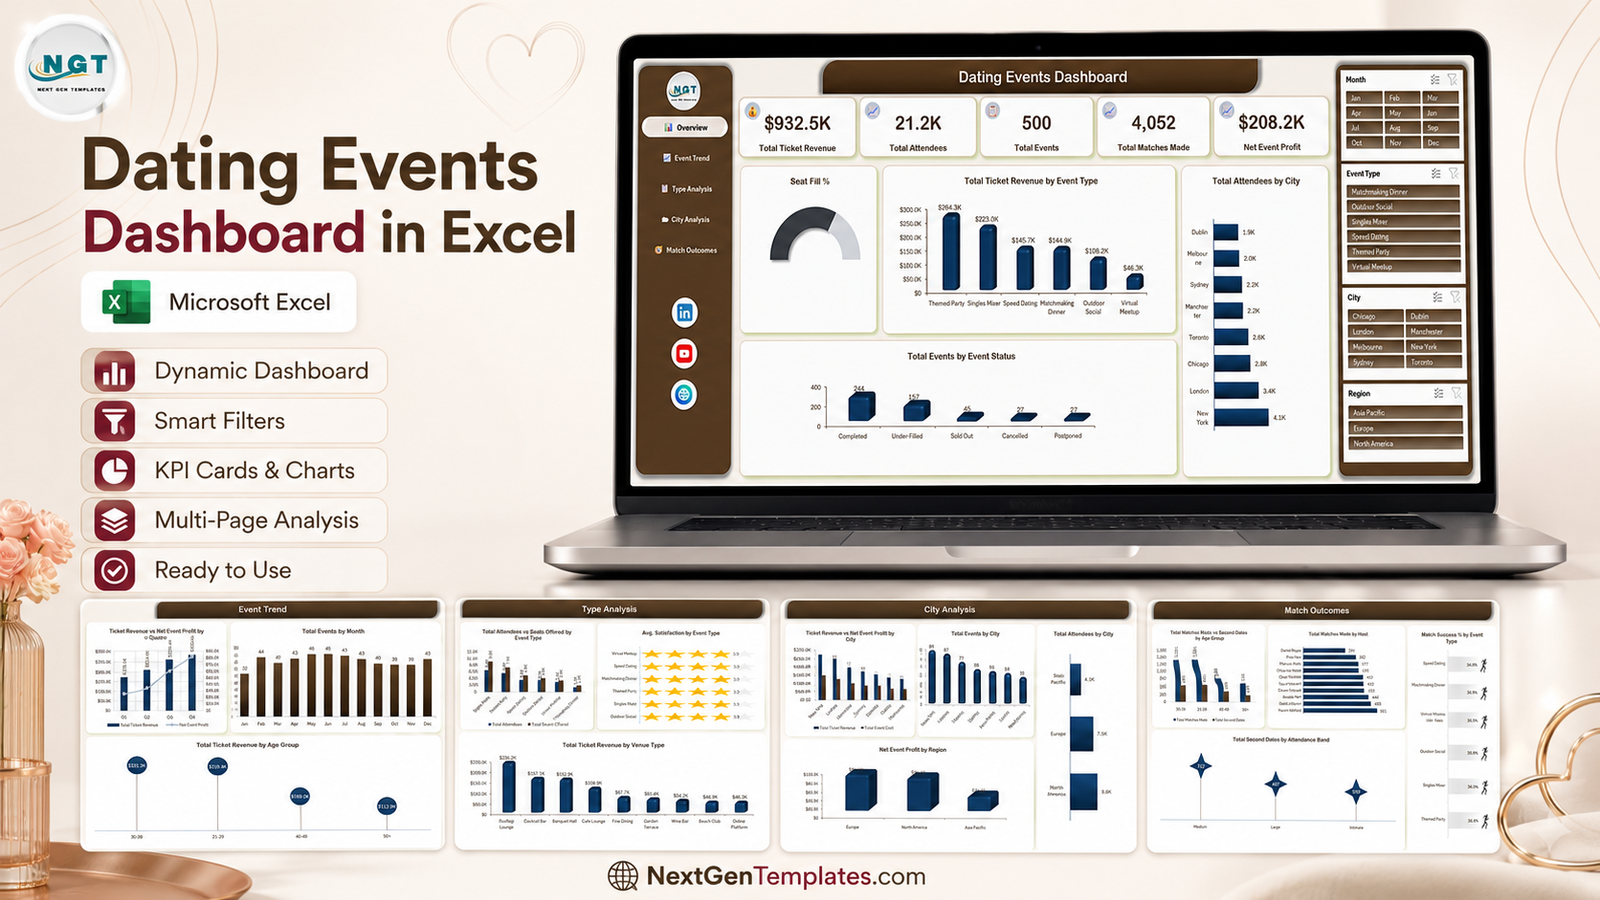
Running dating events as a business is an operations problem long before it is a romance one. A speed dating night has a room cost, a seat count, a no-show rate and a margin, and most organisers find out which of those went wrong only when the bank balance tells them. The Dating Events Dashboard in Excel is a five-page reporting workbook built for exactly that gap. It ships with 500 sample event records covering 1 January to 28 December 2025, 30 columns of event data, 26 pivot tables, 20 charts and 4 slicers that filter every page together. On the sample year it reports $932,486 of ticket revenue, 21,192 attendees across 32,592 seats offered – a 65.0% seat fill – and $208,165 of net event profit. Paste in your own event log and every one of those numbers becomes yours.
Key Features of the Dating Events Dashboard in Excel
- Five KPI cards on the Overview page: Total Ticket Revenue, Total Attendees, Total Events, Total Matches Made and Net Event Profit.
- A Seat Fill % gauge that turns the gap between seats offered and seats used into one number.
- Six event formats modelled out of the box – Speed Dating, Singles Mixer, Themed Party, Matchmaking Dinner, Outdoor Social and Virtual Meetup.
- Nine venue types, from Rooftop Lounge and Cocktail Bar to Online Platform, ranked by ticket revenue.
- Eight cities in three regions – Europe, North America and Asia Pacific – with revenue set against event cost.
- A whole page for match outcomes: matches made, second dates confirmed, success rate by format and second dates by room size.
- Cost columns as first-class data. Event Cost and Marketing Spend sit next to Ticket Revenue, so profit is calculated, not guessed.
- Four synced slicers – Month, Event Type, City, Region – present on all five pages.
- An Excel table called TblData as the single source, so new rows extend the pivot range automatically.
- No macros. A plain .xlsx that opens with no security banner in Excel 2016 and later, Microsoft 365, on Windows and Mac.
Dashboard Pages Explanation
Overview
Five KPI cards run across the top. Below them, a Seat Fill % gauge sits beside Total Ticket Revenue by Event Type, which on the sample data ranks Themed Party at $264.3K, Singles Mixer at $223.0K, Speed Dating at $145.7K, Matchmaking Dinner at $144.9K, Outdoor Social at $108.2K and Virtual Meetup at $46.3K. Total Attendees by City runs down the right, and Total Events by Event Status sits underneath – 244 Completed, 157 Under-Filled, 45 Sold Out, 27 Cancelled and 27 Postponed. That status split is the honest health check: more than three in ten sample events did not fill the room.
Event Trend
Ticket Revenue vs Net Event Profit by Quarter puts revenue bars against a profit line, and the sample year climbs on both – $178.1K of revenue and $27.1K of profit in Q1 against $283.2K and $82.6K in Q4, so margin improves faster than turnover. Total Events by Month shows the calendar shape, Attendees vs Seats Offered by Month exposes the fill gap month by month, and Total Ticket Revenue by Age Group ranks 30-39 at $331.3K, 21-29 at $319.4K, 40-49 at $169.0K and 50+ at $112.9K.
Type Analysis
This is the format comparison page. Total Attendees vs Seats Offered by Event Type shows where the empty chairs are, Avg. Satisfaction by Event Type renders as a star rating, and Seat Fill % by Event Type ranks the formats from Speed Dating at 60.5% up to Matchmaking Dinner at 69.5%. Total Ticket Revenue by Venue Type sits below, with Rooftop Lounge at $236.2K well clear of Cocktail Bar at $157.1K and Banquet Hall at $152.9K.
City Analysis
Total Ticket Revenue vs Event Cost by City is the page’s argument: two bars per city, so an expensive market is obvious. Total Events by City counts the calendar – New York 94, London 87, Chicago 71, Toronto 58, Sydney 56, Manchester 54, Dublin 41, Melbourne 39. Total Attendees by Region and Net Event Profit by Region roll the same picture up to Europe, North America and Asia Pacific.
Match Outcomes
Total Matches Made vs Second Dates by Age Group pairs the two counts per band. Total Matches Made by Host ranks the ten hosts in the sample data, which is the closest thing the workbook has to a performance review. Match Success % by Event Type spreads the formats from 34.6% to 36.4%, and Total Second Dates by Attendance Band reports Medium rooms at 712, Large at 407 and Intimate at 330. Every one of these figures is something you type in after the event – the workbook counts, it does not predict.
Dating Events Dashboard in Excel vs. Google Sheets vs. Paid Event SaaS – Feature Comparison
| This Excel dashboard | A Google Sheets build | Eventbrite Pro / Meetup Pro tier | |
|---|---|---|---|
| Cost | One payment, kept permanently | Free tool, your build time | Monthly fee plus a per-ticket cut |
| Platform | Excel 2016+, Microsoft 365, Windows and Mac | Browser | Browser and mobile app |
| Setup time | Paste your event log, Refresh All | Days of chart building | Account setup, then live data only |
| Real-time team collaboration | Via OneDrive or SharePoint co-authoring | Yes, natively | Yes |
| Mobile access | Excel mobile, viewing rather than editing | Yes | Yes |
| Customisable fields | All 30 columns are yours | Yes | Fixed schema |
| Share with a link | Via cloud storage | Yes | Yes |
| Year-1 cost at 5 users | One-off template price | Your build hours | Recurring, and it scales with volume |
| Match and second-date reporting | Built in, on a dedicated page | You would build it yourself | Not offered – ticketing stops at attendance |
| Works on historic data with no account | Yes | No | No |
Who Should Use This Template
Speed dating organisers running a circuit across several cities, matchmaking businesses selling paid dinners, singles-events companies juggling a venue mix, and social clubs that charge admission. It also suits anyone already keeping an event log in a spreadsheet who wants that log read back as a report rather than re-typed into slides.
It is worth being just as clear about who should skip it. This is not a ticketing engine – it sells nothing and takes no payment. It is not a CRM or an attendee database. It ships with no attendee names, emails or phone numbers; every row is event-level totals plus a fictional host name. It does not sync with Eventbrite, Meetup or a booking system, so data arrives by paste or CSV export. And it holds no matchmaking logic whatsoever. If you later add personal data of your own to the Data sheet, meeting GDPR, UK GDPR, CCPA or your local equivalent is on you, not on the workbook.
Real-World Use Cases
A four-city speed dating circuit. The organiser notices Speed Dating filling 60.5% of seats while Matchmaking Dinner reaches 69.5%. Rather than discount, she books smaller rooms for the speed nights and watches Net Event Profit respond on the Overview page.
A themed-party operator renegotiating venues. Total Ticket Revenue by Venue Type ranks his nine venue types, and the City Analysis page shows revenue directly against cost per city. Two contracts get renegotiated before the next season is booked.
A matchmaking business reporting to investors. The Match Outcomes page delivers matches by host, second dates by room size and success rate by format in a single screenshot – the quarterly slide their ticketing platform could never produce.
Advantages of the Dating Events Dashboard in Excel
- It reports margin, not vanity. Cost and marketing spend are in the model, so a sold-out night that lost money still looks like a night that lost money.
- Format, venue, city and age band in one file. Four different questions about the same 500 rows, answered without rebuilding anything.
- Slicers keep the pages honest. Filter to one city and all five pages move together, so numbers on different tabs cannot disagree.
- No dependencies. No add-in, no macro, no account, no connection to a third-party service that can change its API.
- It runs on last year’s data. Live tools show you live events; this file happily reports a season that finished eight months ago.
Opportunities for Improvement
Two limitations are worth knowing before you buy. First, there is no auto-refresh. The workbook is pivot-driven and refreshOnLoad is not set, so after pasting new rows you must press Ctrl+Alt+F5 or the charts will keep showing the old figures. Second, the Data and Support sheets ship visible, and the Data sheet has no dropdown validation – nothing stops a typo such as “Speed dating” creating a seventh event type in the pivots. If you are handing the file to a team, add data validation to the Event Type, City, Venue Type and Event Status columns first. It is also worth remembering that Month, Year and Quarter are stored columns rather than formulas, so they need to be filled to match each Date.
Best Practices
- Keep one row per event and never merge cells inside the table – pivots read the table, not the layout.
- Fill the five status counter columns with 1 and 0 as you go; the Event Status chart depends on them.
- Refresh All after every paste, and again before you screenshot anything for a partner or an investor.
- Add data validation lists to the categorical columns so your event types and cities stay spellable. Microsoft’s data validation guide covers this in a few minutes.
- Save a dated copy at each quarter close – the workbook reports the rows in the table, it does not keep history.
- Record Matches Made and Second Dates Confirmed within a week of each event, while follow-ups are still fresh, or the Match Outcomes page slowly stops meaning anything.
Explore Relevant Templates
The same five-page structure exists for neighbouring venue businesses: the Nightclubs Dashboard in Excel for door and bar revenue, the Music Festivals Dashboard in Excel for multi-day ticketed events, the Private Clubs Dashboard in Excel for membership-led venues and the Micro Breweries Pubs Dashboard in Excel for taproom events. If the venue side of the business is what needs organising, look at the Banquet Hall Tracker in Google Sheets or the Concert & Ticketing Management System Web App. Power BI users can compare with the Concert Promoters Dashboard in Power BI.
Frequently Asked Questions
Does this dashboard make matches or score compatibility?
No. There is no matching algorithm in the file. Matches Made and Second Dates Confirmed are counts you enter after an event, and the Match Outcomes page only aggregates what you entered.
Does it store attendee personal data?
Not as shipped. Every row is one event with totals – seats offered, registrations, attendees, revenue, cost – plus an event name, city and host name. There is no attendee name, email or phone column anywhere. Add one and that data is yours to handle lawfully.
Do I need macros, an add-in or Power Query?
None of them. It is a plain .xlsx built on an Excel table, pivot tables, slicers and standard charts.
Which Excel versions work?
Excel 2016 and later plus Microsoft 365, on Windows and Mac. Slicers need the desktop app; Excel for the web renders the pages but slicer behaviour is limited.
What happens past 500 events?
The source is an Excel table, so pasting below the last row extends the range. Refresh All and the pivots pick up the new rows – there is no row ceiling built into the design.
Can I rename the event types, cities and venues?
Yes. They are values in the data, not hard-coded lists, so a corporate-networking business or a hobby-club organiser can reuse the same file by typing their own categories and editing the chart titles.
Is the sample data real?
No. The 500 rows are realistic fictional records for a 2025 calendar year, included so you can see every chart working before your own numbers replace them.
About the Author
Built by PK – Microsoft Certified Professional with 15+ years of Excel, Google Sheets, and Power BI experience. Founder of NextGenTemplates, reaching 300K+ subscribers across YouTube channels. Every template is hand-built and tested before release.
Conclusion
Dating events live or die on seat fill and room cost, and both are knowable the week after the night rather than the quarter after. The Dating Events Dashboard in Excel takes an event log you are probably already keeping and returns revenue, cost, profit, fill rate, satisfaction and match outcomes across five pages that all filter together. It will not sell your tickets and it will not find anyone a partner – but it will tell you which format, which venue and which city are actually worth booking again.
Get the Dating Events Dashboard in Excel for an instant download, or browse the full Excel Dashboard collection. For step-by-step Excel dashboard tutorials, subscribe to youtube.com/@PKAnExcelExpert.