Concert promoters work with fast-moving numbers: ticket sales, sponsorship, gross revenue, net profit, expenses, artist demand, marketing spend, city performance, event status, genre trends, and regional sell-through. When these numbers are stored across spreadsheets or exported reports, a simple question can take too long to answer: Which genre is profitable? Which region sells through faster? Which event type deserves more marketing budget?
The Concert Promoters Dashboard in Power BI is built to turn those event records into a visual reporting system. It includes 5 Power BI pages, 5 high-level KPI cards, multiple slicers, and focused charts for revenue, event performance, marketing, sponsorship, and artist insights. It is designed for concert promoters, live event agencies, venue analysts, festival teams, and entertainment finance teams that want a ready-to-edit .pbix dashboard.
Click here to get the Concert Promoters Dashboard in Power BI
Key Features of Concert Promoters Dashboard in Power BI
- 5-page Power BI report for concert promoter analytics.
- Overview, Revenue Analysis, Event Performance, Marketing and Sponsorship, and Artist Insights pages.
- KPI cards for Total Tickets Sold, Total Sponsorship, Total Net Profit, Total Gross Revenue, and Total Expenses.
- Multiple slicers for quick filtering and focused dashboard review.
- Revenue analysis by city, event type, month, genre, and profit margin.
- Event performance analysis by event type, status, expenses, and marketing spend.
- Marketing views by region and month for campaign planning.
- Artist and audience insights by sell-through rate, genre, revenue, tickets sold, and region.
- Editable .pbix file for Power BI Desktop.
- One-time download model for teams that do not want a separate reporting subscription.
Dashboard Pages Explanation
This dashboard is arranged into five report pages. Each page focuses on a different decision area, while slicers help users filter the data and see the dashboard update quickly.
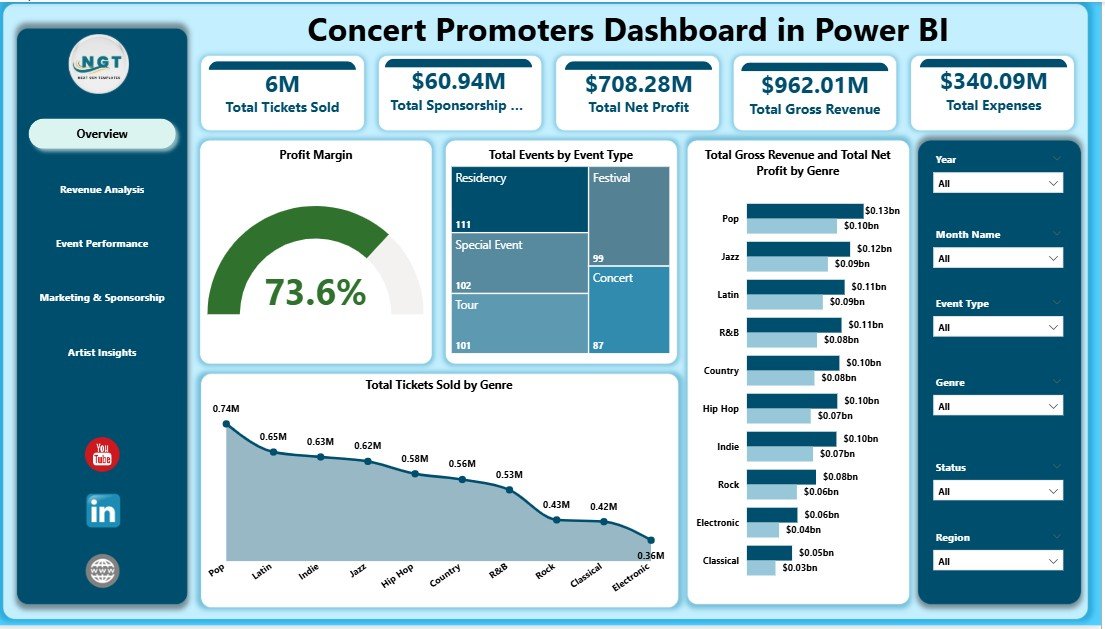
1. Overview Page
The Overview Page is the main executive summary. At the top, KPI cards show Total Tickets Sold, Total Sponsorship, Total Net Profit, Total Gross Revenue, and Total Expenses. These cards give promoters an instant view of commercial performance before they move into page-level detail.
Profit Margin by Overall Performance shows whether high-performing events are also delivering strong margin. A promoter can use this view to avoid being misled by large revenue numbers that still carry high costs.
Total Events by Event Type explains the event mix. It helps teams understand whether the portfolio is weighted toward concerts, festivals, tours, showcases, private events, or other event formats.
Total Gross Revenue and Total Net Profit by Genre compares the top-line and bottom-line contribution of each music genre. This is useful when deciding which genres deserve more investment in future booking plans.
Total Tickets Sold by Genre shows audience demand by genre. When combined with profit and revenue charts, it helps separate popular events from truly profitable ones.
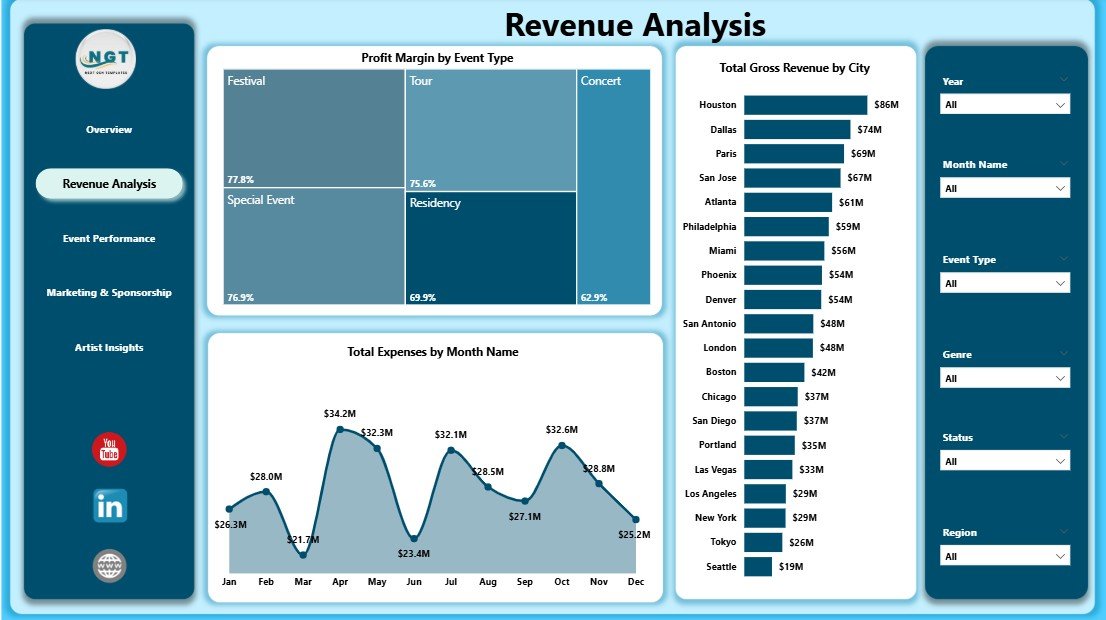
2. Revenue Analysis
The Revenue Analysis page focuses on financial performance. Profit Margin by Event Type helps identify which event formats produce stronger returns after expenses.
Total Gross Revenue by City compares city-level earning power. This chart is helpful when choosing future tour stops, negotiating venues, or reviewing market performance.
Total Expenses by Month Name shows the timing of cost pressure. Promoters can use this view to understand seasonal campaigns, production-heavy months, or periods where marketing and logistics spending increased.
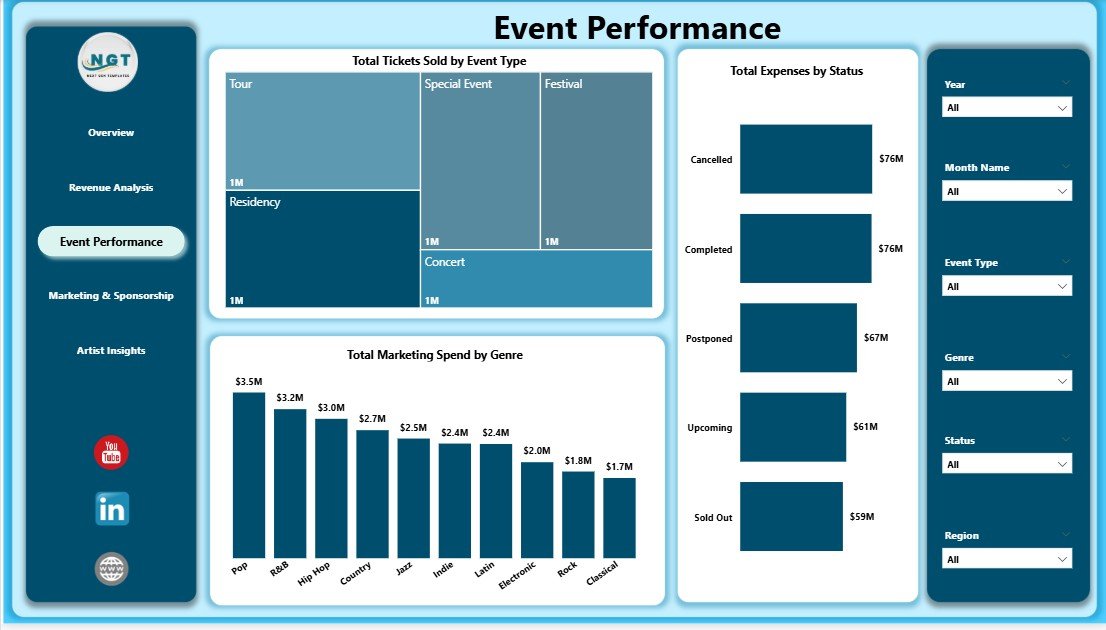
3. Event Performance
The Event Performance page looks at operating results. Total Tickets Sold by Event Type shows which formats are attracting the strongest audience response.
Total Expenses by Status compares costs by event status. This helps teams review whether completed, scheduled, delayed, or cancelled events are creating unusual expense patterns.
Total Marketing Spend by Genre explains how promotional budget is being distributed across music categories. When this is compared with tickets and profit, teams can see whether spend is supporting the right genres.
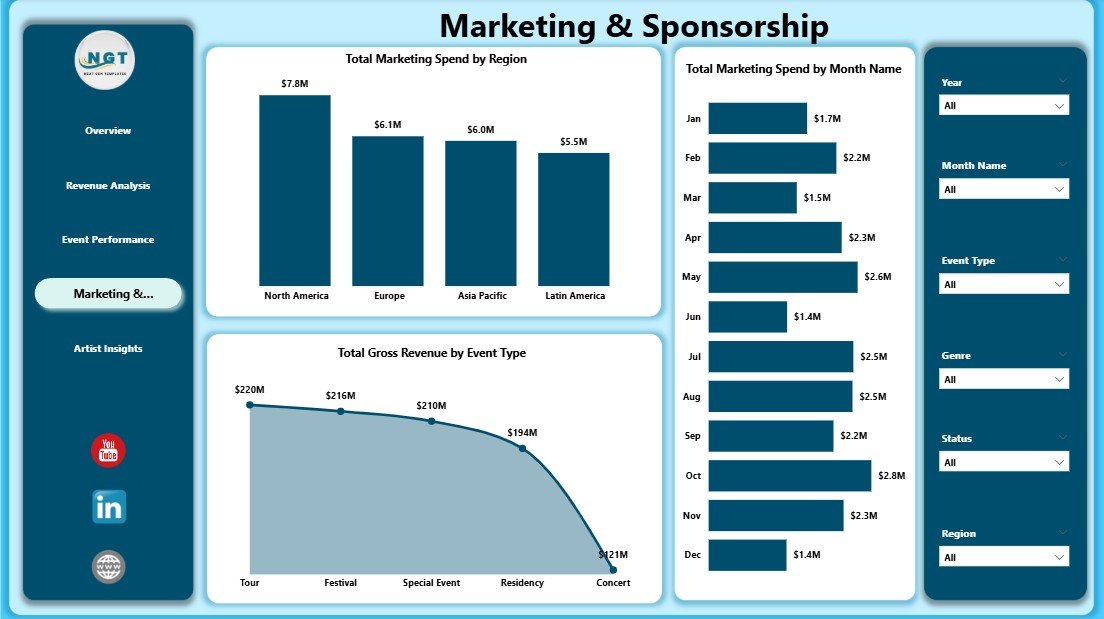
4. Marketing and Sponsorship
The Marketing and Sponsorship page connects campaign spend with commercial outcomes. Total Marketing Spend by Region highlights where promotional budget is concentrated.
Total Marketing Spend by Month Name shows the timing of promotional activity. This is useful when evaluating pre-sale pushes, tour launches, festival announcements, or seasonal ad campaigns.
Total Gross Revenue by Event Type compares revenue contribution across event formats. Sponsorship managers and promotion teams can use this chart to support sponsor packages and event format decisions.
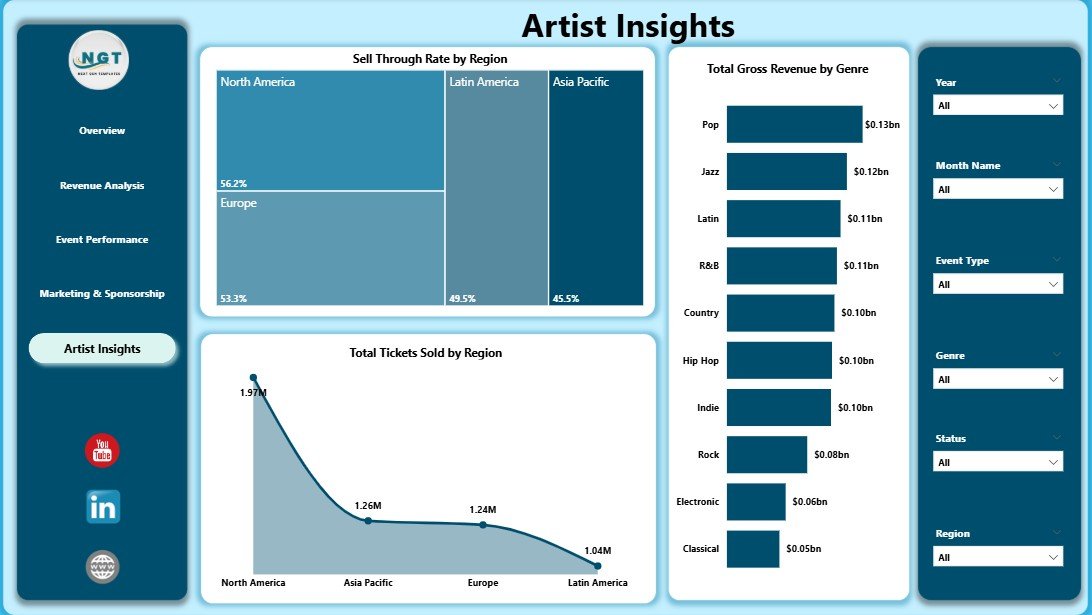
5. Artist Insights
The Artist Insights page helps with booking and lineup planning. Sell Through Rate by Region shows where available ticket inventory is converting most effectively.
Total Gross Revenue by Genre helps identify music categories with the strongest financial contribution. This can guide artist negotiations, festival curation, and promotional planning.
Total Tickets Sold by Region reveals audience demand by geography. It is especially useful when deciding where to repeat an event, expand a tour, or increase local marketing.
Concert Promoters Dashboard in Power BI vs. Tableau vs. Paid Event SaaS – Feature Comparison
| Feature | Concert Promoters Dashboard in Power BI | Tableau or Qlik Alternative | Paid Event SaaS |
|---|---|---|---|
| Cost | One-time $17.99 sale price | BI license plus build effort | Monthly or annual subscription |
| Platform | Power BI Desktop | Tableau or Qlik | Vendor cloud platform |
| Setup time | Open the .pbix and replace sample data | Requires report design and data modeling | Requires onboarding and configuration |
| Mobile access | Available after publishing to Power BI Service | Available with cloud/server setup | Usually included |
| Real-time collaboration | Available through Power BI Service | Available through paid plans | Usually included |
| Customizable fields | Editable model, visuals, pages, and fields | Editable with BI skills | Limited by plan and permissions |
| Share with link | Available when published with the right license | Available in cloud/server plans | Usually available |
| Year-1 cost at 5 users | $17.99 plus existing Power BI licensing | Often hundreds or thousands before build time | Can reach thousands per year |
| Best use case | Fast analytics for concert and live event records | Teams already standardized on another BI stack | Teams needing ticketing, CRM, settlements, scanning, and automation |
Who Should Use This Template
- Concert promoters reviewing revenue, expenses, tickets, sponsorship, and profitability.
- Venue managers comparing event type performance and regional audience demand.
- Festival planners tracking genre performance and marketing spend.
- Artist managers reviewing revenue and ticket demand before planning future shows.
- Entertainment finance analysts preparing monthly or post-event reporting.
- Marketing teams measuring spend by region, month, event type, and genre.
Real-World Use Cases
Independent concert promoter: A promoter updates the Power BI data source after each show and reviews net profit, tickets sold, and marketing spend before choosing the next city.
Venue analyst: A venue team uses the Event Performance page to compare tickets sold by event type and see where expenses differ by status.
Artist manager: An artist manager reviews regional sell-through rate and gross revenue by genre before recommending where to schedule the next tour segment.
Advantages of Concert Promoters Dashboard in Power BI
- It gives promoters a focused dashboard for concert and live event metrics.
- It saves time compared with building Power BI visuals from scratch.
- It combines finance, event, marketing, sponsorship, and artist views in one report.
- It supports quick filtering through slicers.
- It works in Power BI Desktop and can be customized.
- It provides a one-time template purchase instead of a separate reporting subscription.
Opportunities for Improvement
This template is a reporting dashboard, not a live ticketing platform. It does not scan tickets, process settlements, send sponsor invoices, or automate artist contracts. If you need those workflows, continue using your ticketing, accounting, or event management system and use this Power BI dashboard as the analytics layer.
The report also depends on clean source data. Consistent event names, genres, regions, statuses, cities, months, revenue fields, expense fields, and ticket fields will make the visuals more reliable.
Best Practices
- Keep one clean source table for event records.
- Use consistent names for genres, regions, cities, event types, and statuses.
- Refresh the dashboard after every data update.
- Review the Overview page first, then move into the detailed pages.
- Use slicers to isolate one city, genre, event type, artist, or region before making decisions.
- Keep a backup copy before making structural changes to the .pbix model.
For official guidance on installing and using Power BI Desktop, see Microsoft Learn: Get Power BI Desktop.
Explore Relevant Templates
- Concert Promoters Dashboard in Power BI
- Music Industry KPI Dashboard in Power BI
- Political Campaign Dashboard in Power BI
- Compliance Audits Dashboard in Power BI
- Browse Power BI Dashboard templates
Frequently Asked Questions
What is the Concert Promoters Dashboard in Power BI?
It is an editable .pbix dashboard template for analyzing concert promoter data, including tickets sold, sponsorship, net profit, gross revenue, expenses, marketing spend, events, genres, cities, regions, and artist insights.
How many pages are included?
The dashboard includes five report pages: Overview, Revenue Analysis, Event Performance, Marketing and Sponsorship, and Artist Insights.
Do I need Power BI Pro?
No. You can open and edit the file in Power BI Desktop. Power BI Pro is only needed if you want to publish and share the report through Power BI Service.
Can I replace the sample data?
Yes. Replace the sample data source with your own event data, then refresh the report.
Can I customize the visuals?
Yes. You can customize pages, visuals, fields, labels, measures, colors, and data connections inside Power BI Desktop.
Does it connect directly to ticketing platforms?
Direct connection depends on your ticketing platform and available Power BI connectors. You can also export your ticketing data and connect it as a file source.
Can this be used for festivals and tours?
Yes. It can be adapted for concerts, festivals, tours, venue programs, and other live entertainment reporting needs.
About the Author
Built by PK – Microsoft Certified Professional with 15+ years of Excel, Google Sheets, and Power BI experience. Founder of NextGenTemplates, reaching 300K+ subscribers across YouTube channels. Every template is hand-built and tested before release.
Conclusion
The Concert Promoters Dashboard in Power BI gives event teams a faster way to understand revenue, profit, tickets, sponsorship, expenses, marketing spend, genre performance, event type performance, city trends, artist demand, and regional sell-through. Instead of rebuilding charts manually, users can open the .pbix file, connect their data, refresh the report, and review the dashboard through interactive visuals.
Click here to download the Concert Promoters Dashboard in Power BI
For more Power BI and Excel dashboard tutorials, visit YouTube.com/@PKAnExcelExpert.
Last updated: May 19, 2026.