In this article we have created the Real Estate Investment Trusts (REITs) KPI Dashboard in Excel. This is a ready to use template for REIT analysts, real estate fund managers, portfolio teams, and finance professionals who need a monthly KPI reporting workbook without building the dashboard from scratch.
The template includes 7 worksheets, supports MTD and YTD tracking, compares Actual, Target, and Previous Year numbers, and uses conditional formatting arrows for variance analysis. Instead of maintaining separate files for KPI definitions, monthly inputs, target plans, and board reporting, this workbook keeps the full REIT KPI workflow in one Excel file.
Click here to purchase the Real Estate Investment Trusts (REITs) KPI Dashboard in Excel
Home Page
Key Features of Real Estate Investment Trusts (REITs) KPI Dashboard in Excel
Click here to purchase the Real Estate Investment Trusts (REITs) KPI Dashboard in Excel
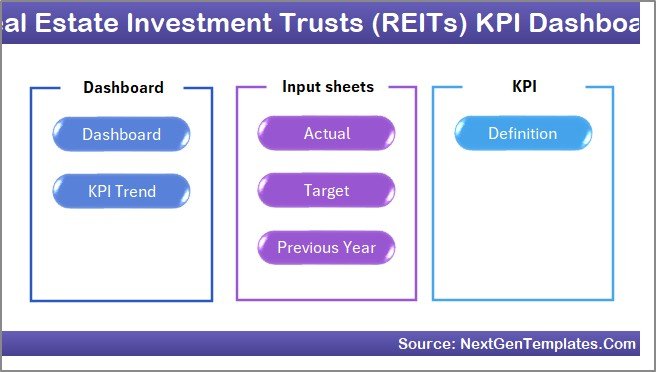
- 7 worksheet structure – Home, Dashboard, KPI Trend, Actual Numbers Input, Target Number Input, Previous Year Number Input, and KPI Definition.
- Month selector on the Dashboard sheet – select the reporting month from the dropdown in cell D3 and the dashboard changes for that month.
- MTD and YTD KPI reporting – review short-term monthly movement and year-to-date performance in the same dashboard layout.
- Actual vs Target comparison – track whether each REIT KPI is ahead or behind plan.
- Previous Year comparison – compare current performance against the same period from the prior year.
- Conditional formatting arrows – quickly identify improving and declining metrics without reading every number manually.
- KPI Trend sheet – select one KPI and review its group, unit, type, formula, definition, and trend charts.
- Editable KPI Definition sheet – document each KPI with formula logic and mark it as LTB or UTB.
Dashboard Pages Explanation
Click here to purchase the Real Estate Investment Trusts (REITs) KPI Dashboard in Excel
1. Home Sheet
The Home sheet is the index page of the workbook. It includes six navigation buttons that let users jump to the respective sheet instantly. This is useful when the workbook is shared with senior leaders, analysts, or clients who do not want to search through worksheet tabs.
Home Page
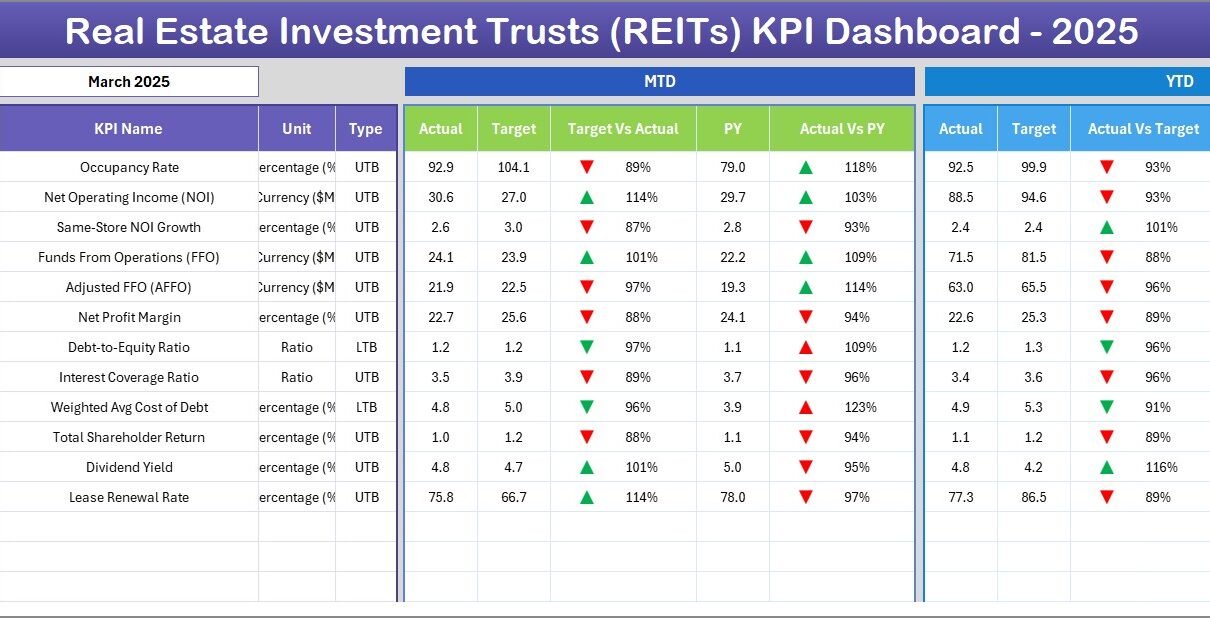
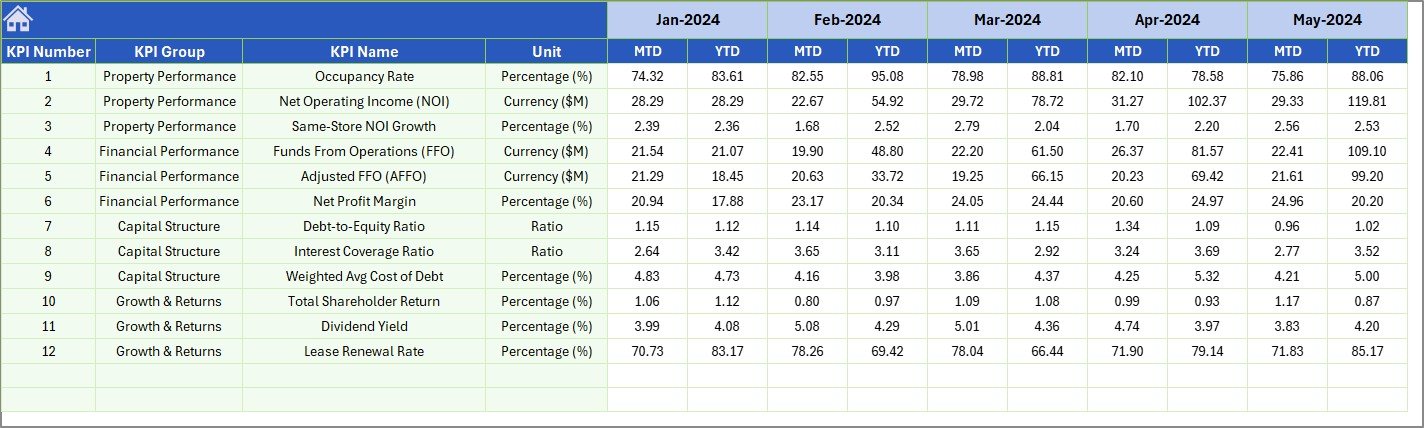
2. Dashboard Sheet Tab
This is the main sheet tab. Here, you can see all information about all KPIs in one view. On range D3, you can select the month from the dropdown. The whole dashboard numbers will change for that selected month.
The Dashboard sheet shows MTD Actual, Target, and Previous Year data, along with Target vs Actual and PY vs Actual comparisons. The same reporting logic is also available for YTD Actual, Target, and Previous Year data. Conditional formatting up/down arrows make the sheet easy to review in monthly performance meetings.
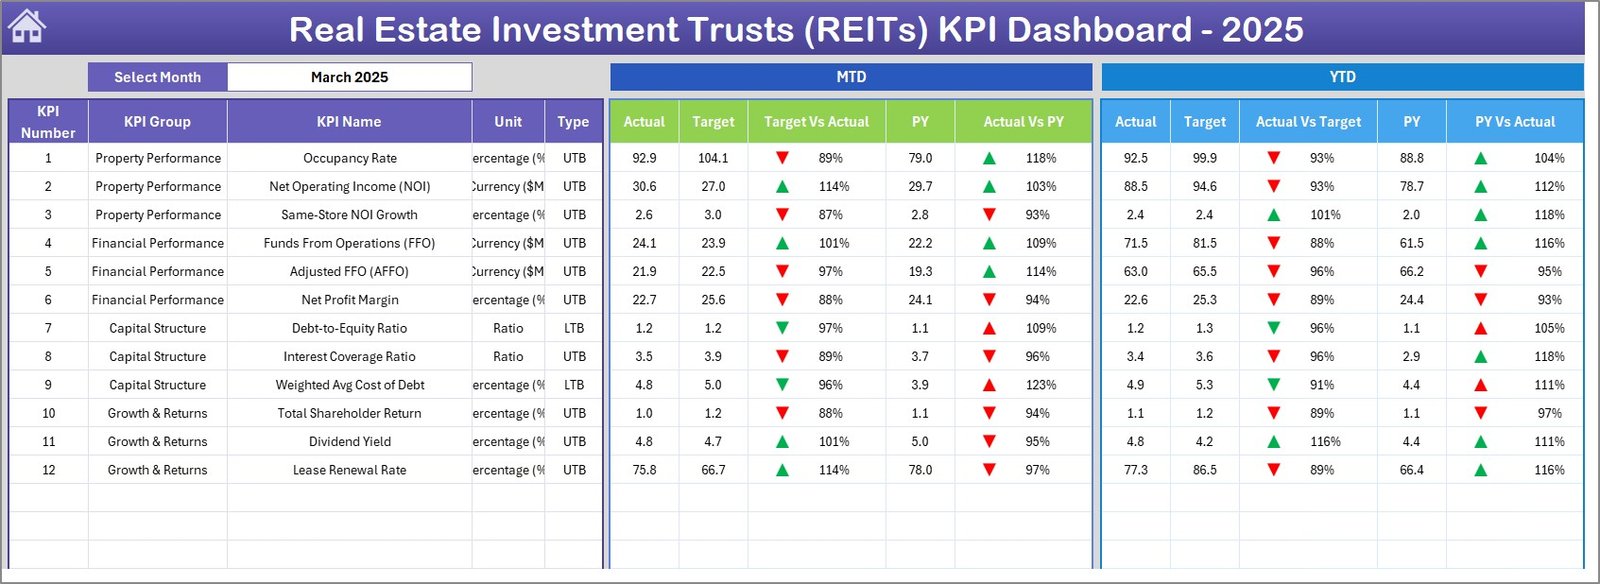
Real Estate Investment Trusts (REITs) KPI Dashboard
3. KPI Trend Sheet Tab
On the KPI Trend sheet, you can select the KPI name from the dropdown available on range C3. The sheet displays the KPI Group, Unit of KPI, Type of KPI, Formula of the KPI, and Definition of the KPI. It also shows MTD and YTD trend charts for Actual, Target, and Previous Year numbers.
This page is especially helpful when a single REIT metric needs deeper review. For example, if occupancy, NOI margin, FFO growth, leverage ratio, or distribution coverage misses target, the KPI Trend sheet lets you isolate that metric and study monthly movement.
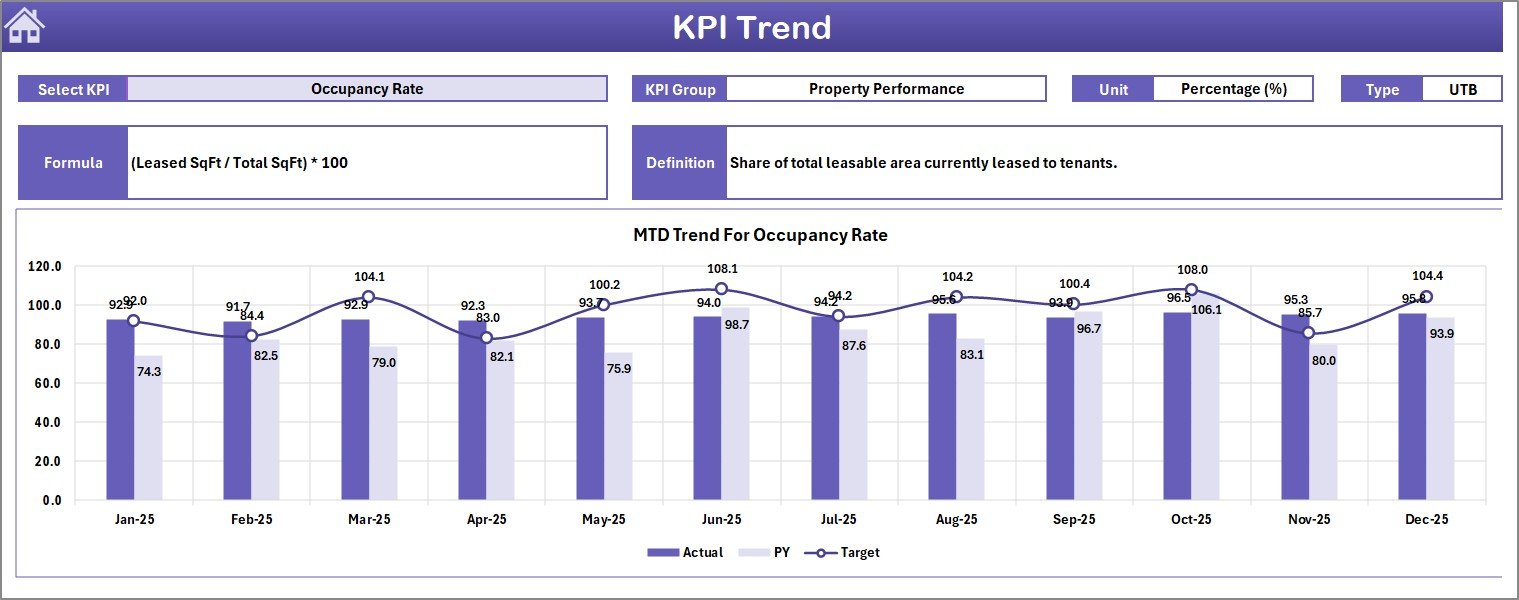
KPI Trend Sheet
4. Actual Numbers Input Sheet
In this sheet, you enter the actual MTD and YTD numbers for each KPI for a particular month. You can change the months from range E1 by entering the first month of the year. The Dashboard and KPI Trend sheets pick up values from this input sheet.
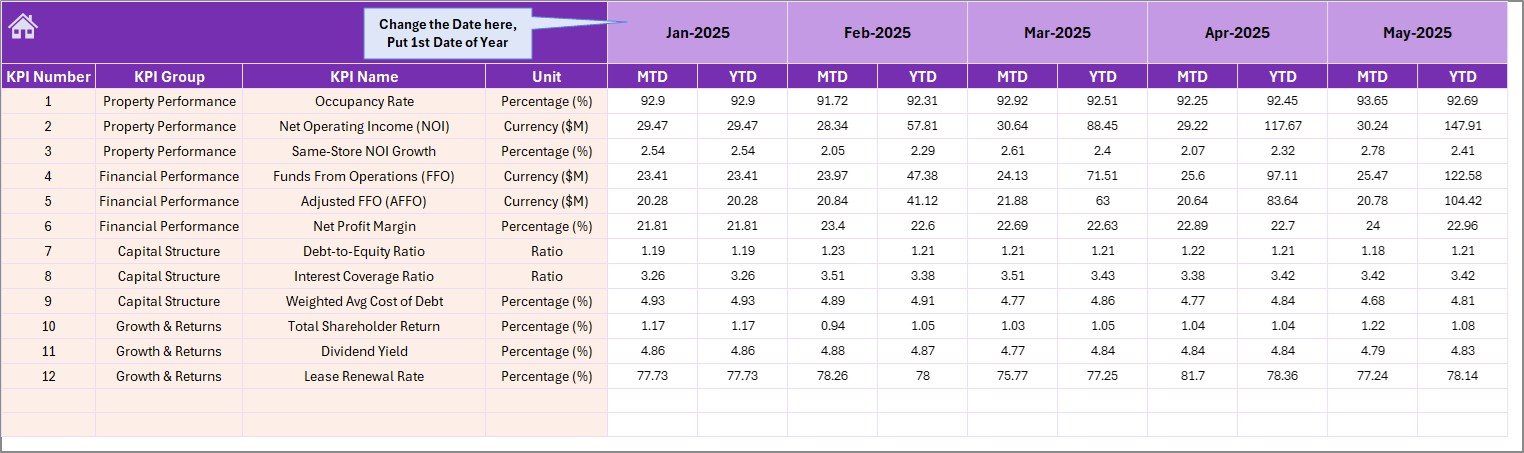
Actual Numbers Input sheet
5. Target Number Input Sheet
In this sheet tab, you enter target numbers for each KPI for each month. Both MTD and YTD target values can be maintained here. This keeps planning assumptions separate from actual results and makes the dashboard easier to audit.
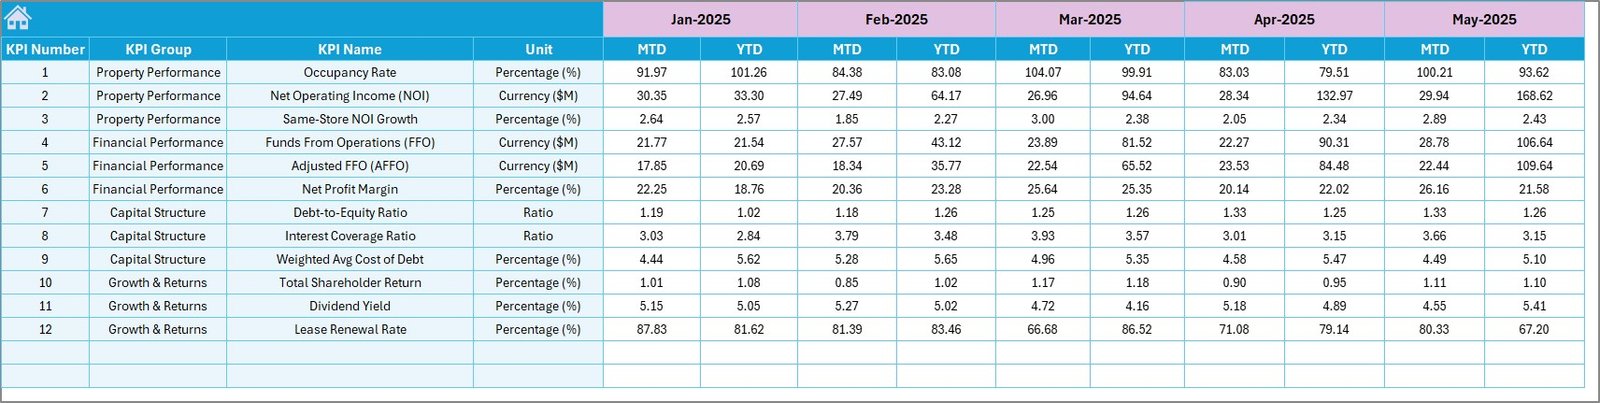
Target Number Input sheet
6. Previous Year Number Sheet Tab
Enter the previous year numbers here the same way you enter current-year data. These values are used for year-over-year comparison in the Dashboard sheet and KPI Trend sheet.
Previous Year Number Input sheet
7. KPI Definition Sheet Tab
In this sheet tab, you enter the KPI Name, KPI Group, Unit, Formula, and KPI Definition. In the last column, enter the KPI type as LTB for Lower the Better or UTB for Upper the Better. This is important because some REIT metrics improve when they increase, while others improve when they decrease.
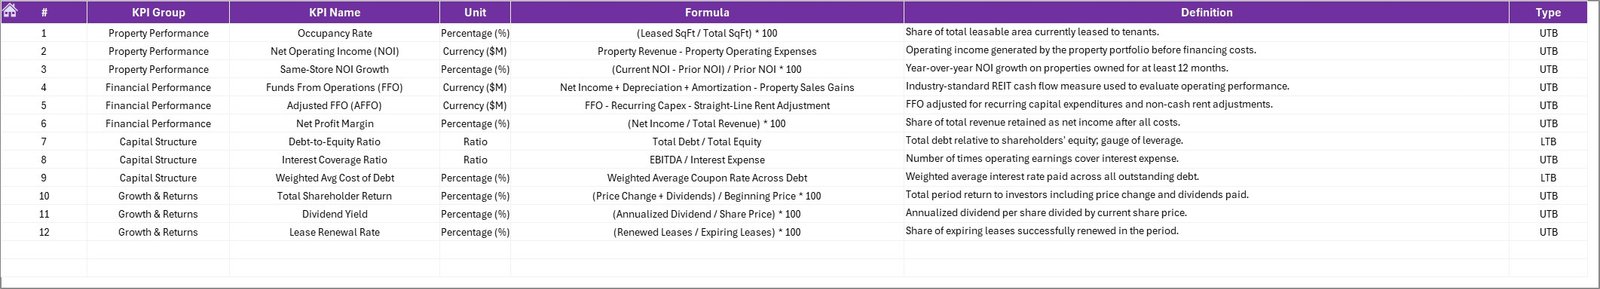
KPI Definition sheet
Real Estate Investment Trusts (REITs) KPI Dashboard in Excel vs. Google Sheets vs. Paid CRM/SaaS – Feature Comparison
| Feature | REITs KPI Dashboard in Excel | Google Sheets equivalent | Paid real estate SaaS |
|---|---|---|---|
| Cost | $14.99 one-time | Free DIY build or paid template | Subscription or quote-based pricing |
| Platform | Microsoft Excel | Browser-based Google Sheets | Cloud web platform |
| Setup time | Under 10 minutes | 30 minutes to several hours | Days or weeks |
| Offline access | Yes | Limited | No |
| MTD and YTD comparisons | Built in | Requires formulas | Usually configurable |
| KPI definition library | Included | Manual setup | Admin controlled |
| Customizable fields | Fully editable workbook | Editable sheet | Often vendor controlled |
| Share with link | Possible via OneDrive or SharePoint | Native sharing | Native sharing |
| Year-1 cost at 5 users | $14.99 total | Build time plus template cost | Often hundreds or thousands per year |
If your team already works in Excel and needs a structured KPI reporting workbook, this template fits well. If you need automatic feeds from investor portals, accounting software, or property management systems, a larger real estate SaaS platform may be more appropriate.
Who Should Use This Template
- REIT analysts who prepare monthly KPI packs for management review.
- Real estate fund managers who need a clear target-versus-actual reporting structure.
- Finance teams tracking occupancy, NOI, FFO, distribution, leverage, and other REIT metrics.
- Consultants creating repeatable reporting systems for real estate investment clients.
- Small investment teams that want a practical Excel template before moving to a larger BI stack.
Real-World Use Cases
Click here to purchase the Real Estate Investment Trusts (REITs) KPI Dashboard in Excel
Monthly REIT Performance Review
A portfolio analyst uses the Dashboard sheet to compare MTD and YTD performance against targets before the monthly investment committee meeting. The variance arrows make it easy to identify which KPIs need discussion.
Board Reporting Pack
A real estate finance manager exports the Dashboard sheet as a PDF and adds it to the board pack. The Previous Year comparison helps leadership see whether performance is improving against the same period last year.
Client Reporting for Consultants
A consultant updates the KPI Definition sheet for each REIT client, then uses the same workbook structure to deliver standardized reporting across multiple clients.
Advantages of Real Estate Investment Trusts (REITs) KPI Dashboard in Excel
- Fast setup – replace sample data and start reporting in minutes.
- Clear structure – Actual, Target, Previous Year, and KPI definitions are stored separately.
- Better monthly review discipline – the same dashboard can be updated every month.
- Flexible KPI design – you can adapt the workbook to REIT-specific, fund-specific, or property-specific metrics.
- No subscription – buy once and use the workbook as often as needed.
Opportunities for Improvement
Click here to purchase the Real Estate Investment Trusts (REITs) KPI Dashboard in Excel
This template is designed as a practical Excel KPI reporting system. It does not include live API feeds, automated database refresh, role-based web access, or investor portal functionality. Teams that need those features can still use this workbook as a reporting prototype before investing in a larger BI or SaaS implementation.
Another possible improvement is to connect the workbook to Power Query. Microsoft provides documentation for importing and transforming Excel data through Power Query, which can help teams automate data preparation when source files are consistent.
Best Practices
- Update Actual Numbers, Target Numbers, and Previous Year Numbers on a fixed monthly schedule.
- Keep KPI names consistent across all input sheets and the KPI Definition sheet.
- Use clear formulas in the KPI Definition sheet so every stakeholder understands how metrics are calculated.
- Classify each KPI correctly as LTB or UTB before using variance arrows in management reporting.
- Save a backup copy before changing worksheet structure or adding new KPI fields.
- Use the KPI Trend sheet before making decisions based only on one month of dashboard movement.
Explore Relevant Templates
If you work with real estate analytics, these related templates may also help:
- Real Estate Investment Trusts (REITs) Dashboard in Excel – broader REIT portfolio analysis dashboard.
- Real Estate Valuation KPI Dashboard in Excel – valuation-focused KPI reporting for real estate assets.
- Rental Property Investment Dashboard in Excel – rental income, occupancy, NOI, and ROI analysis.
- Office Space Leasing KPI Dashboard in Excel – leasing, occupancy, and tenant retention KPI reporting.
You can also browse more Excel KPI Dashboard Templates on NextGenTemplates.
Frequently Asked Questions
What is the Real Estate Investment Trusts (REITs) KPI Dashboard in Excel?
It is a ready-to-use Excel KPI dashboard template for tracking REIT performance using MTD and YTD Actual, Target, and Previous Year values.
How many worksheets are included?
The workbook includes 7 worksheets: Home, Dashboard, KPI Trend, Actual Numbers Input, Target Number Input, Previous Year Number Input, and KPI Definition.
Can I customize the KPIs?
Yes. You can update KPI names, groups, units, formulas, definitions, and KPI type in the KPI Definition sheet.
Does the dashboard compare current performance with previous year?
Yes. The dashboard includes PY vs Actual comparisons for MTD and YTD numbers.
Do I need advanced Excel skills?
No. The workbook is designed for normal Excel users. You only need to update input sheets and select the reporting month.
Can I use this for non-REIT real estate portfolios?
Yes. Because the KPI names and formulas are editable, the template can also be adapted for real estate funds, property portfolios, and asset management teams.
Is this template a one-time purchase?
Yes. It is available as a one-time purchase on NextGenTemplates with no recurring subscription.
About the Author
Built by PK – Microsoft Certified Professional with 15+ years of Excel, Google Sheets, and Power BI experience. Founder of NextGenTemplates, reaching 300K+ subscribers across YouTube channels. Every template is hand-built and tested before release.
Conclusion
The Real Estate Investment Trusts (REITs) KPI Dashboard in Excel is a practical reporting tool for teams that need clear monthly REIT performance tracking. With 7 worksheets, MTD and YTD reporting, target comparisons, previous-year comparisons, KPI definitions, and trend charts, it gives analysts a structured way to monitor performance without rebuilding dashboards every month.
Click here to purchase the Real Estate Investment Trusts (REITs) KPI Dashboard in Excel
Visit our YouTube channel for step-by-step Excel tutorials: Youtube.com/@PK-AnExcelExpert
Last updated: May 18, 2026