In this article we have created Scientific Research KPI Scorecard in Excel. This is a ready to use Scorecard template for research teams that want to track monthly and yearly KPI performance in a structured Excel workbook. The template includes 4 worksheets, MTD and YTD analysis, actual vs target comparison, KPI trend charts, and a KPI definition sheet so every metric is documented in one place.
Scientific research projects often involve grant budgets, lab output, publication targets, experiment success rates, project milestones, ethics approvals, and stakeholder reporting. When these metrics are scattered across emails or separate files, teams lose time during monthly reviews. This Excel scorecard gives universities, laboratories, R&D departments, nonprofits, and scientific program managers one practical place to review performance.
Click here to purchase Scientific Research KPI Scorecard in Excel.
Key Features of Scientific Research KPI Scorecard in Excel
Below are the key features of this KPI Scorecard:
- 4 worksheet scorecard model for Scorecard, KPI Trend, Input Data, and KPI Definition workflows.
- Month, MTD, and YTD dropdown analysis so users can review short-term and cumulative performance.
- Actual vs Target values to compare research performance against planned goals.
- Visual indicators to quickly identify KPIs that are on target, near target, or below target.
- KPI Trend sheet with Actual, Target, and Previous Year trend charts.
- Editable Input Data sheet where users can update actual values, targets, and prior-year numbers.
- KPI Definition sheet for KPI Name, KPI Group, Unit, Formula, and Definition.
- No macro dependency, making it easier to use in managed university or lab environments.
Dashboard Pages Explanation
In this template, we have 4 worksheets. Each worksheet supports a different part of the scientific research KPI tracking process.
1. Scorecard Sheet
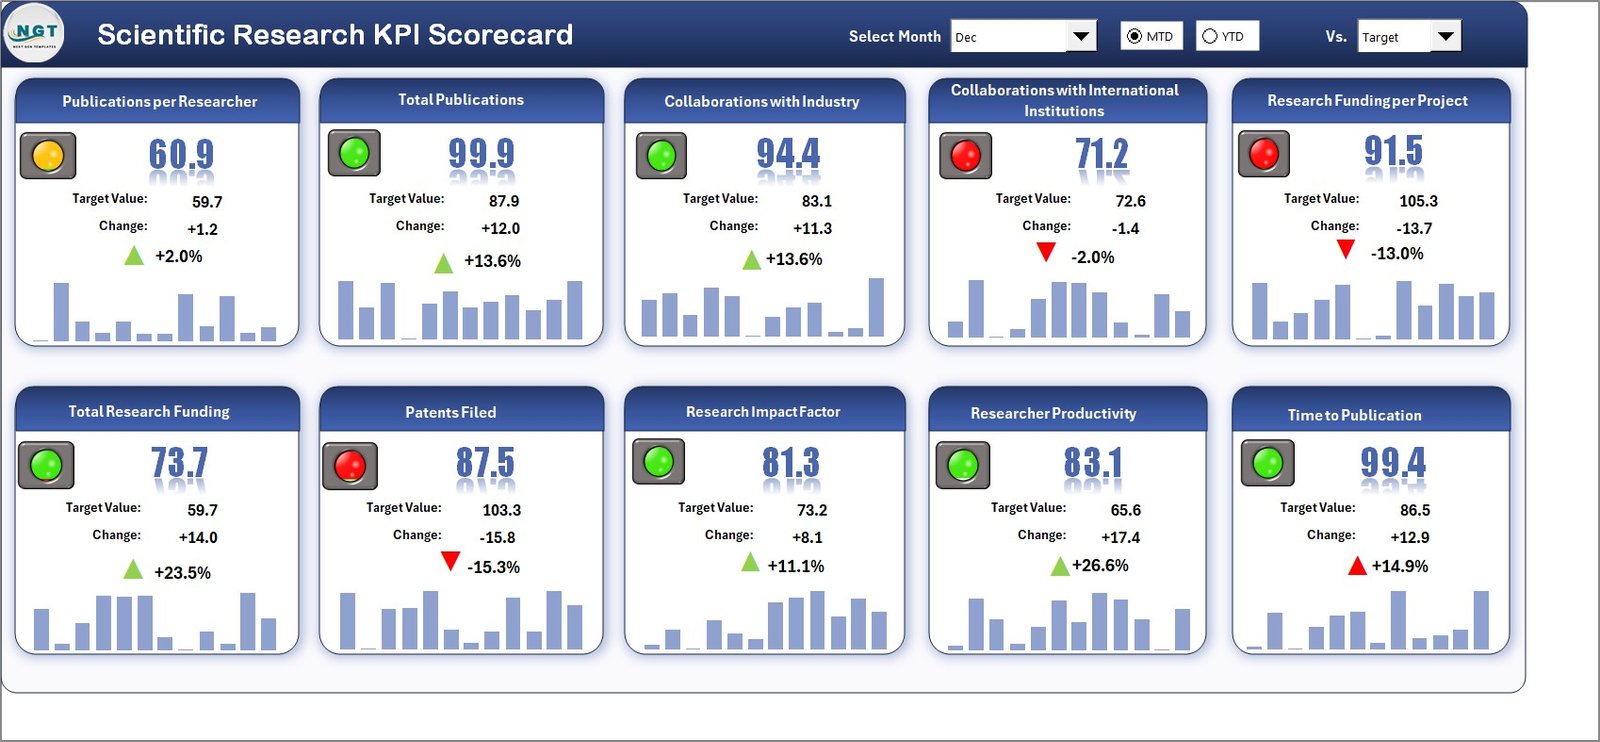
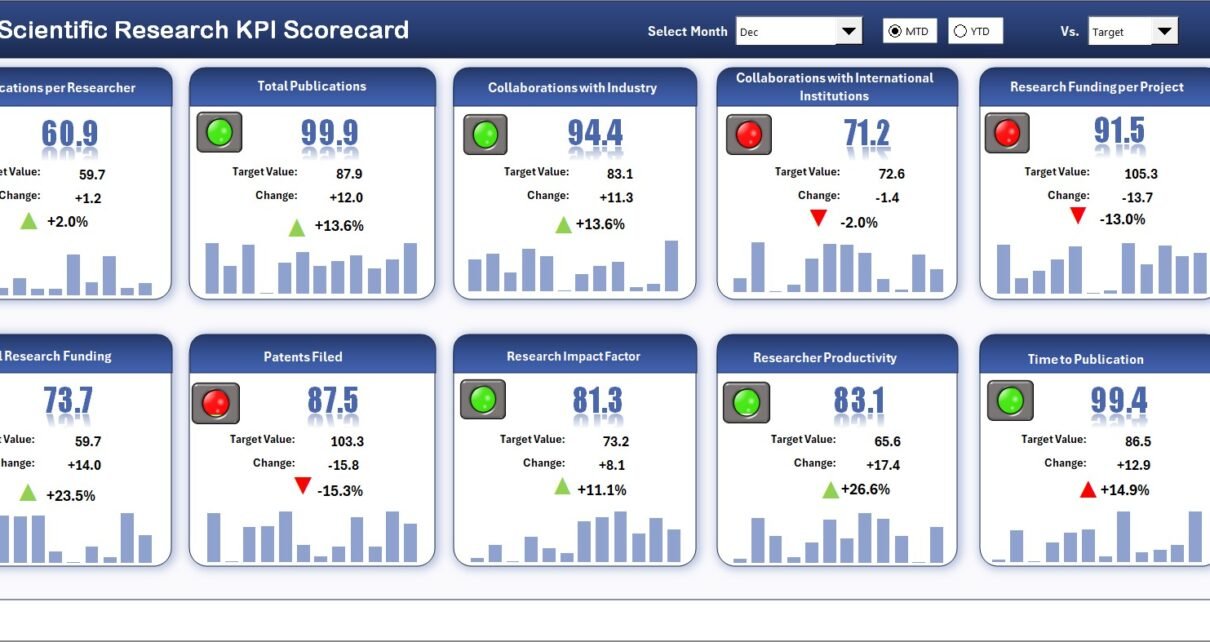
Scientific Research KPI Scorecard in Excel
The Scorecard sheet is the main interface where you can view KPI performance. It brings the research KPI list, actual values, target values, variance logic, and status indicators into one reporting view. The user can select the month, MTD, or YTD from dropdown menus and the scorecard updates for that period.
This sheet is useful for monthly research review meetings. A research director can quickly review grant utilization, publication output, experiment completion rate, project delay rate, proposal acceptance rate, patent filing count, ethics review cycle time, and lab utilization without opening multiple reports.
The actual vs target comparison helps teams move from vague progress updates to measurable decisions. If a KPI is underperforming, the visual indicator makes it visible immediately. If a KPI is improving, the team can document what changed and reuse that approach across other research programs.
2. KPI Trend Sheet Tab
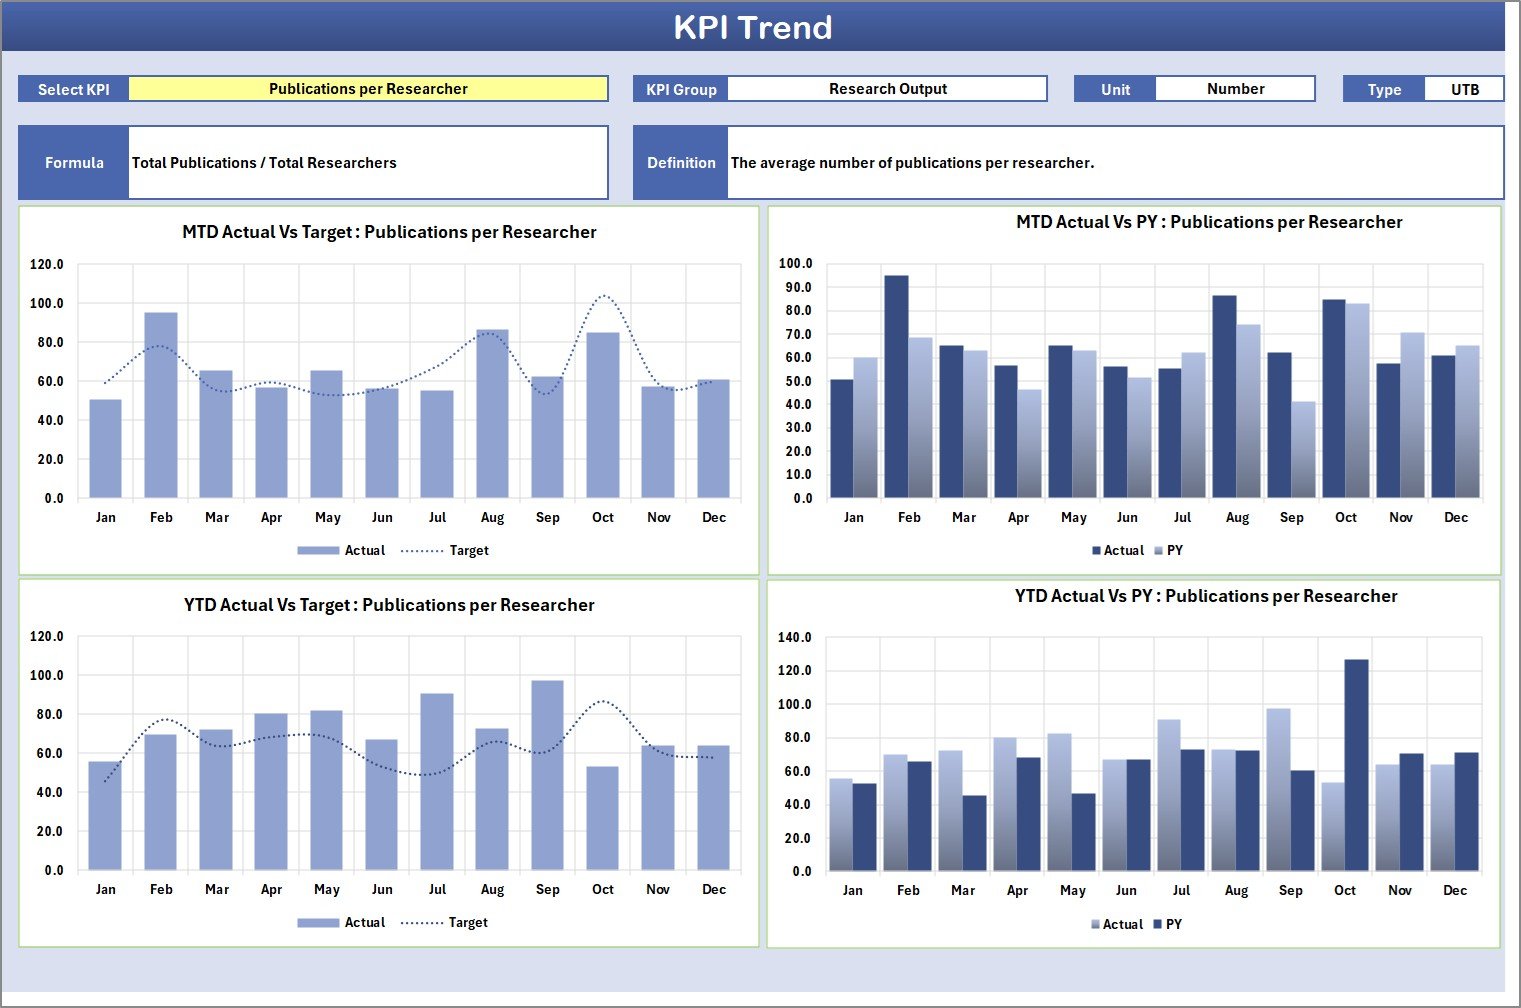
KPI Trend Sheet
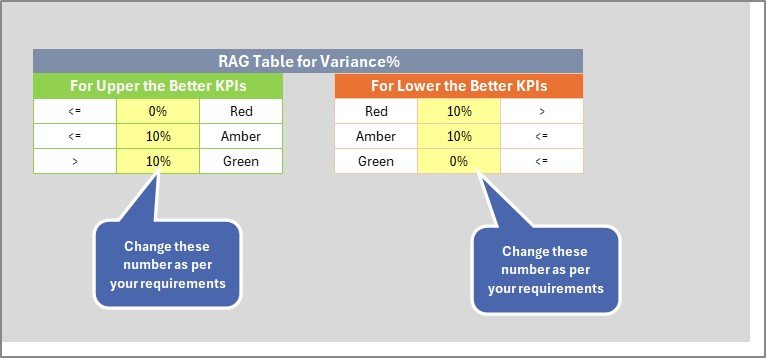
Here you can select the KPI name from the dropdown available in range C3. The sheet displays the KPI Group, Unit of KPI, Type of KPI, Formula of the KPI, and Definition of the KPI. KPI type is especially important because some research KPIs are better when higher, while others are better when lower.
For example, publication output, grant success rate, patent filing count, and experiment completion rate are usually upper-the-better KPIs. Project delay days, ethics review cycle time, budget variance, and rework percentage may be lower-the-better KPIs. Recording this logic avoids confusion when performance status is calculated.
The sheet also shows MTD and YTD trend charts for Actual, Target, and Previous Year numbers. This makes it easier to see whether a KPI is improving only for one month or improving consistently over the year. Trend analysis is valuable for leadership reviews because it shows direction, not just one static number.
3. Input Data Sheet
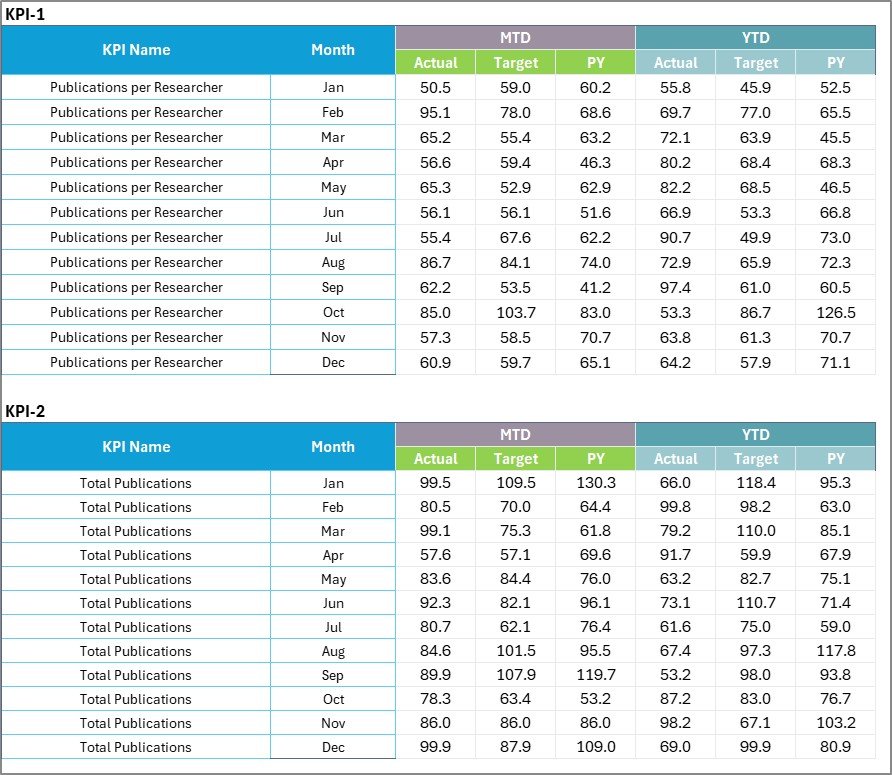
Input Data Sheet
The Input Data sheet is where you enter all KPI data. You can record actual values, targets, and previous-year numbers for each KPI and each month. When new results become available, update this sheet and the scorecard remains current.
This structure is flexible. A lab manager can update experiment completion data, a grant officer can update funding utilization, an academic department can update publication and citation indicators, and an R&D operations analyst can update project milestones. The key is to maintain the same column structure so the Scorecard and KPI Trend sheets continue to work smoothly.
Because the Input Data sheet separates data entry from reporting, users do not need to touch charts or formulas during every update. This reduces manual reporting errors and gives the team a repeatable monthly process.
4. KPI Definition Sheet Tab
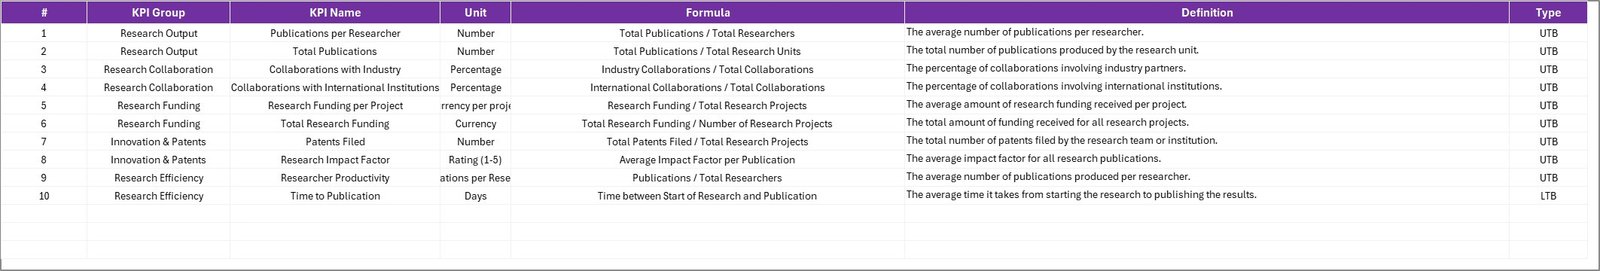
KPI Definition sheet tab
In this sheet tab, you have to enter the KPI Name, KPI Group, Unit, Formula, and KPI definition. This sheet acts as the KPI dictionary for the workbook. It is especially useful in scientific research because different stakeholders may use the same metric name in different ways.
For example, one team may define grant utilization as spending divided by approved budget, while another team may calculate it against released funding. One lab may define experiment success rate based on completed tests, while another may use validated results only. The KPI Definition sheet keeps these rules visible and consistent.
Scientific Research KPI Scorecard additional preview
Scientific Research KPI Scorecard in Excel vs. Google Sheets vs. Paid Research SaaS – Feature Comparison
| Feature | This Excel Scorecard | Google Sheets Alternative | Paid Research SaaS |
|---|---|---|---|
| Cost | $12.99 one-time | Template purchase or DIY build | Subscription or annual license |
| Platform | Microsoft Excel | Google Sheets in browser | Vendor-hosted cloud platform |
| Setup time | Under 10 minutes with sample data | Fast if your team already uses Sheets | Often requires onboarding |
| Offline access | Yes | Limited | Usually no |
| Customizable fields | Fully editable workbook | Editable spreadsheet | Depends on vendor permissions |
| MTD/YTD trends | Built in | Available if designed into the sheet | Usually available |
| Year-1 cost at 5 users | $12.99 total | Template cost only | Can be hundreds or thousands per year |
| Best fit | Excel-first research teams | Teams needing browser collaboration | Large organizations needing integrations and governance |
If your team already manages research data in Excel, this scorecard is a practical middle path. It is more organized than a blank spreadsheet but much lighter than a full research management system.
Who Should Use This Template
- University research departments tracking publication, grants, and project milestones.
- Scientific laboratories reviewing monthly experiment output and quality indicators.
- R&D divisions monitoring innovation pipeline, prototype progress, and budget usage.
- Grant administrators preparing periodic performance summaries.
- Research consultants who need a reusable KPI scorecard for client reporting.
- Nonprofit research programs measuring outcomes, deliverables, and funding efficiency.
This template is not designed for live lab instrument feeds, automated compliance workflows, or enterprise-level role-based access controls. For those needs, a dedicated research management system may be required.
Real-World Use Cases
Click here to download Scientific Research KPI Scorecard in Excel.
University Research Director
A university research director uses the Scorecard sheet to review grant utilization, publications, citation growth, and project delays every month. When one KPI falls below target, the KPI Trend sheet helps identify whether the issue is recent or part of a longer pattern.
Laboratory Operations Manager
A lab operations manager tracks experiment success rate, equipment utilization, testing backlog, rework percentage, and turnaround time. The Input Data sheet becomes the monthly source of truth, while the Scorecard sheet becomes the meeting-ready summary.
Grant Program Manager
A grant program manager uses the KPI Definition sheet to standardize formulas across multiple funded projects. This makes quarterly reporting easier because every metric has a written definition and a documented calculation method.
Advantages of Scientific Research KPI Scorecard in Excel
- Clear KPI ownership – each metric can be grouped by research area, lab, project, or department.
- Fast monthly reporting – users update the Input Data sheet instead of rebuilding reports.
- Better performance conversations – actual vs target values make reviews more specific.
- Trend visibility – MTD and YTD charts show whether changes are short-term or sustained.
- Consistent definitions – the KPI Definition sheet reduces confusion around formulas and KPI meaning.
- Low adoption barrier – Excel is already familiar to many research and administrative teams.
Opportunities for Improvement
Click here to download Scientific Research KPI Scorecard in Excel.
This scorecard is intentionally lightweight, but advanced users can expand it. You can add slicers, create more KPI groups, add a separate executive summary, build Power Query connections, or connect the workbook to SharePoint or OneDrive for team review.
You can also explore Microsoft Excel documentation for tables, formulas, charts, and collaboration options on the official Microsoft Excel support page.
Best Practices
- Define each KPI before entering monthly data.
- Use consistent units such as %, count, hours, days, or currency.
- Separate upper-the-better and lower-the-better KPIs clearly.
- Update the Input Data sheet on a fixed monthly schedule.
- Review trend charts before making decisions from a single month.
- Keep a backup copy before making structural changes to formulas or sheets.
- Use the scorecard during recurring review meetings so the workbook becomes part of the management routine.
Explore Relevant Templates
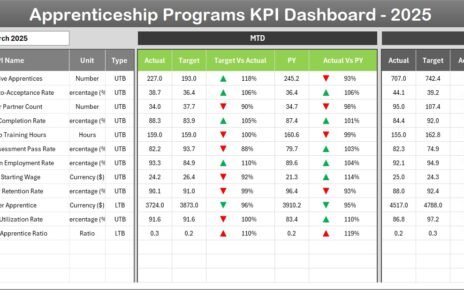
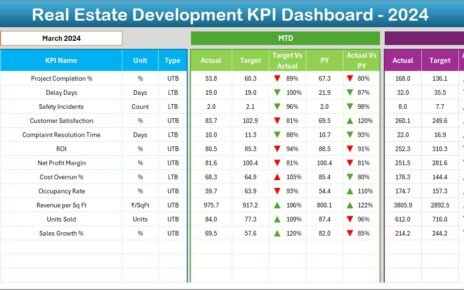
- Scientific Research KPI Dashboard in Excel – a broader dashboard option for research performance analysis.
- Scientific Research KPI Dashboard in Google Sheets – useful when browser collaboration is a priority.
- Biotechnology KPI Scorecard in Excel – useful for biotech and life sciences teams.
- Space Exploration KPI Scorecard in Excel – useful for mission, engineering, and scientific program KPIs.
Browse more Excel KPI Dashboard Templates on NextGenTemplates.
Frequently Asked Questions
What is the Scientific Research KPI Scorecard in Excel?
It is a ready-to-use Excel workbook for tracking scientific research KPIs with scorecard views, KPI trend charts, input data, and KPI definitions.
How many worksheets are included?
The workbook includes 4 worksheets: Scorecard, KPI Trend, Input Data, and KPI Definition.
Can I customize the KPIs?
Yes. You can edit KPI names, groups, units, formulas, definitions, targets, and actual values.
Does it support MTD and YTD analysis?
Yes. The scorecard supports Month-to-Date and Year-to-Date performance review.
What research KPIs can I track?
You can track grant utilization, publication output, experiment success rate, research project delay rate, budget variance, lab utilization, ethics review cycle time, and other metrics you define.
Is this template only for universities?
No. It can be used by universities, research institutes, labs, scientific nonprofits, corporate R&D teams, and grant-funded programs.
About the Author
Built by PK – Microsoft Certified Professional with 15+ years of Excel, Google Sheets, and Power BI experience. Founder of NextGenTemplates, reaching 300K+ subscribers across YouTube channels. Every template is hand-built and tested before release.
Conclusion
The Scientific Research KPI Scorecard in Excel gives research teams a structured way to monitor performance without building a reporting system from scratch. With a Scorecard sheet, KPI Trend sheet, Input Data sheet, and KPI Definition sheet, the template supports both day-to-day tracking and leadership-level review.
If your team wants a simple Excel-based method to track research KPIs, compare actuals with targets, and review MTD/YTD trends, this workbook is a practical starting point.
Click here to download Scientific Research KPI Scorecard in Excel.
Visit our YouTube channel to learn step-by-step video tutorials: Youtube.com/@PKAnExcelExpert
Last updated: May 2026