The Landscaping Dashboard in Excel is a ready-to-use Excel analytics template that tracks 5 headline KPIs across 5 interactive pages — built for landscaping business owners, lawn care operations managers, and crew supervisors who need crew-level and regional visibility without paying $39–$299 per user per month for Jobber, LMN, or Aspire. Setup takes under 10 minutes. Paste your job records into the Data Sheet, click Data → Refresh All, and every pivot-driven card and chart rebuilds automatically.
🌍 Join 8,400+ teams in 40+ countries using NextGenTemplates across Excel, Google Sheets, Power BI, and HTML to replace paid SaaS tools with one-time-purchase templates.

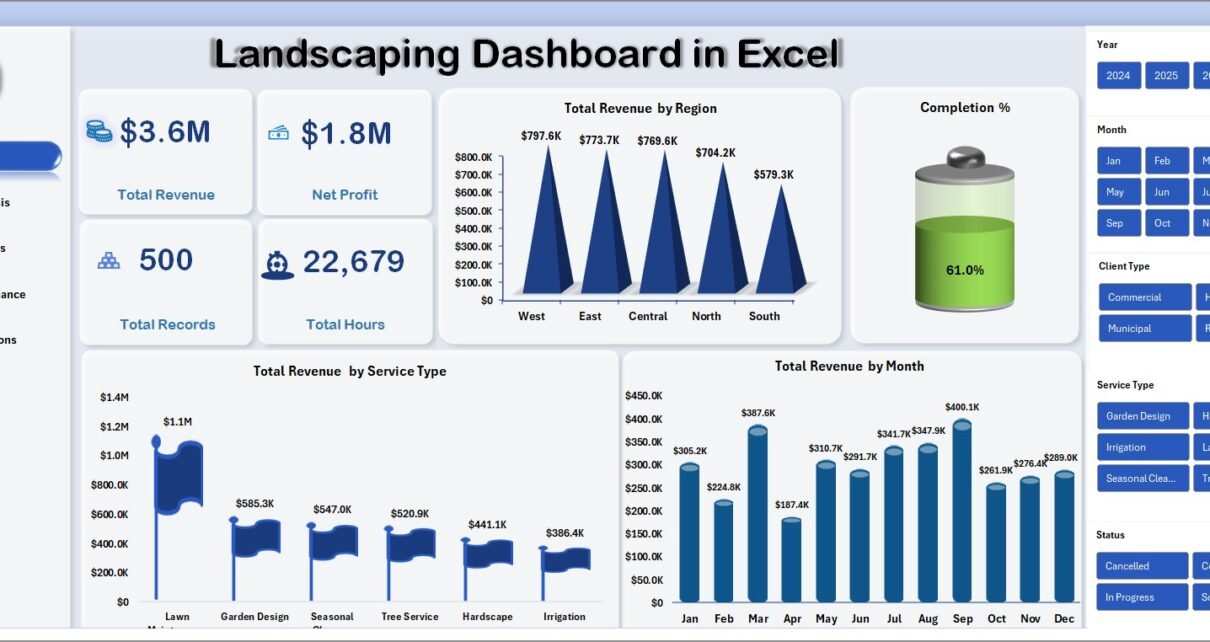
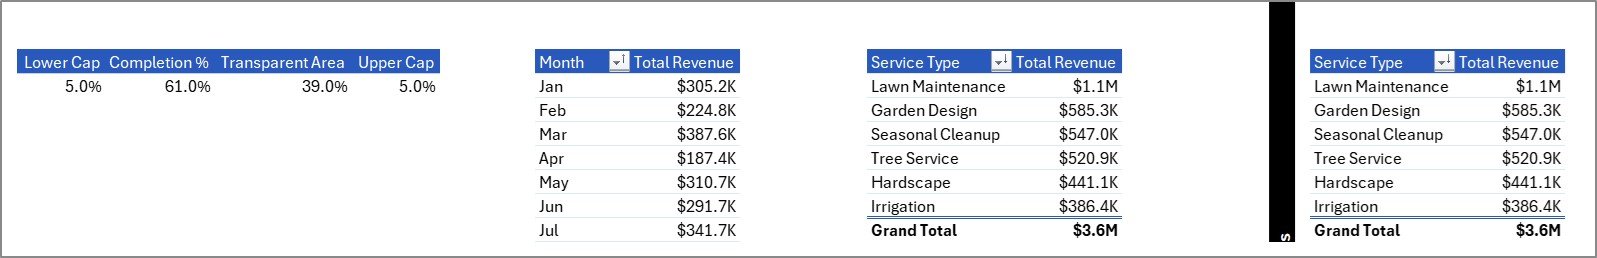
Landscaping Dashboard in Excel — Overview page
Introduction to the Landscaping Dashboard in Excel
Running a modern landscaping business isn’t just mowing lawns — it’s tracking revenue by service line, hours per crew, area serviced per job, margin by client type, and completion % across multiple regions. Most landscaping operators stitch this together in three or four separate spreadsheets every month, losing hours in manual aggregation before they can brief ownership or spot an underperforming crew.
The Landscaping Dashboard in Excel replaces that manual stitching with one file. It uses native Excel pivot tables, slicers, and charts — no macros, no add-ins, no monthly subscriptions — to deliver the same decision-quality views that enterprise landscaping firms pay thousands of dollars per month for. According to IBISWorld’s Landscaping Services industry report, the US landscaping services industry is a $150B+ market with tens of thousands of mid-size operators — and the ones who can show crew-level margin, service mix, and regional profitability in one view are the ones scaling fastest.
Key Features of Landscaping Dashboard in Excel
🌱 5 headline KPI cards on the Overview page — Total Revenue, Net Profit, Total Records, Total Hours, and Completion %. Every card is wired to a pivot measure, so the numbers recalculate the instant you refresh the workbook.
📊 14 pivot-driven charts across 5 analysis pages — Overview, Service Analysis, Client Insights, Regional Performance, and Crew & Operations. Every chart is anchored to a hidden Support Sheet pivot.
🧭 Multiple slicers for interactive filtering — drill from company-wide numbers to a single region, service type, client type, or crew leader in two clicks. Works on desktop Excel, Excel for Mac, and Excel on the web.
🗂️ Structured Data Sheet with ready-to-fill columns — job ID, service type, hours, area serviced, revenue, cost, profit, client type, region, crew leader, satisfaction score, and completion %. Keep the column order and the whole dashboard updates with one click.
🧮 Hidden Support Sheet — every pivot that powers the dashboard lives here. Hide it in production and your stakeholders see only the polished pages.
Dashboard Pages Explanation
The Landscaping Dashboard in Excel is organized across 5 interactive pages plus a Data Sheet and a hidden Support Sheet. Each analysis page tells a different story about your landscaping business.
1. Overview Page
The Overview page is the ownership view. At the top, 5 cards show Total Revenue, Net Profit, Total Records, Total Hours, and Completion %. Below the cards, three trend charts show Total Revenue by Region, Total Revenue by Service Type, and Total Revenue by Month — covering the “where is it coming from, what are we selling, and how are we trending?” questions in one scroll.
Landscaping Dashboard in Excel
2. Service Analysis
The Service Analysis page compares how different landscaping services — lawn care, landscape design, hardscaping, irrigation, and snow removal — stack up. It includes Total Revenue by Service Type, Total Hours by Service Type, Total Area Serviced by Service Type, and Avg Revenue Per Project by Service Type. Use this page to decide which service line to push next quarter.
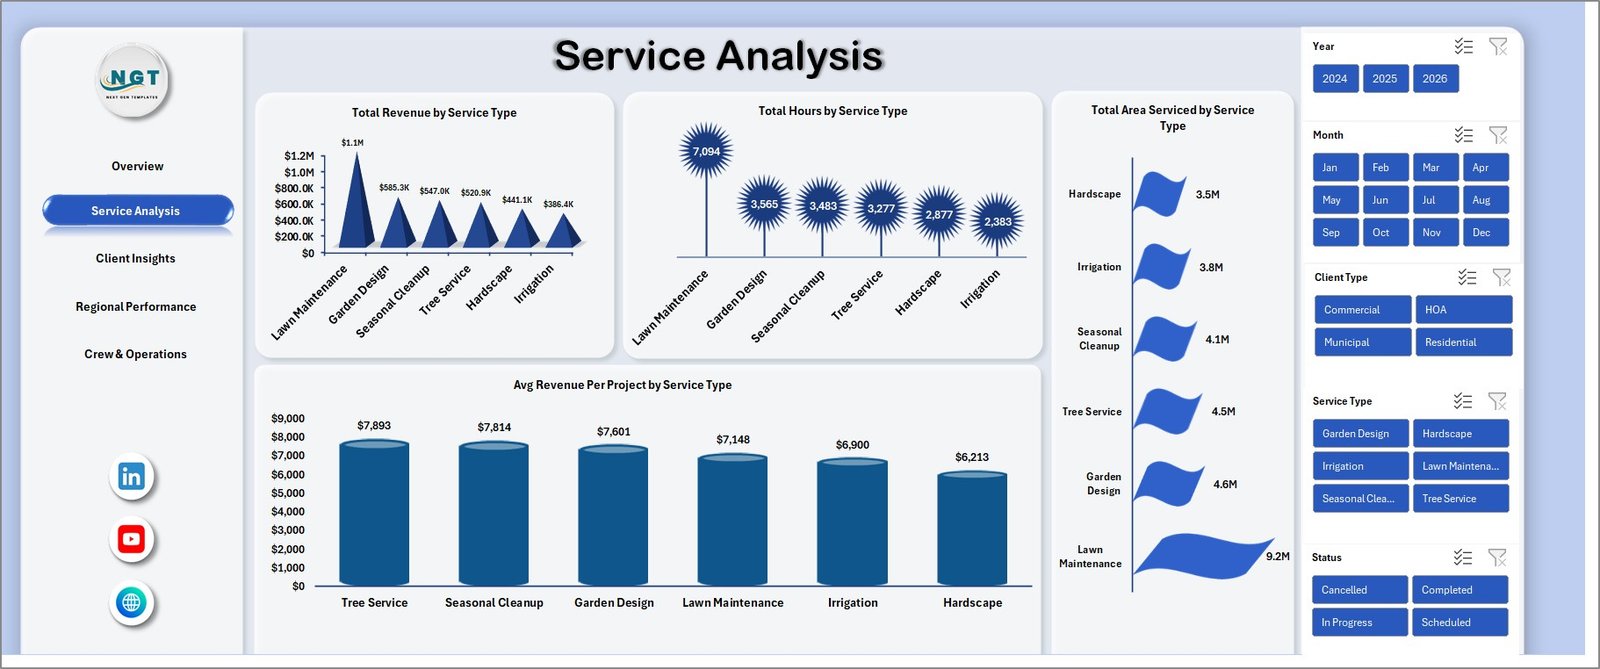
Service Analysis
3. Client Insights
The Client Insights page splits your business across residential, commercial, municipal, and HOA clients with Total Revenue by Client Type, Total Records by Client Type, Total Area Serviced by Client Type, and Avg Satisfaction by Client Type. The satisfaction view is the single best leading indicator of churn you’ll get out of one file.
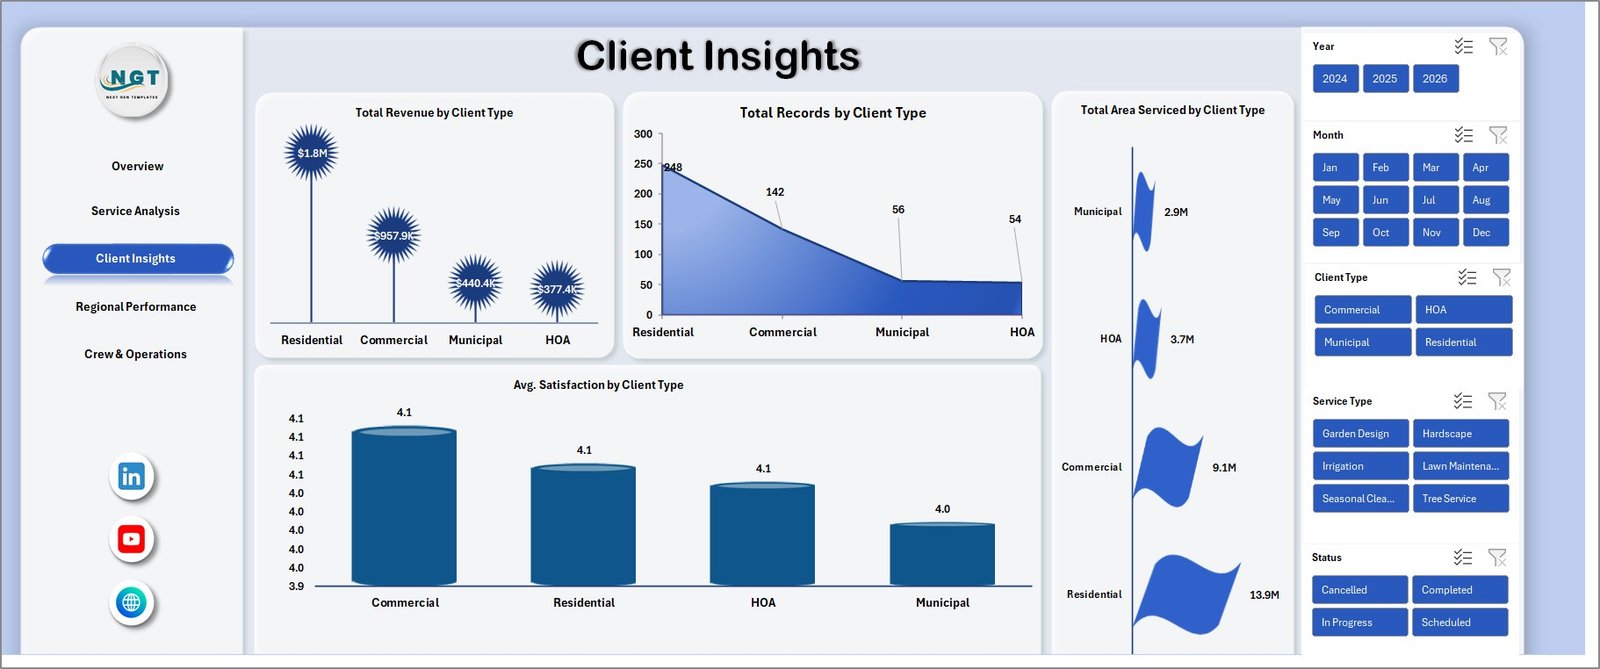
Client Insights
4. Regional Performance
The Regional Performance page closes the revenue-vs-cost loop with Total Revenue Vs Overall Cost by Region, Net Profit by Region, Total Hours by Region, and Total Records by Region. For multi-location landscaping operations, this is the page that decides where to put the next crew or truck.
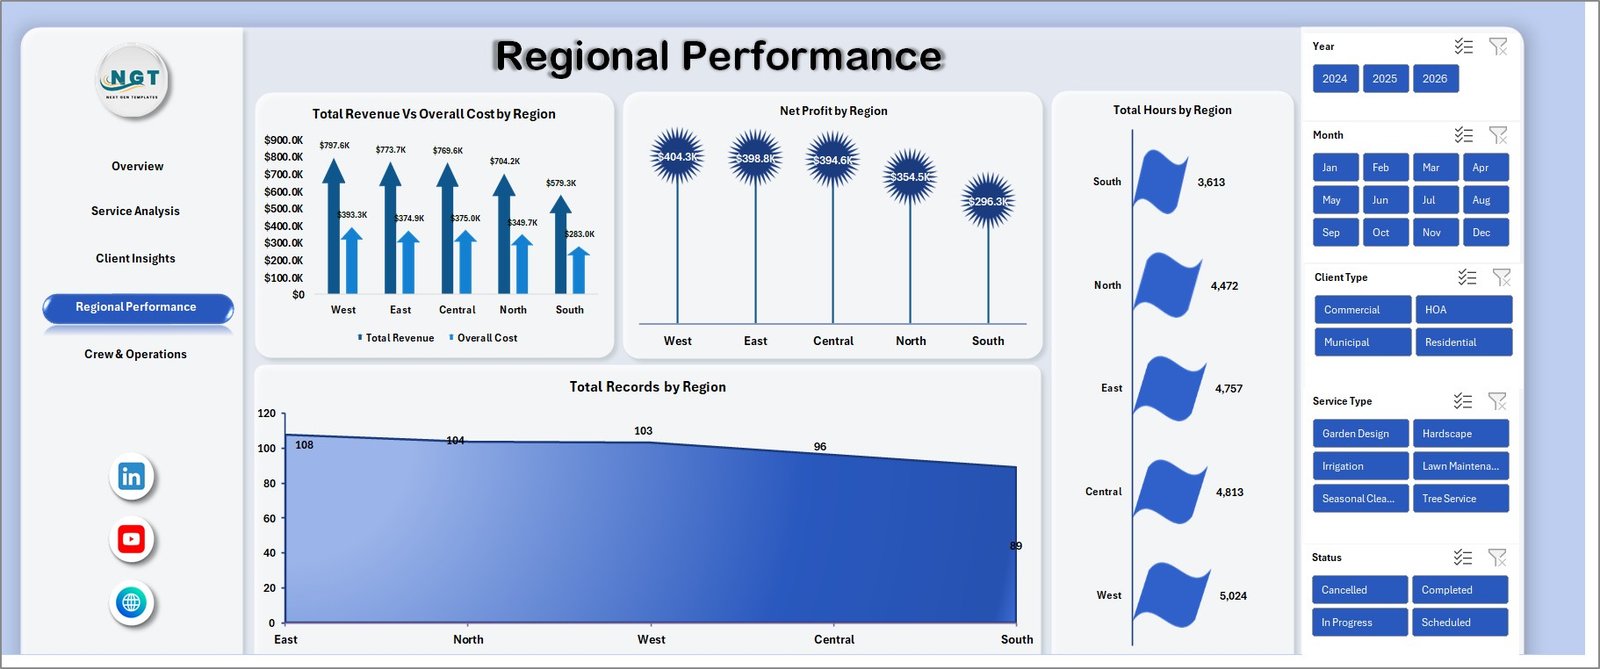
Regional Performance
5. Crew & Operations
The Crew & Operations page benchmarks crew leaders on Total Revenue by Crew Leader, Total Records by Crew Leader, and Completion % by Crew Leader. The completion % view is the most actionable view in the template — it surfaces which crews finish jobs on schedule and which need coaching.
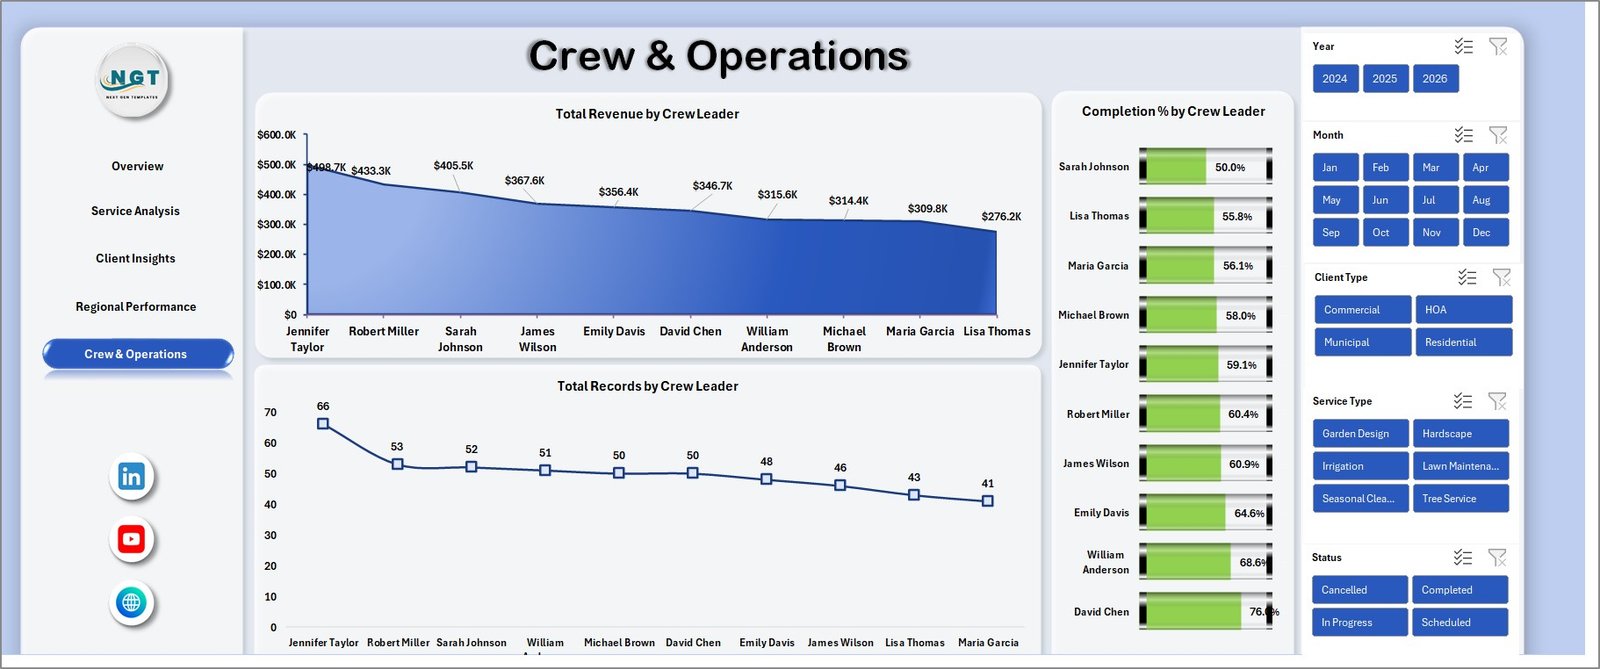
Crew & Operations
6. Data Sheet
The Data Sheet is where you replace the sample records with your own job data. Keep the column order intact and every page updates automatically.
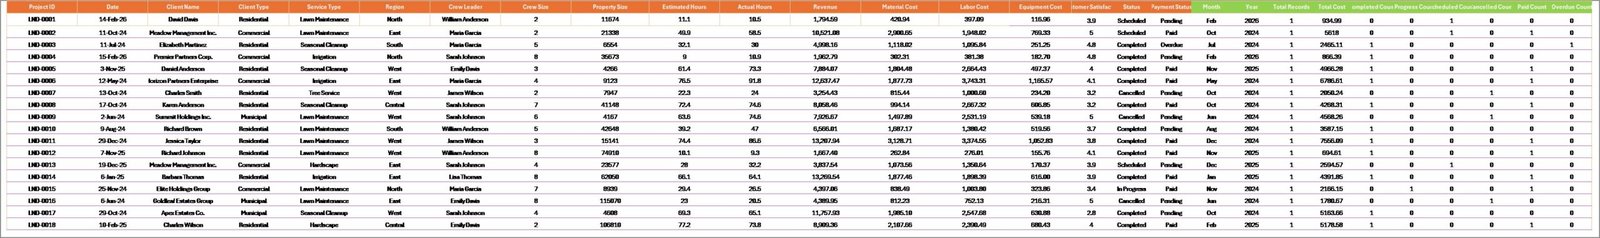
Data Sheet tab
7. Support Sheet
The Support Sheet holds every pivot table that feeds the dashboard. Hide this tab before sharing with ownership — they only need the polished pages.
Support sheet tab
Landscaping Dashboard in Excel vs. Google Sheets Equivalent vs. Paid Landscaping SaaS — Feature Comparison
| Feature | Landscaping Dashboard in Excel | Google Sheets equivalent | Paid Landscaping SaaS (Jobber / LMN / Aspire) |
|---|---|---|---|
| Cost | $17.99 one-time | $9.99–$14.99 one-time | $39–$299 / user / month |
| Platform | Microsoft Excel (desktop + web + Mac) | Google Sheets (browser only) | Cloud SaaS only |
| Setup time | Under 10 minutes | Under 15 minutes | 2–8 weeks onboarding |
| Works offline | ✅ | ❌ | ❌ |
| Share with leadership | ✅ Email / OneDrive / SharePoint | ✅ Share link | ✅ Paid seat per viewer |
| Customizable fields | ✅ Fully editable | ✅ Fully editable | ⚠️ Vendor-controlled |
| Crew leader benchmarking | ✅ Out of the box | ✅ | ⚠️ Higher tier only |
| Year-1 cost at 5 users | $17.99 | ~$14.99 | $2,340–$17,940 |
| Vendor lock-in | ❌ None | ❌ None | ✅ Export fees common |
For landscaping business owners who want crew-level, service-level, and regional visibility without paying $2K–$18K a year for a SaaS field service platform, the Landscaping Dashboard in Excel sits in the sweet spot.
Who Should Use This Template
Perfect for:
- Landscaping and lawn care companies with 2–30 crews serving residential, commercial, and HOA clients
- Landscape design and build firms wanting service-mix and regional profitability in one view
- Hardscaping and irrigation contractors tracking job-level revenue, hours, and area serviced
- Multi-location landscaping operations benchmarking regional performance and crew leaders
- Landscaping operations managers presenting monthly performance decks to ownership
Not a fit if:
- You are a solo lawn care operator who needs field scheduling and invoicing (use Jobber or Housecall Pro)
- You need route optimization, GPS tracking, or real-time crew dispatch (use LMN or Aspire)
- You require SOC 2-audited cloud access with SSO and granular role permissions
Real-World Use Cases
Daniel owns a 25-crew commercial landscaping company in North Carolina. Before this template, his Monday leadership meeting required two hours of copy-pasting from three spreadsheets. Now he drops the week’s job data into the Data Sheet, clicks Refresh All, and screenshots the Overview and Regional Performance pages straight into a PowerPoint. He used the Crew & Operations page to spot that one crew leader had a 73% completion % — a coaching conversation that wouldn’t have happened without the data.
Maria is the operations manager at a lawn care franchise with 8 locations across the Southeast. Each month, she drops the regional job data into the Data Sheet, refreshes, and walks the franchise owner through Net Profit by Region. The regional view surfaced a location where hours logged were high but completion % was under 80%. Fixing that bottleneck added an estimated $47K in annual margin.
James is an independent landscaping consultant serving three small landscaping companies. He uses the same Excel file for each one — copies the template, drops in their data, and delivers a monthly reporting pack for a flat consulting fee. He had previously been paying $199 per seat per month for a field service SaaS that did less; switching to this one-time $17.99 template was his fastest margin improvement of the year.
Advantages of Landscaping Dashboard in Excel
💰 No subscription fees. $17.99 one-time replaces a tool that would cost $2,340–$17,940 a year at 5 seats on Jobber, LMN, or Aspire.
⚡ Under 10 minutes to first value. Download, paste, refresh. No onboarding call, no vendor implementation, no 6-week rollout.
🔓 Fully customizable. Every pivot, chart, slicer, and KPI is open for editing. Change the date range, add a new metric, rename a region — it is your file.
🛡️ No vendor lock-in. Your data stays in your Excel file on your OneDrive or local drive. No export fees, no enterprise-tier gatekeeping.
🖥️ Cross-platform. Works on Windows Excel, Excel for Mac, and Excel on the web with a Microsoft 365 subscription.
Opportunities for Improvement
In the spirit of honest reporting — and to help you decide if this template is right for your workflow — here are the areas where the Landscaping Dashboard in Excel is not the right tool:
📅 No scheduling or dispatch. If you need crew scheduling, route optimization, or field invoicing, this template is a reporting layer, not a field service platform. Pair it with Jobber or Housecall Pro.
🔐 No built-in SSO. If your IT team mandates SSO-gated access to all analytics, a cloud SaaS is the better fit. Excel file sharing relies on OneDrive / SharePoint permissions.
📱 No mobile app. This template is designed to be opened on a laptop or desktop. For on-the-truck crew workflows, a mobile-first SaaS is the right tool.
These aren’t bugs — they are scope boundaries. For 80% of landscaping firms looking for a clean reporting view, this template solves the problem; for the other 20%, these limitations matter.
Best Practices
📅 Refresh monthly at minimum. Drop a calendar reminder for the 1st of each month to paste the previous month’s job records, refresh, and screenshot the Overview page for your leadership deck.
🗃️ Keep the Data Sheet column order intact. Pivots bind to column positions — if you rearrange columns, you will break the refresh chain.
🔍 Use slicers before exporting. If ownership only wants the Southeast region, filter with the slicer, then copy the page to PowerPoint or save as PDF.
🤫 Hide the Support Sheet before sharing. Right-click the tab, click Hide. Stakeholders only need the polished pages.
📚 Pair with the Landscaping Services Dashboard in Excel or the Power BI version if your team is cross-tool.
Explore Relevant Templates
🌳 Landscaping Services Dashboard in Excel — alternative Excel view of landscaping operations with different KPI emphasis.
📊 Landscaping Services Dashboard in Power BI — same analytics in Power BI with interactive drill-through.
🛠️ HVAC Service Dashboard in Power BI — same layout pattern for HVAC service businesses.
🏗️ Construction Project Cost Dashboard in Google Sheets — project-cost view for adjacent trades.
📦 Moving Company Dashboard in Power BI — similar field-operations dashboard template for moving and logistics firms.
Also available as: Landscaping Services KPI Dashboard in Power BI.
Frequently Asked Questions
What KPIs does the Landscaping Dashboard in Excel track?
The Landscaping Dashboard in Excel tracks 5 headline KPIs — Total Revenue, Net Profit, Total Records, Total Hours, and Completion % — plus 14 chart-level metrics spanning service type, client type, region, and crew leader. All metrics update automatically on Data → Refresh All.
How long does setup take?
Setup for the Landscaping Dashboard in Excel takes under 10 minutes. Paste your job records into the Data Sheet keeping the column order intact, click Data → Refresh All, and every KPI card, chart, and slicer updates in one pass. No macros, no coding.
Which version of Excel do I need?
The Landscaping Dashboard in Excel runs on Microsoft Excel 2016 or later on Windows and Mac, and on Excel for the web with any Microsoft 365 subscription. It uses native pivot tables and slicers — no add-ins, no VBA, no plugins.
How does this template compare to Jobber, LMN, or Aspire?
Jobber, LMN, and Aspire are strong field service platforms for scheduling and invoicing, but they cost $39–$299 per user per month. For a team of 5, that is $2,340–$17,940 a year. The Landscaping Dashboard in Excel is $17.99 one-time and covers the performance-reporting layer most landscaping firms need.
Can I customize the charts, KPIs, and slicers?
Yes. Every pivot, chart, and slicer in the Landscaping Dashboard in Excel is fully editable. Add new metrics, rename categories, change date ranges, or extend the Data Sheet with extra columns — the template is yours to modify.
Does it work for multi-location landscaping companies?
Yes. The Landscaping Dashboard in Excel scales from single-location crews to multi-state landscaping operations. The Regional Performance and Crew & Operations pages are specifically designed for multi-crew, multi-region reporting.
Will I get future updates to the template?
Yes. Every NextGenTemplates purchase includes free updates. You will receive a notification when a new version of the Landscaping Dashboard in Excel is released.
About the Author
Built by PK — Microsoft Certified Professional with 15+ years of Excel, Google Sheets, and Power BI experience. Founder of NextGenTemplates, reaching 300K+ subscribers across YouTube channels. Every template is hand-built and tested before release.
Conclusion
If you run a landscaping company, a lawn care franchise, a hardscaping firm, or an irrigation contracting business, the Landscaping Dashboard in Excel replaces a $2K–$18K-a-year SaaS reporting bill with a $17.99 one-time download. It gives you the same 5 headline KPIs, the same 14 decision-quality charts, and the same slicer-driven filtering that enterprise landscaping firms pay thousands for — in a file you control, on a platform your team already uses.
👉 Click here to Purchase the Landscaping Dashboard in Excel
✅ Instant download · One-time payment · No subscription
🎥 Visit Youtube.com/@PK-AnExcelExpert for step-by-step Excel dashboard tutorials.