The Cyber Law Advisory Dashboard in Excel is designed for cyber law advisors, law firms, corporate legal departments, compliance consultants, and risk teams that need a fast way to review advisory fee, exposure, case volume, billable hours, response speed, satisfaction, workload, and resolution performance. Legal operations teams often lose time when case data, fee data, and risk data are scattered across emails, static reports, or manual spreadsheets. A structured Excel dashboard brings these moving parts into one refreshable workbook.
This template includes 5 dashboard pages, 5 executive KPI cards, multiple slicers, a structured Data Sheet, and a Support Sheet with pivot tables. It is built for users who want practical Excel reporting without paying for a full legal matter management or SaaS analytics platform.
Download the Cyber Law Advisory Dashboard in Excel from NextGenTemplates.
Key Features of Cyber Law Advisory Dashboard in Excel
- 5 KPI cards for Total Advisory Fee, Total Exposure, Total Cases, Total Billable Hours, and Avg. Satisfaction Score.
- 5 dashboard pages for Overview, Risk Review, Advisory Areas, Client Insights, and Consultant Load.
- 18+ chart views covering advisory fee, exposure, risk level, priority, jurisdiction, status, industry, client, consultant, region, and quarter analysis.
- Interactive slicers to filter dashboard views quickly by key business dimensions.
- Data Sheet tab where users replace the sample data with their own advisory records.
- Support Sheet tab containing pivot tables that power the charts and can be hidden after setup.
- Excel-native workflow that uses Refresh All to update pivots, charts, slicers, and dashboard cards.
Dashboard Pages Explanation
1. Overview Page
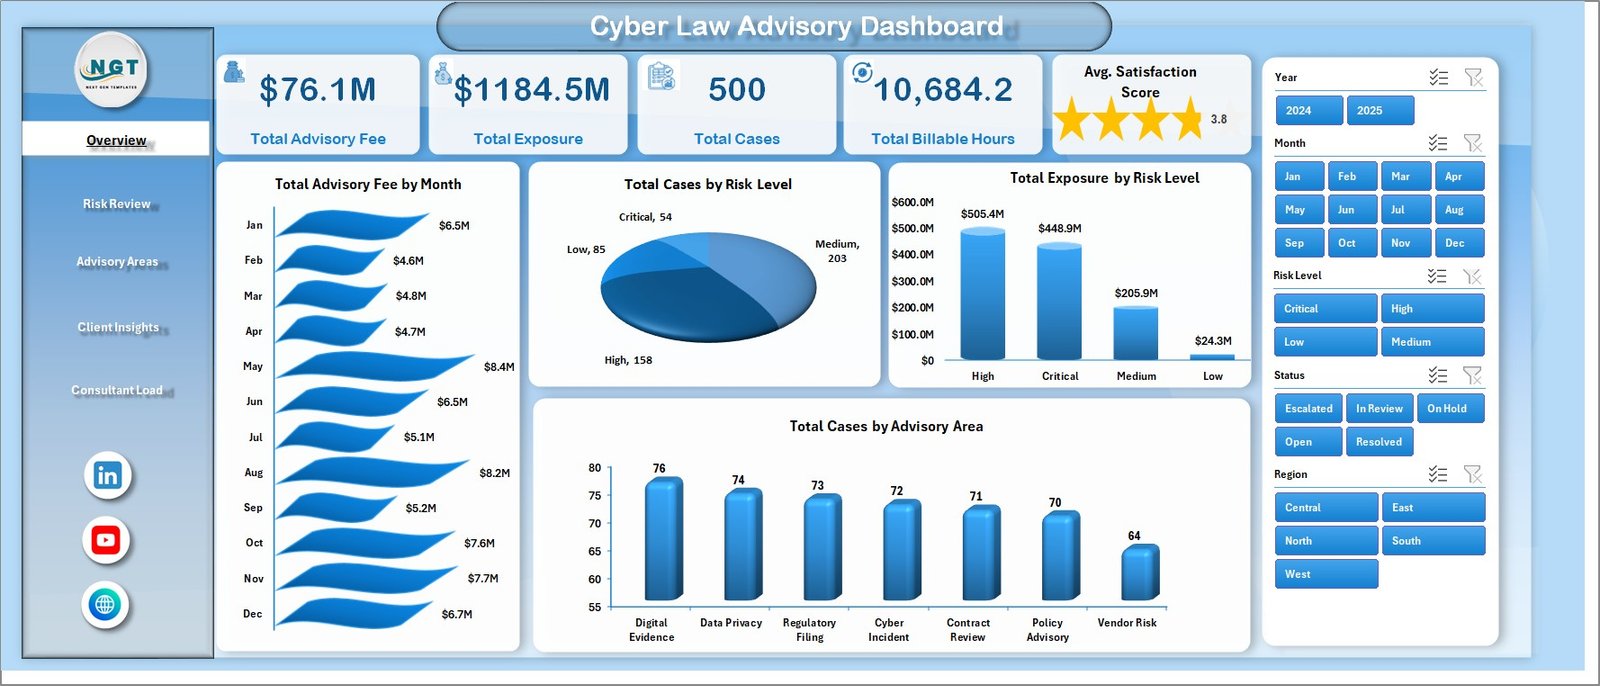
The Overview Page gives a high-level view of cyber law advisory performance. At the top of the sheet, cards show Total Advisory Fee, Total Exposure, Total Cases, Total Billable Hours, and Avg. Satisfaction Score. These cards help partners, legal operations managers, and compliance leaders understand revenue, risk, workload, effort, and service quality in one view.
Total Advisory Fee by Month: This chart shows monthly advisory fee movement and helps identify demand peaks, slower months, and seasonal advisory patterns.
Total Cases by Risk Level: This chart separates matter volume by risk level so teams can quickly see whether low, medium, high, or critical matters dominate the workload.
Total Exposure by Risk Level: This chart connects financial or compliance exposure with risk severity and supports prioritization of high-impact cyber law matters.
Total Cases by Advisory Area: This chart compares case distribution across advisory areas such as data privacy, breach response, governance, contracts, and policy support.
2. Risk Review
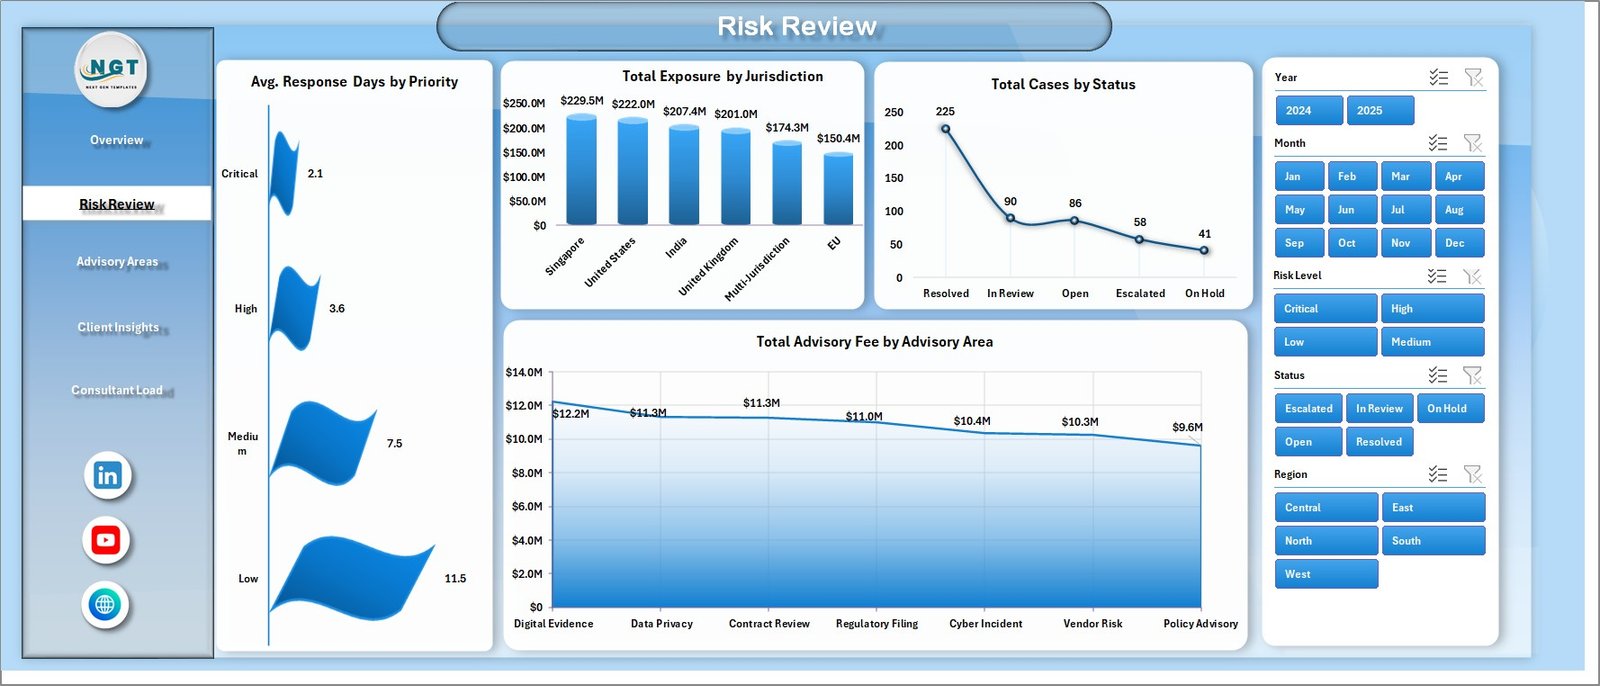
The Risk Review page is built for urgency and exposure analysis. It includes Avg. Response Days by Priority, Total Exposure by Jurisdiction, Total Cases by Status, and Total Advisory Fee by Advisory Area. Together, these visuals help cyber law teams understand where risk is concentrated, how quickly the team responds, and which advisory areas create the strongest commercial value.
3. Advisory Areas
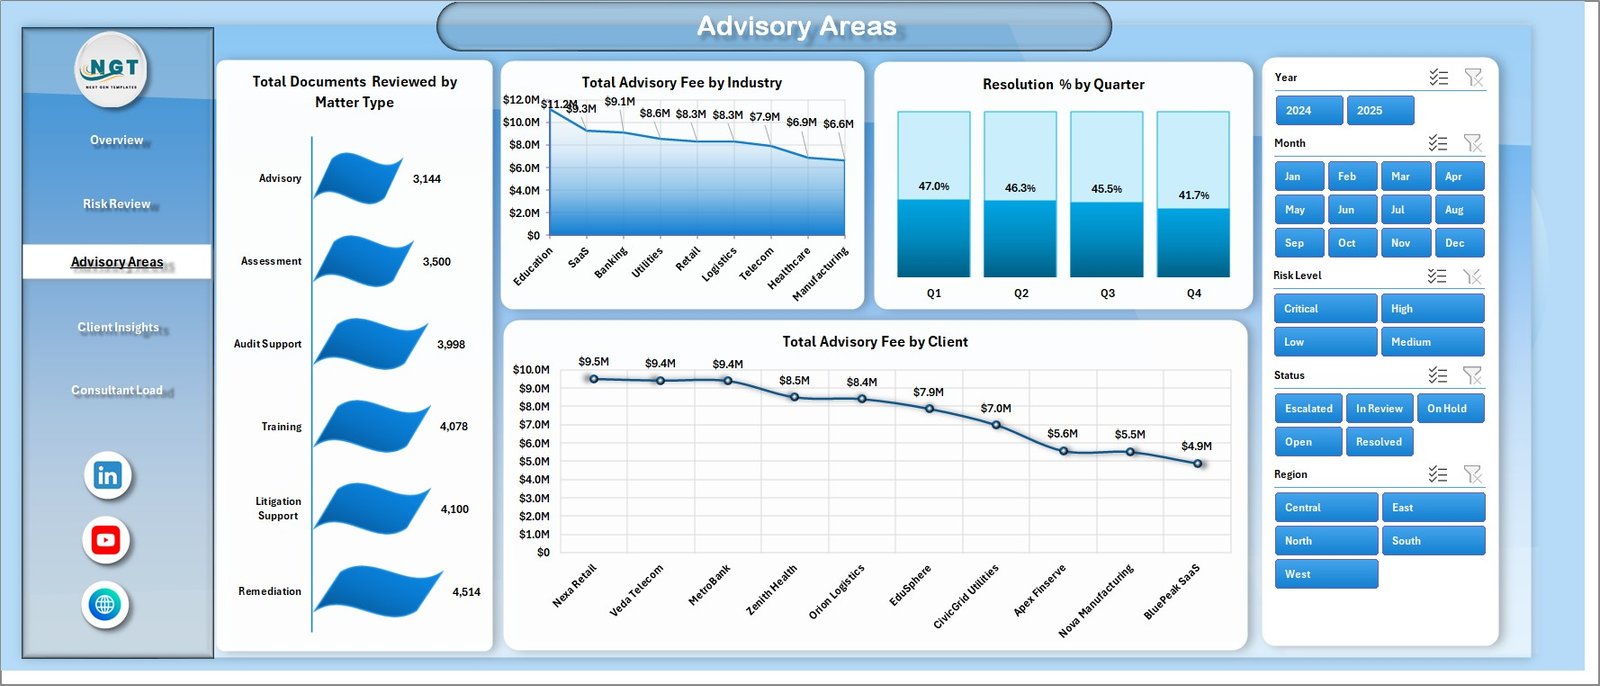
The Advisory Areas page focuses on matter type, industry, resolution, and client value. Total Documents Reviewed by Matter Type shows review workload by category. Total Advisory Fee by Industry helps identify which client sectors produce the most advisory value. Resolution % by Quarter tracks closure performance, and Total Advisory Fee by Client supports client profitability and relationship reviews.
4. Client Insights
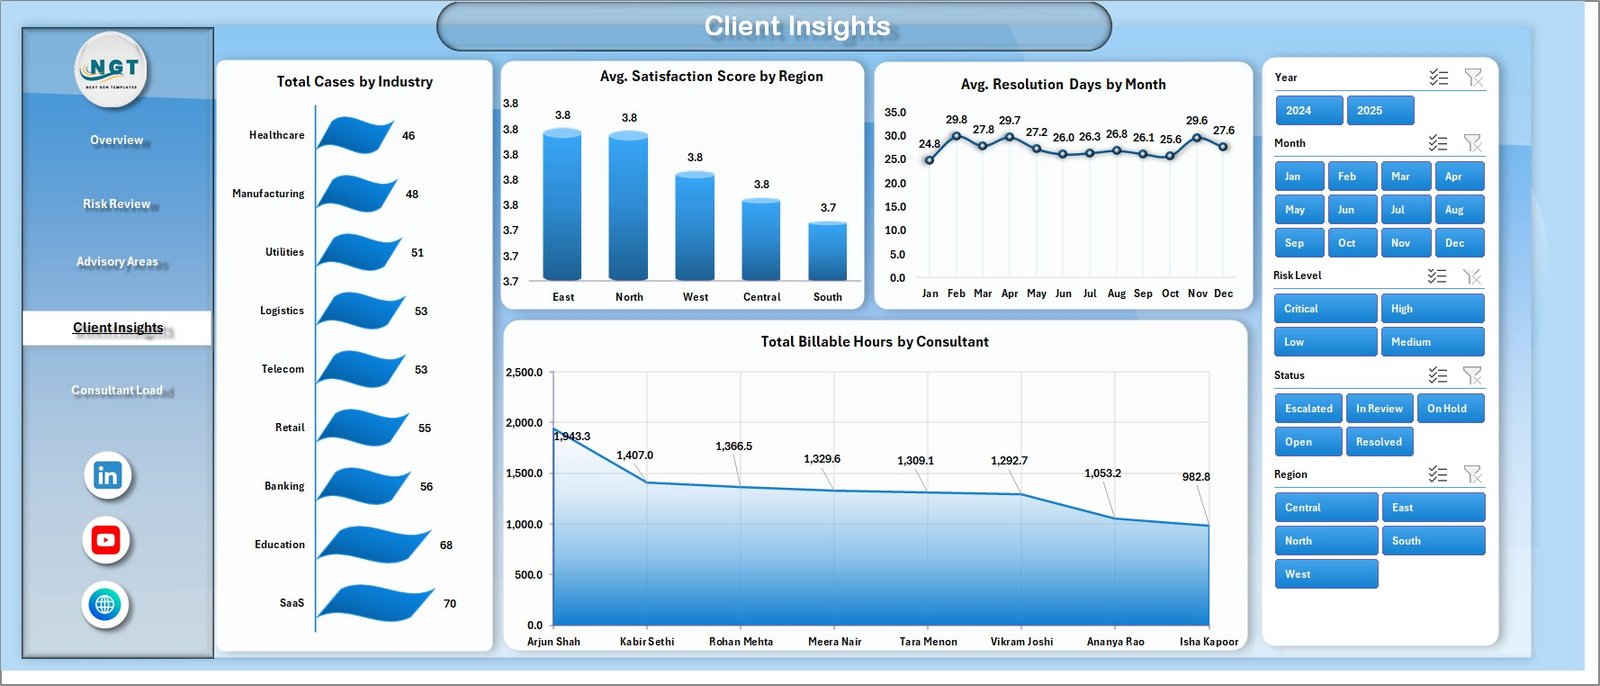
The Client Insights page is useful for account reviews, service quality analysis, and legal operations reporting. Total Cases by Industry shows which sectors require the most support. Avg. Satisfaction Score by Region compares client sentiment by geography. Avg. Resolution Days by Month shows turnaround trends, and Total Billable Hours by Consultant explains how work is distributed across advisors.
5. Consultant Load
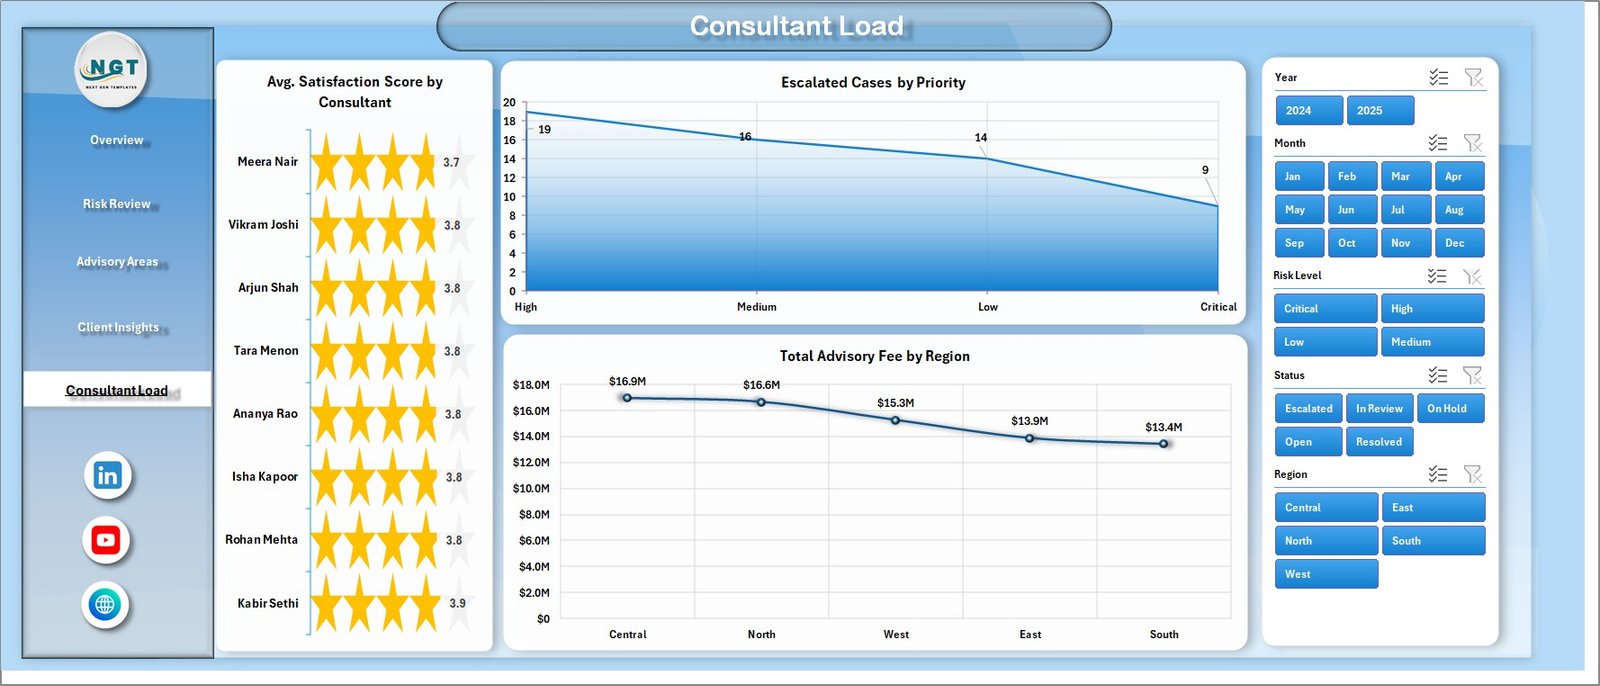
The Consultant Load page helps managers balance team effort and quality. Avg. Satisfaction Score by Consultant compares advisor-level feedback. Escalated Cases by Priority shows urgent workload pressure, and Total Advisory Fee by Region explains where regional revenue is coming from. This page is especially helpful for weekly workload planning.
6. Data Sheet Tab
The Data Sheet is where users add their own cyber law advisory records. Keep the same column format, replace the sample rows, and then refresh the workbook. This keeps the dashboard reliable while giving users flexibility to use their own clients, consultants, jurisdictions, risk levels, and advisory areas.

7. Support Sheet
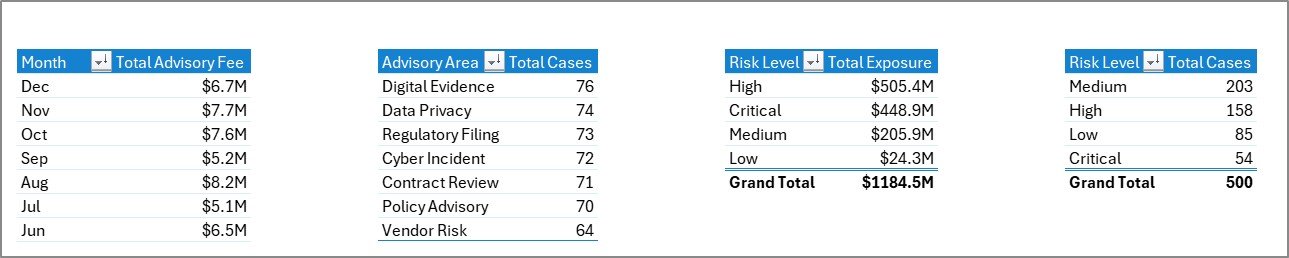
The Support Sheet contains the pivot tables used to create the entire dashboard dynamically. After updating the Data Sheet, go to the Data tab in the Excel Ribbon and click Refresh All. Microsoft also documents how to refresh PivotTable data in Excel, which is useful for teams that want to understand the refresh workflow in more detail: Microsoft Support – Refresh PivotTable data. You can keep the Support Sheet hidden for a cleaner user experience.
Cyber Law Advisory Dashboard in Excel vs. Google Sheets vs. Paid CRM/SaaS – Feature Comparison
| Feature | This Excel Dashboard | Google Sheets Alternative | Paid Legal/SaaS Alternative |
|---|---|---|---|
| Cost | $17.99 one-time | Template cost or manual build | $50-$300+ per user/month |
| Platform | Microsoft Excel | Google Sheets | Vendor-hosted cloud app |
| Setup time | Open, replace data, refresh | Copy sheet and configure sharing | Requires onboarding and configuration |
| Customizable fields | Fully editable workbook | Editable sheet structure | Limited by vendor settings |
| Cyber law advisory analytics | Included across 5 dashboard pages | Requires custom setup | Often requires paid configuration |
| Year-1 cost at 5 users | $17.99 total | Template cost or internal build time | $3,000-$18,000+ |
Who Should Use This Template
This template is useful for cyber law consultants, data privacy advisory teams, compliance counsel, legal operations managers, corporate legal departments, risk advisory practices, and law firm partners who want to turn advisory records into clear Excel reporting.
It is also useful for teams that already maintain matter data in spreadsheets but need better visual reporting for leadership meetings, client reviews, regional comparisons, and consultant workload planning.
Real-World Use Cases
Cyber law partner: A partner uses the Overview and Risk Review pages before a weekly leadership meeting to explain advisory fees, high-exposure matters, response days, and case status.
Compliance counsel: A compliance leader uses the Advisory Areas page to understand how privacy, breach response, governance, and contract-related matters are changing quarter by quarter.
Legal operations manager: An operations manager uses Consultant Load to compare satisfaction scores, billable hours, escalated cases, and regional fee contribution across the advisory team.
Advantages of Cyber Law Advisory Dashboard in Excel
- It works in Microsoft Excel, so many business users can update and review it without new software training.
- It keeps advisory reporting structured through a Data Sheet and pivot-based Support Sheet.
- It gives leadership multiple perspectives: risk, fee value, client insight, consultant workload, and resolution performance.
- It can be customized by Excel users who want to adjust charts, labels, colors, or fields.
Opportunities for Improvement
This dashboard is an analytics template, not a full legal matter management system. It does not include client portals, automated alerts, document storage, approval workflows, or secure role-based access. Teams handling sensitive cyber law data should store the workbook in an approved secure location and follow internal data protection policies.
Best Practices
- Keep the Data Sheet format consistent when adding new records.
- Use standardized values for risk level, jurisdiction, priority, advisory area, status, region, and consultant names.
- Refresh all pivots after every major data update.
- Hide the Support Sheet in user-facing versions, but keep it available for maintenance.
- Review exposure, escalated cases, and response days regularly, not only at month end.
Explore Relevant Templates
You may also like Legal Dashboard in Excel, Crisis Management Firms Dashboard in Excel, and Legal Research KPI Dashboard in Power BI.
Browse more MS Excel templates and Excel Dashboard templates.
Frequently Asked Questions
What does the Cyber Law Advisory Dashboard in Excel track?
It tracks advisory fee, exposure, cases, billable hours, satisfaction score, risk level, priority, jurisdiction, status, advisory area, matter type, documents reviewed, industry, quarter, client, region, resolution days, and consultant workload.
Can I use my own data?
Yes. Replace the sample records in the Data Sheet with your own cyber law advisory data, then click Refresh All.
Do I need advanced Excel skills?
No. Basic users can update the Data Sheet and refresh the workbook. Advanced users can customize pivots, charts, slicers, and formulas.
Can I customize advisory areas and jurisdictions?
Yes. Add your own advisory areas, jurisdictions, clients, consultants, industries, and risk levels in the Data Sheet.
Is this a legal case management system?
No. It is an Excel dashboard for reporting and analysis. It does not include workflow automation, document storage, client portals, or legal intake forms.
Can the Support Sheet be hidden?
Yes. The Support Sheet can be hidden after setup while still powering the workbook’s pivot tables and charts.
About the Author
Built by PK – Microsoft Certified Professional with 15+ years of Excel, Google Sheets, and Power BI experience. Founder of NextGenTemplates, reaching 300K+ subscribers across YouTube channels. Every template is hand-built and tested before release.
Conclusion
The Cyber Law Advisory Dashboard in Excel gives legal and compliance teams a focused way to review cyber law advisory performance without building every chart, pivot, and dashboard page from scratch. Use it to track fees, exposure, cases, response days, resolution, client insight, and consultant workload in one editable workbook.
Download here: Cyber Law Advisory Dashboard in Excel.
For step-by-step Excel, dashboard, and reporting tutorials, visit youtube.com/@PKAnExcelExpert.