The Cyber Law Advisory Dashboard in Power BI is designed for cyber law advisors, law firms, compliance consultants, privacy teams, legal operations managers, and corporate counsel who need a faster way to analyze advisory cases, billable hours, high-risk matters, advisory fees, escalations, response speed, jurisdictions, client demand, and consultant workload. Instead of reviewing disconnected spreadsheets or static monthly summaries, this PBIX dashboard gives users five focused report pages with KPI cards, slicers, and visual analysis.
Cyber law work moves quickly. Breach response, privacy compliance, contract risk, governance, and regulatory advisory matters can create urgency across clients, regions, and consultants. A structured Power BI dashboard helps teams review the facts in one place before partner meetings, client reviews, risk calls, and workload planning discussions.
Download the Cyber Law Advisory Dashboard in Power BI from NextGenTemplates.
Key Features of Cyber Law Advisory Dashboard in Power BI
- 5 executive KPI cards for Total Cases, Total Billable Hours, High Risk Cases, Total Advisory Fee, and Escalated Cases.
- 5 report pages covering Overview, Risk Review, Advisory Areas, Client Insights, and Consultant Load.
- 16+ chart views across advisory area, risk level, month, priority, jurisdiction, client, industry, region, consultant, and resolution performance.
- Interactive slicers to filter the dashboard quickly during leadership reviews and client-facing analysis.
- Editable PBIX file that can be customized in Power BI Desktop with your own fields, measures, colors, and data connections.
- Legal advisory focus for cyber law, privacy, compliance, breach response, governance, and risk advisory reporting.
Dashboard Pages Explanation
1. Overview Page
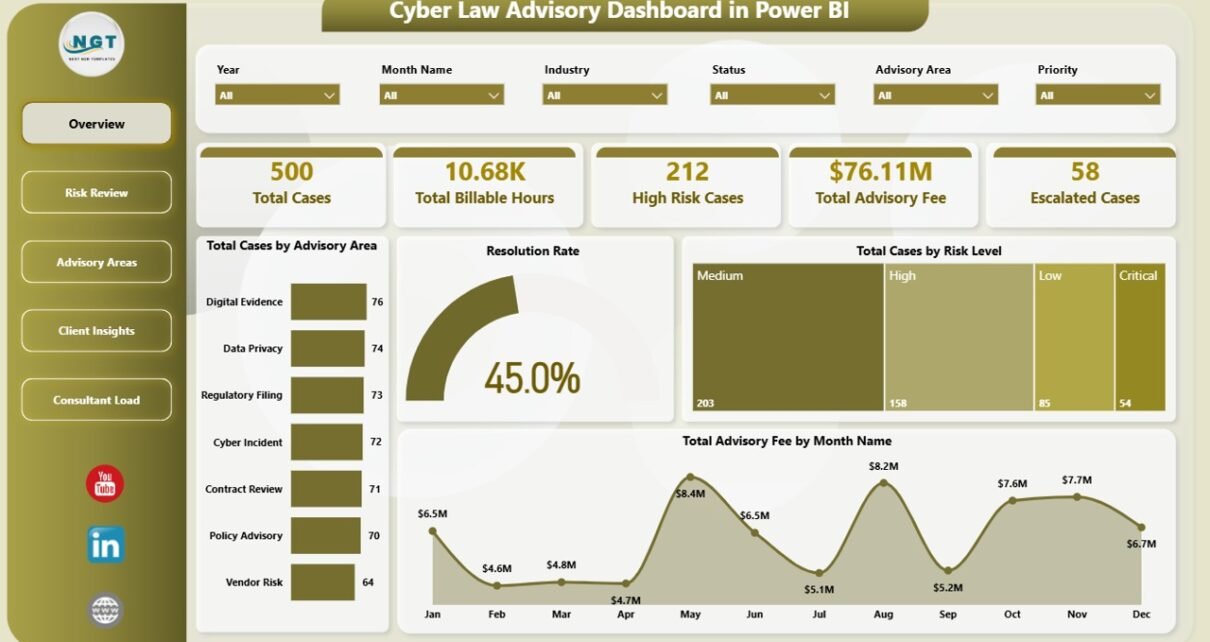
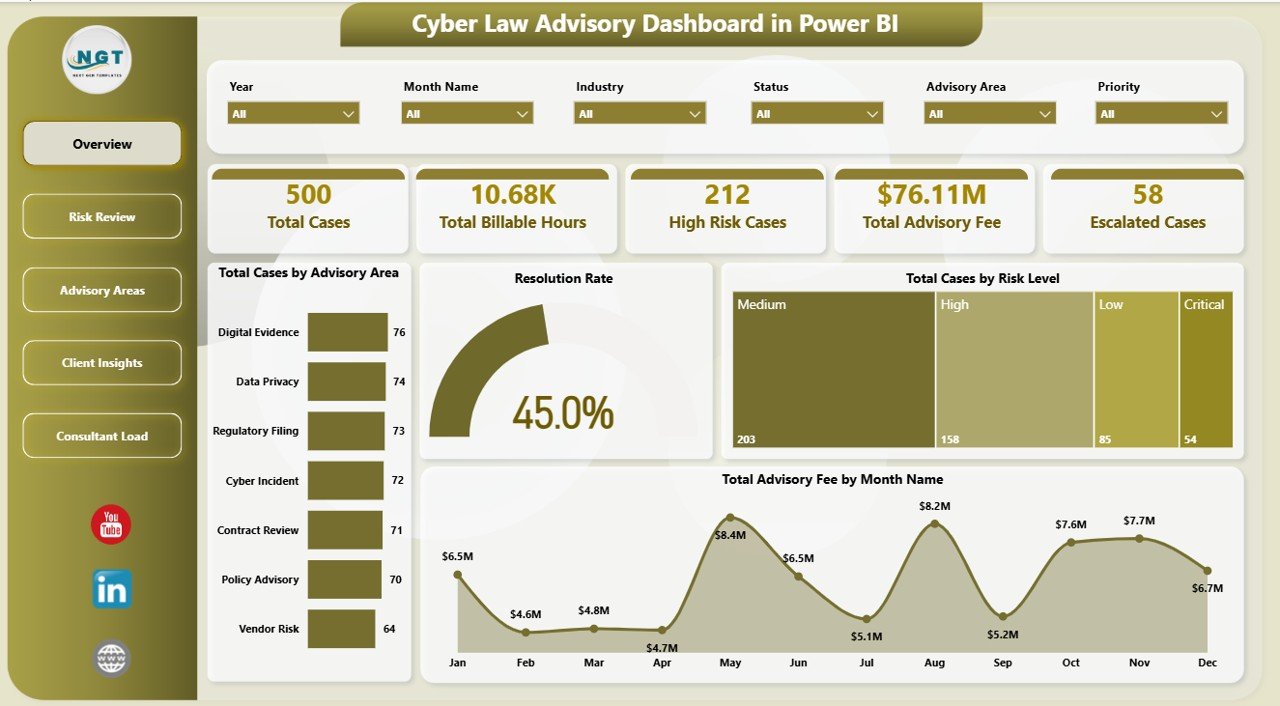
The Overview page gives a high-level view of cyber law advisory performance. At the top of the report, KPI cards show Total Cases, Total Billable Hours, High Risk Cases, Total Advisory Fee, and Escalated Cases. These cards help partners and legal operations leaders understand workload, commercial value, urgency, and risk pressure without opening multiple reports.
Total Cases by Advisory Area: This chart shows which advisory areas generate the most case volume. It helps teams understand whether privacy, breach response, compliance, governance, or contract matters are driving workload.
Resolution Rate by Overall Cases: This visual compares resolved work against total case activity. It helps leaders monitor closure performance and identify whether open matters are building up over time.
Total Cases by Risk Level: This chart separates case volume by severity. It helps teams see whether high-risk or critical matters need more immediate staffing or escalation review.
Total Advisory Fee by Month Name: This monthly fee trend helps partners and finance teams identify advisory demand cycles. It also supports revenue review by showing which months produce stronger fee contribution.
2. Risk Review
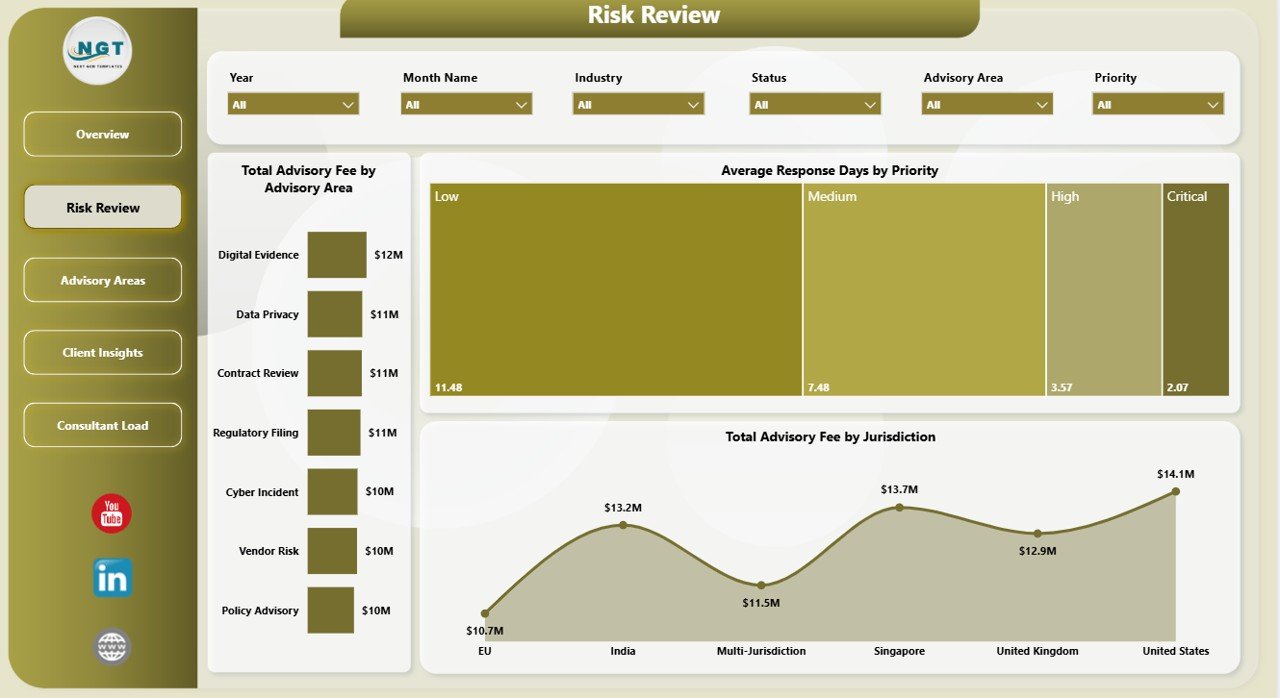
The Risk Review page focuses on urgency, fee concentration, and jurisdiction-level analysis. Total Advisory Fee by Advisory Area shows which cyber law services create the highest value. Average Response Days by Priority shows whether urgent matters are being handled quickly enough. Total Advisory Fee by Jurisdiction helps teams compare fee contribution across legal regions or regulatory areas.
3. Advisory Areas
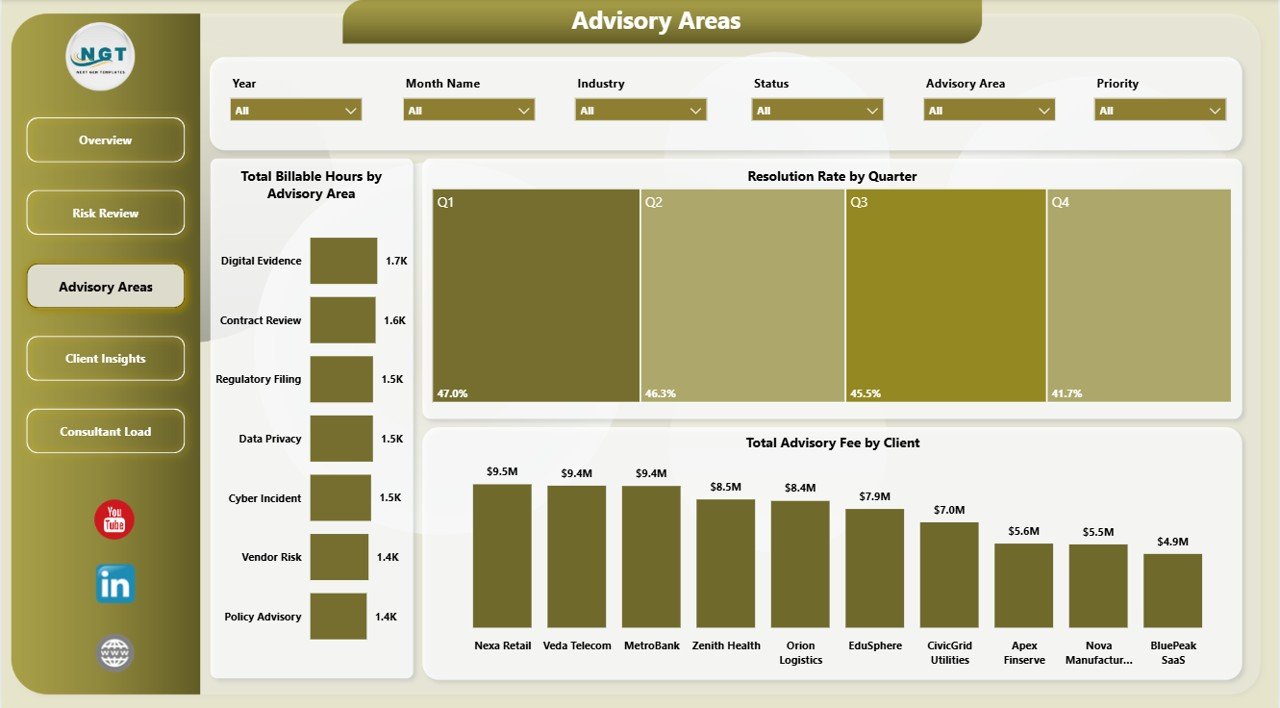
The Advisory Areas page explains where consultant time and fee value are going. Total Billable Hours by Advisory Area helps managers see which workstreams consume the most effort. Resolution Rate by Quarter shows whether closure performance is improving or slipping over time. Total Advisory Fee by Client identifies the client relationships contributing the most advisory value.
4. Client Insights
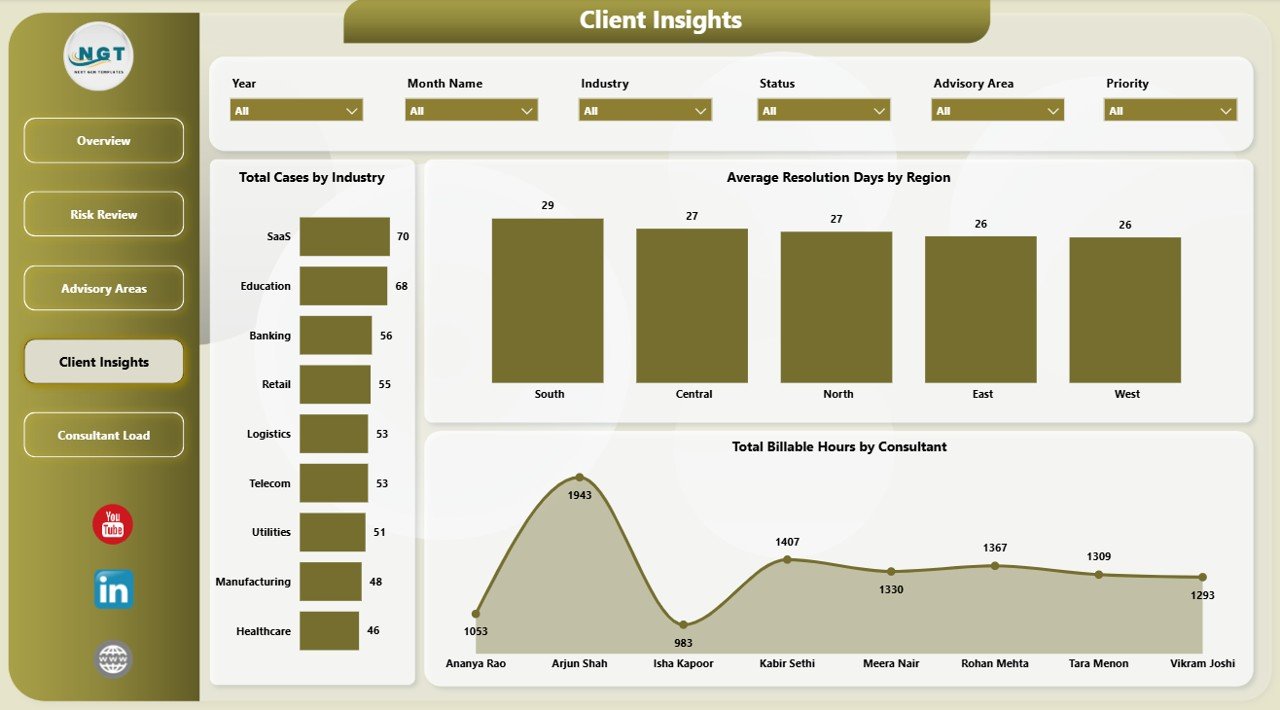
The Client Insights page is useful for account reviews and service planning. Total Cases by Industry shows which client sectors generate the most cyber law advisory demand. Average Resolution Days by Region compares turnaround speed geographically. Total Billable Hours by Consultant explains how advisory work is distributed across the team.
5. Consultant Load
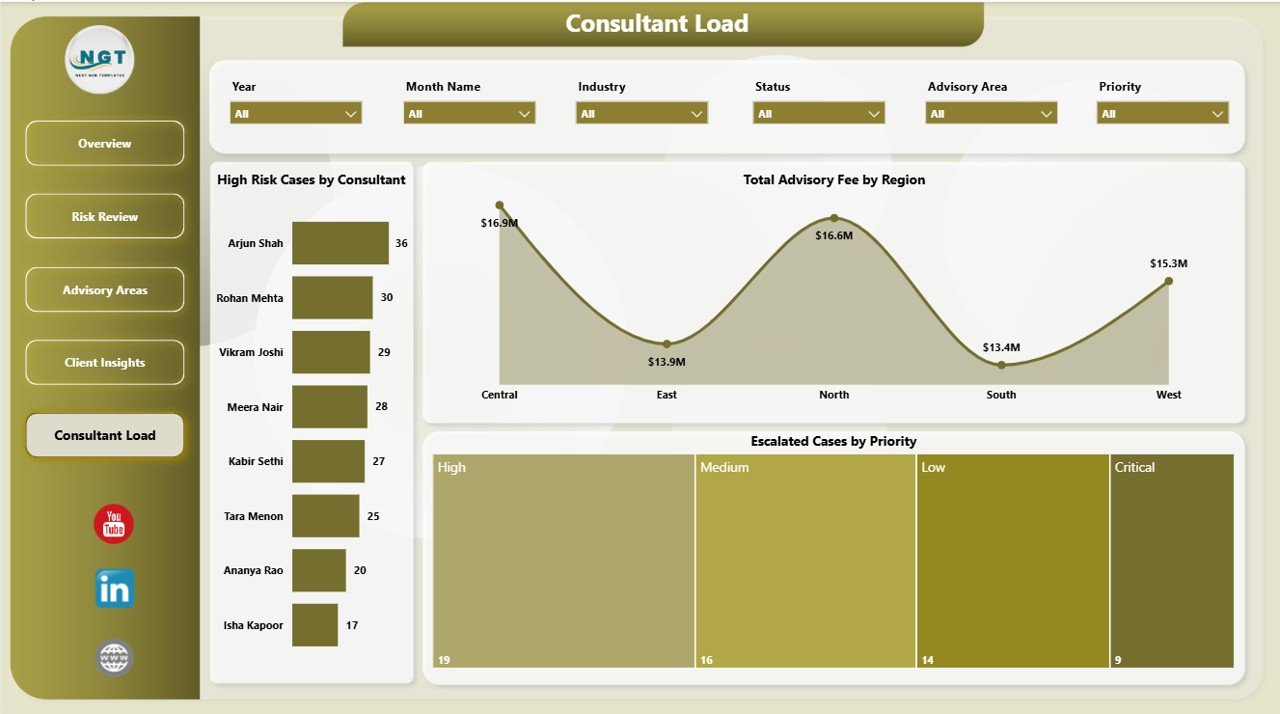
The Consultant Load page helps managers review capacity, risk pressure, and escalations. High Risk Cases by Consultant identifies advisors carrying the heaviest high-risk work. Total Advisory Fee by Region shows regional commercial contribution, while Escalated Cases by Priority highlights where urgent escalation activity is increasing.
Cyber Law Advisory Dashboard in Power BI vs. Tableau vs. Paid Legal SaaS – Feature Comparison
| Feature | This Power BI Dashboard | Tableau/Qlik Alternative | Paid Legal SaaS Alternative |
|---|---|---|---|
| Cost | $17.99 one-time | License or custom dashboard cost | $50-$300+ per user/month |
| Platform | Power BI Desktop / Power BI Service | Tableau Desktop, Tableau Cloud, or Qlik Sense | Vendor-hosted cloud app |
| Setup time | Open PBIX, connect data, refresh | Requires dashboard build and data modeling | Requires onboarding and configuration |
| Customizable fields | Editable model, visuals, and measures | Editable with BI skills | Limited by vendor settings |
| Real-time team collaboration | Available through Power BI Service | Available with cloud licensing | Usually seat-based |
| Mobile access | Available through Power BI mobile/service | Available with cloud setup | Usually available |
| Share with link | Possible through Power BI Service | Possible through cloud publishing | Often requires login |
| Year-1 cost at 5 users | $17.99 plus Microsoft licensing you already use | Can increase with licenses | $3,000-$18,000+ |
| Cyber law advisory analytics | Included across 5 report pages | Requires custom build | Often requires paid setup |
Who Should Use This Template
This template is useful for cyber law consultants, data privacy advisors, law firm partners, compliance counsel, legal operations managers, risk advisory teams, and corporate legal departments. It is especially useful when teams already track advisory data but need a clean reporting layer for leadership conversations.
It is also useful for teams that want to use Power BI instead of Excel for interactive report pages, published dashboards, and a more scalable data model. Power BI Desktop is available from Microsoft, and Microsoft provides official guidance for getting started with the tool here: Microsoft Learn – Get started with Power BI Desktop.
Real-World Use Cases
Cyber law partner: A partner uses the Overview and Risk Review pages before weekly leadership meetings to explain case volume, high-risk matters, escalations, response speed, and advisory fee movement.
Compliance counsel: A compliance leader reviews Advisory Areas to understand whether privacy, breach response, governance, or contract work is consuming the most billable time.
Legal operations manager: An operations manager uses Consultant Load to compare high-risk work, escalated cases, regional advisory fees, and consultant workload across the team.
Advantages of Cyber Law Advisory Dashboard in Power BI
- It gives legal teams a focused Power BI reporting model without building every page from scratch.
- It connects case volume, fee value, risk level, resolution rate, and consultant workload in one dashboard.
- It supports slicer-driven reviews, making it easier to narrow analysis by client, region, jurisdiction, priority, or advisory area.
- It can be customized by analysts who want to update visuals, measures, fields, or report pages.
Opportunities for Improvement
This is an analytics dashboard, not a full legal matter management platform. It does not include secure document storage, intake forms, client portals, automated reminders, evidence handling, or role-based legal workflows. Teams handling sensitive cyber law data should follow internal security policies and use approved Microsoft 365 or Power BI governance settings when sharing reports.
Best Practices
- Standardize advisory area, priority, jurisdiction, risk level, client, industry, region, and consultant names before loading data.
- Review high-risk cases and escalations frequently, not only at month end.
- Use consistent date fields so monthly and quarterly visuals remain reliable.
- Keep a clean data source and refresh the model after every major update.
- Publish only through approved Power BI workspaces when the report includes sensitive client or legal data.
Explore Relevant Templates
You may also like Cyber Law Advisory Dashboard in Excel, Corporate Secretarial Dashboard in Power BI, and Crisis Management Firms Dashboard in Power BI.
Browse more Power BI templates and Power BI Dashboard templates.
Frequently Asked Questions
What does the Cyber Law Advisory Dashboard in Power BI track?
It tracks total cases, billable hours, high-risk cases, advisory fees, escalated cases, response days, risk level, priority, jurisdiction, advisory area, client, industry, region, consultant, and resolution rate.
Can I use my own cyber law advisory data?
Yes. You can replace the sample source or connect your own structured advisory data through Power Query, then refresh the model.
Do I need Power BI Desktop?
Yes. The PBIX file should be opened in Power BI Desktop. Sharing through Power BI Service may require Microsoft licensing depending on your setup.
Can I customize report pages and charts?
Yes. The file is editable, so you can adjust visuals, fields, relationships, DAX measures, colors, labels, and pages.
Is this a legal case management system?
No. It is a reporting and analytics dashboard. It does not include intake forms, document storage, client portals, legal workflow automation, or evidence management.
Can I share the dashboard with my team?
Yes. You can share the PBIX internally or publish it through Power BI Service according to your Microsoft licensing and data security policies.
About the Author
Built by PK – Microsoft Certified Professional with 15+ years of Excel, Google Sheets, and Power BI experience. Founder of NextGenTemplates, reaching 300K+ subscribers across YouTube channels. Every template is hand-built and tested before release.
Conclusion
The Cyber Law Advisory Dashboard in Power BI gives legal and compliance teams a structured way to review cyber law advisory performance without building a report from zero. Use it to monitor case volume, billable hours, high-risk matters, advisory fees, escalations, clients, regions, and consultant workload in one editable PBIX file.
Download here: Cyber Law Advisory Dashboard in Power BI.
For step-by-step Excel, Power BI, dashboard, and reporting tutorials, visit youtube.com/@PKAnExcelExpert.