The Solar Energy Dashboard in Excel is a ready-to-use Excel analytics template that tracks 6 headline KPIs across 5 interactive pages — built for solar EPC firms, rooftop installers, and renewable energy consultants who need one clear revenue-and-capacity picture without paying $49–$199 per user per month for a cloud SaaS. Setup takes under 10 minutes. Paste your installation records into the Data Sheet, click Data → Refresh All, and every pivot-driven card and chart rebuilds automatically.
🌍 Join 8,400+ teams in 40+ countries using NextGenTemplates across Excel, Google Sheets, Power BI, and HTML to replace paid SaaS tools with one-time-purchase templates.
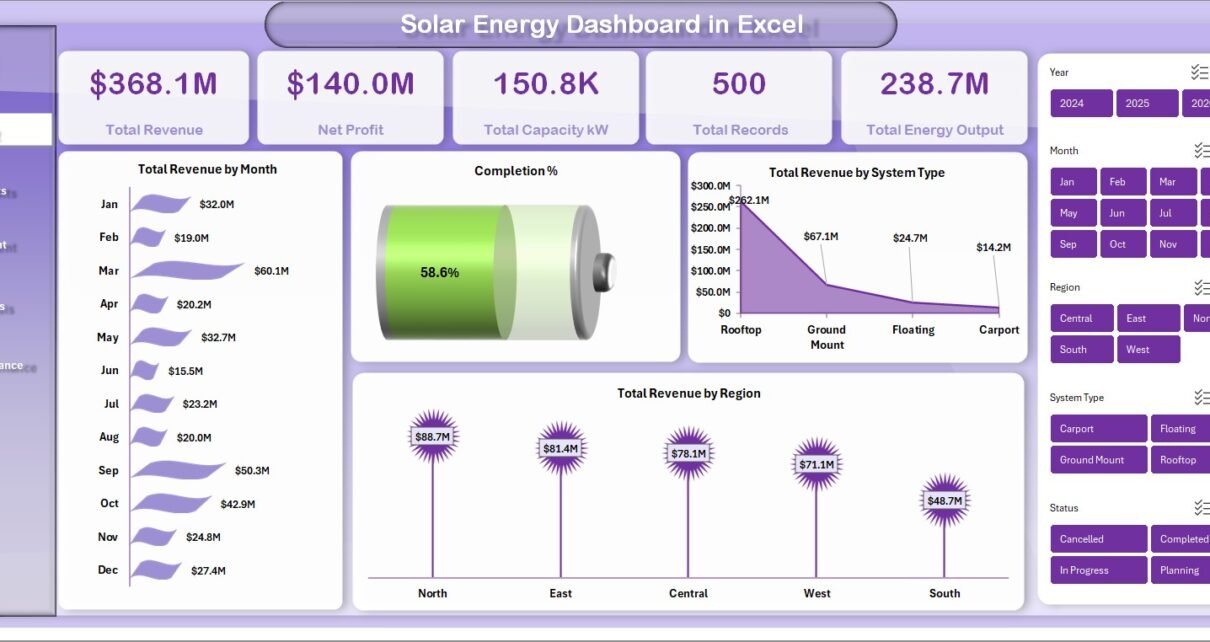
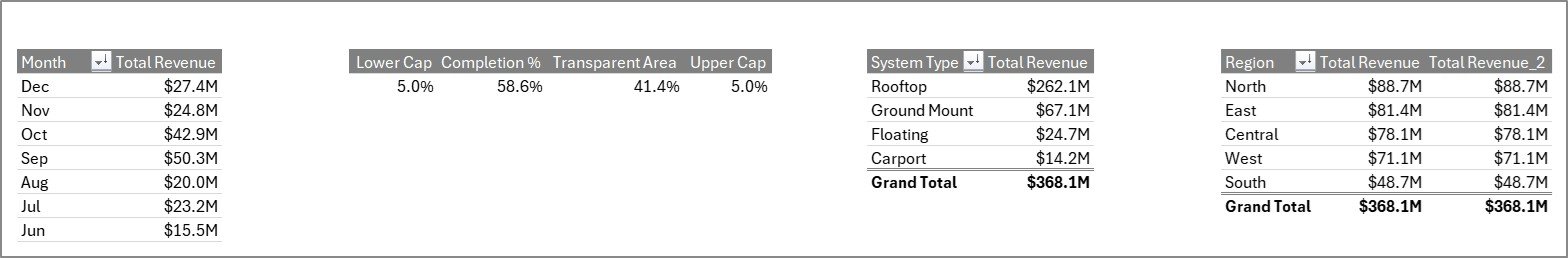
Solar Energy Dashboard in Excel — Overview page
Introduction to the Solar Energy Dashboard in Excel
Running a modern solar business is not just about selling panels — it is about tracking installed capacity in kW, revenue per installation, margin by client segment, satisfaction by panel and inverter brand, and completion % across multiple regions. Most solar EPC firms stitch this together manually across three or four spreadsheets, which costs finance and operations teams hours every single week.
The Solar Energy Dashboard in Excel replaces that manual stitching with one file. It uses native Excel pivot tables, slicers, and charts — no macros, no add-ins, no monthly subscriptions — to deliver the same decision-quality views that enterprise solar firms pay thousands of dollars per month for. According to the International Energy Agency’s Renewables 2024 report, solar PV is on track to account for 80% of global renewable capacity additions by 2030, which means the installer market is about to get a lot more competitive — and the ones who can show margin, brand performance, and regional profitability in one view will be the ones who win.
Key Features of Solar Energy Dashboard in Excel
☀️ 6 headline KPI cards on the Overview page — Total Revenue, Net Profit, Total Capacity kW, Total Records, Total Energy Output, and Completion %. Every card is wired to a pivot measure, so the numbers recalculate the instant you refresh the workbook.
📊 14 pivot-driven charts across 5 analysis pages — Overview, System Insights, Client Segment, Brand Analysis, and Regional Performance. Every chart is anchored to a hidden Support Sheet pivot, which means you never manipulate chart data manually.
🧭 Multiple slicers for interactive filtering — drill from company-wide numbers to a single region, system type, panel brand, or client segment in two clicks. Works the same way on desktop Excel, Excel for Mac, and Excel on the web.
🗂️ Structured Data Sheet with ready-to-fill columns — capacity kW, energy output, revenue, cost, profit, panel brand, inverter brand, client segment, region, satisfaction score, and completion %. Keep the column order and the whole dashboard updates with one click.
🧮 Hidden Support Sheet — every pivot that powers the dashboard lives here. Hide it in production and your stakeholders see only the polished pages.
Dashboard Pages Explanation
The Solar Energy Dashboard in Excel is organized across 5 interactive pages plus a Data Sheet and a hidden Support Sheet. Each analysis page tells a different story about your solar business.
1. Overview Page
The Overview page is the leadership view. At the top, 6 cards show Total Revenue, Net Profit, Total Capacity kW, Total Records, Total Energy Output, and Completion %. Below the cards, three trend charts show Total Revenue by Month, Total Revenue by System Type, and Total Revenue by Region — covering the “how are we trending, where is it coming from, and where is it going?” questions in one scroll.
Solar Energy Dashboard in Excel
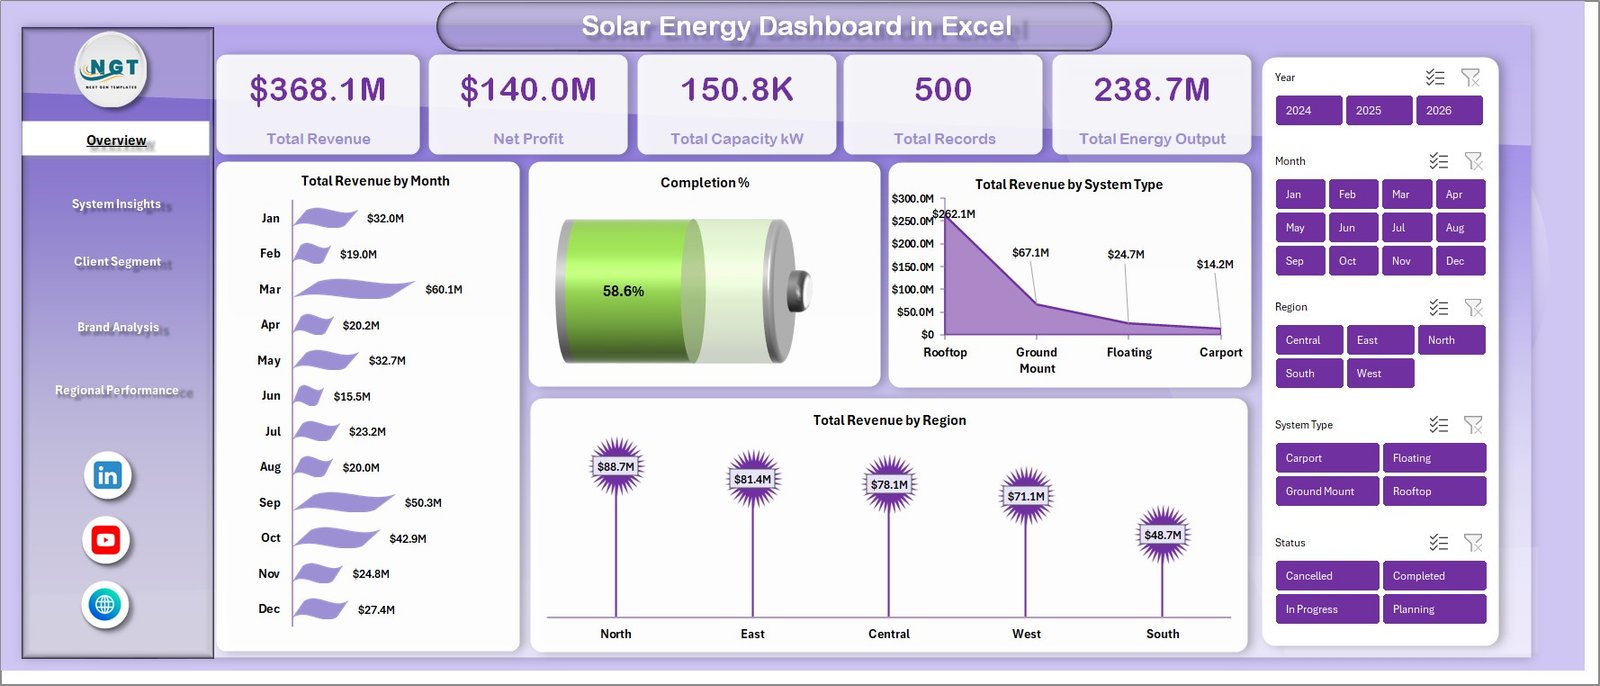
2. System Insights
The System Insights page compares how different solar system types — rooftop residential, rooftop commercial, ground-mount, carport, and utility-scale — stack up against each other. It includes Total Capacity kW by System Type, Total Revenue by System Type, Total Energy Output by System Type, and Total Records by System Type. Use this page to answer which system type you should pitch more of next quarter.
System Insights
3. Client Segment
The Client Segment page splits your business across residential, commercial, industrial, and utility buyers with Total Revenue by Client Segment, Total Capacity kW by Client Segment, Total Records by Client Segment, and Profit Margin % by Client Segment. The margin view is the piece most solar installers never build — it is the single most useful number for deciding which segment to invest sales effort into.
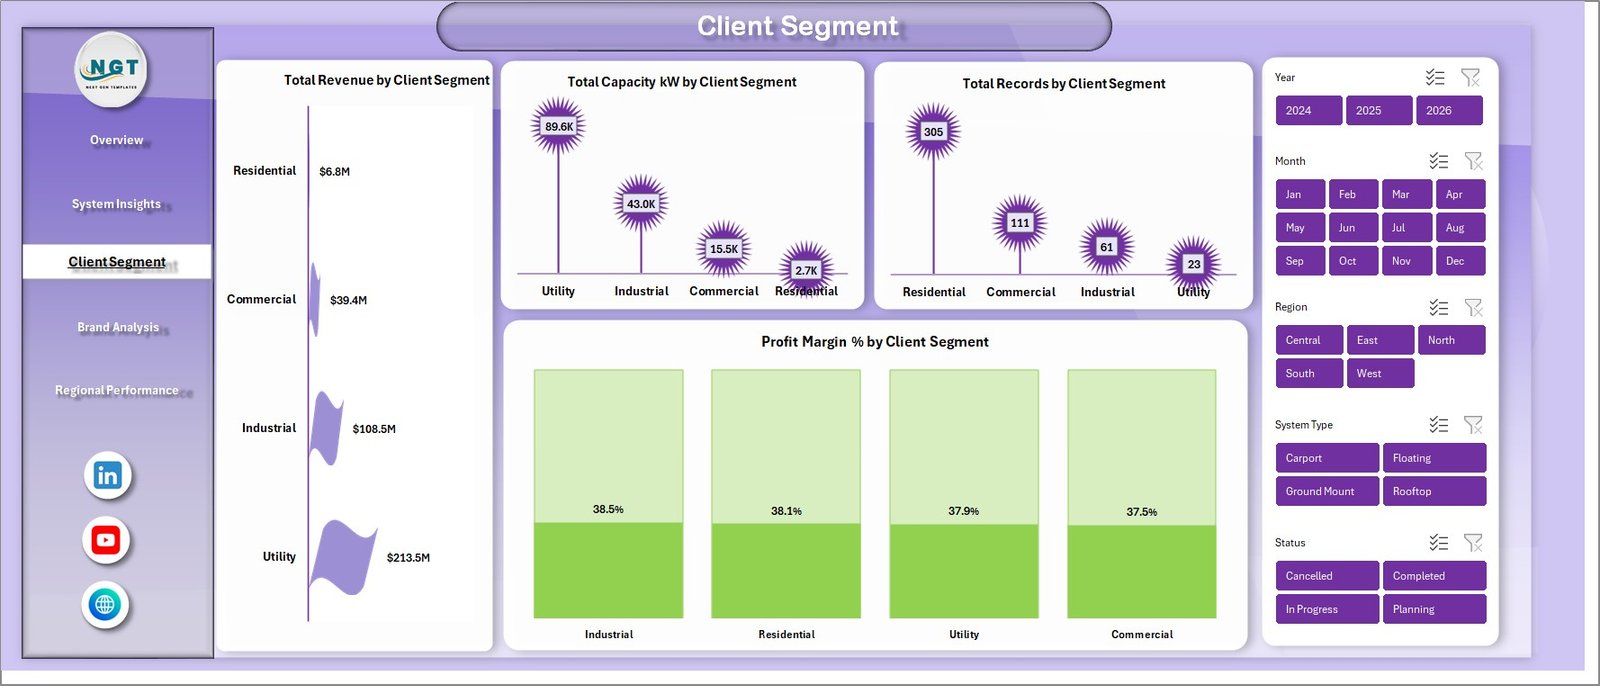
Client Segment
4. Brand Analysis
The Brand Analysis page benchmarks panel and inverter brands on Total Revenue by Panel Brand, Total Capacity kW by Panel Brand, Avg Satisfaction by Panel Brand, and Total Revenue by Inverter Brand. This is the procurement conversation your team has been avoiding — now every brand decision is backed by your own installation data instead of the last rep who visited your warehouse.
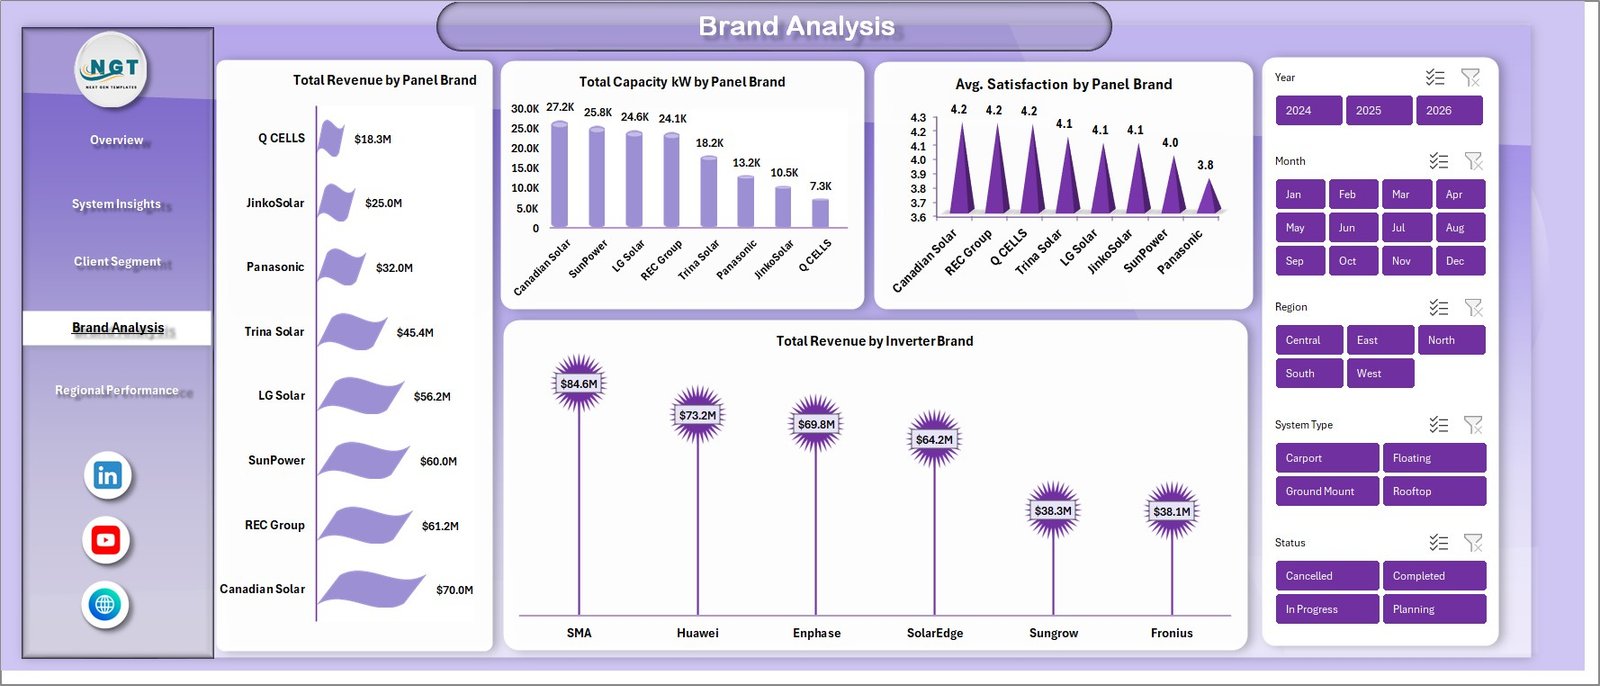
Brand Analysis
5. Regional Performance
The Regional Performance page closes the loop with Total Records by Region, Total Capacity kW by Region, and Total Revenue Vs Profit by Region. For multi-state or multi-city solar installers, this is the page that decides where to invest in the next sales hire.
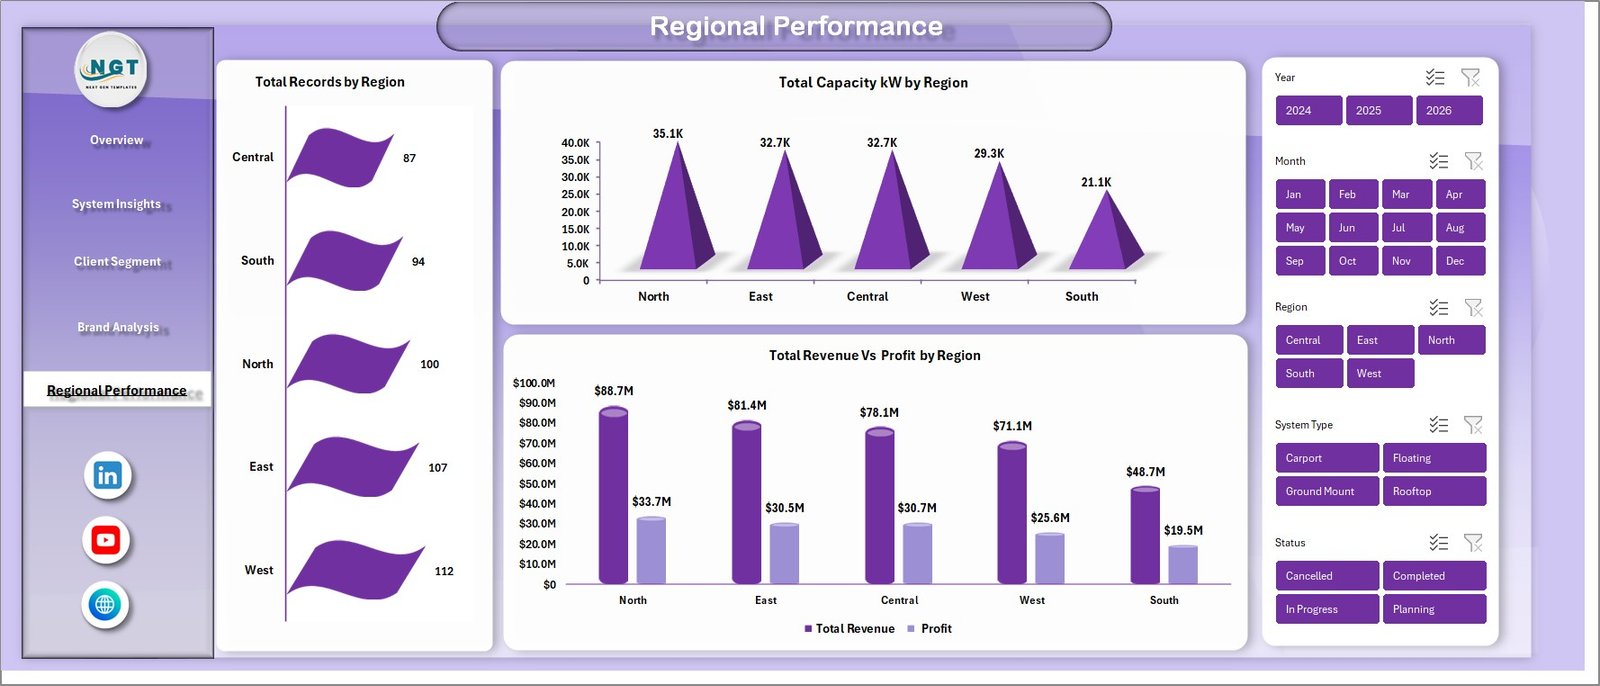
Regional Performance
6. Data Sheet
The Data Sheet is where you replace the sample records with your own data. Keep the column order intact and every page updates automatically.
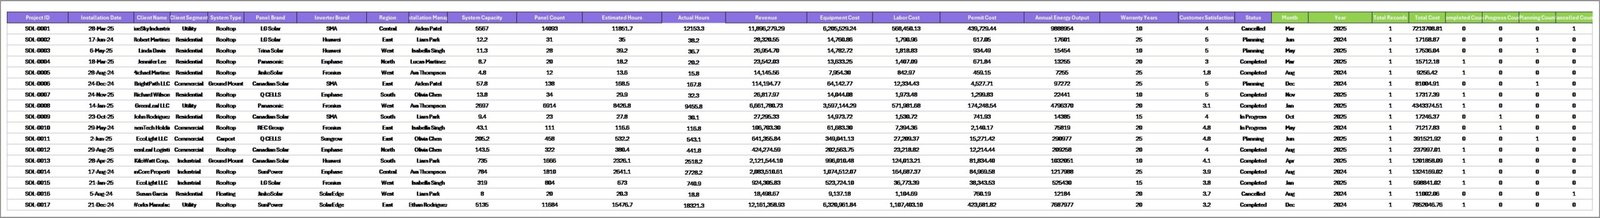
Data Sheet tab
7. Support Sheet
The Support Sheet holds every pivot table that feeds the dashboard. Hide this tab before sharing with leadership — they only need the polished pages.
Support sheet tab
Solar Energy Dashboard in Excel vs. Google Sheets Equivalent vs. Paid Solar SaaS — Feature Comparison
| Feature | Solar Energy Dashboard in Excel | Google Sheets equivalent | Paid Solar SaaS (Aurora / Scoop / OpenSolar Pro) |
|---|---|---|---|
| Cost | $17.99 one-time | $9.99–$14.99 one-time | $49–$199 / user / month |
| Platform | Microsoft Excel (desktop + web + Mac) | Google Sheets (browser only) | Cloud SaaS only |
| Setup time | Under 10 minutes | Under 15 minutes | 2–6 weeks onboarding |
| Works offline | ✅ | ❌ | ❌ |
| Share with stakeholders | ✅ Email / OneDrive / SharePoint | ✅ Share link | ✅ Paid seat per viewer |
| Customizable fields | ✅ Fully editable | ✅ Fully editable | ⚠️ Vendor-controlled |
| Per-brand / per-region analysis | ✅ Out of the box | ✅ | ⚠️ Higher tier only |
| Year-1 cost at 5 users | $17.99 | ~$14.99 | $2,940–$11,940 |
| Vendor lock-in | ❌ None | ❌ None | ✅ Export fees common |
For solar installers and EPC teams that want installation-level visibility without paying $3K–$12K a year for a SaaS tool, the Solar Energy Dashboard in Excel sits in the sweet spot.
Who Should Use This Template
Perfect for:
- Solar EPC and installation companies with 50–2,000 installations per year
- Residential rooftop solar firm owners benchmarking panel and inverter brands
- Finance and operations managers presenting monthly performance decks
- Solar consultants building a portable reporting pack across multiple clients
- Procurement teams evaluating panel and inverter brand relationships
Not a fit if:
- You need SCADA-level telemetry for utility-scale generation (use a dedicated O&M platform)
- You need PV system sizing, shading, or string layouts (use Aurora or Helioscope)
- You require SOC 2-audited cloud access with SSO and granular role permissions
Real-World Use Cases
Priya runs operations at a 40-person residential solar EPC in Arizona. Before this template, her Monday leadership email required 90 minutes of copy-pasting from three spreadsheets. Now she drops the week’s installation records into the Data Sheet, clicks Refresh All, and screenshots the Overview page straight into her email. She uses the Client Segment page to show the CEO that commercial clients delivered 38% of revenue in Q1 but only 19% of total records — a margin story no one on her team had surfaced before.
Mike is a finance controller at a commercial rooftop solar company with projects across 11 states. Each month, he drops the regional job data into the Data Sheet, refreshes, and walks the CFO through Total Revenue vs Profit by Region. The regional view surfaced a state where revenue looked healthy but profit was flat, and his team was able to renegotiate a contractor rate before year-end. He estimates the template paid for itself in the first week.
Ananya is an independent solar consultant serving four installer clients. She uses the same Excel file for each one — copies the template, drops in their data, and delivers a monthly reporting pack for a flat consulting fee. She had previously been paying $89 per seat per month for a SaaS dashboarding tool; switching to this one-time $17.99 template was the fastest margin improvement of her year.
Advantages of Solar Energy Dashboard in Excel
💰 No subscription fees. $17.99 one-time replaces a tool that would cost $2,940–$11,940 a year at 5 seats on Aurora or similar SaaS platforms.
⚡ Under 10 minutes to first value. Download, paste, refresh. No onboarding call, no vendor implementation, no 6-week rollout.
🔓 Fully customizable. Every pivot, chart, slicer, and KPI is open for editing. Change the date range, add a new metric, rename a region — it is your file.
🛡️ No vendor lock-in. Your data stays in your Excel file on your OneDrive or local drive. No export fees, no “enterprise tier” gatekeeping.
🖥️ Cross-platform. Works on Windows Excel, Excel for Mac, and Excel on the web with a Microsoft 365 subscription.
Opportunities for Improvement
In the spirit of honest reporting — and to help you decide if this template is right for your workflow — here are the areas where the Solar Energy Dashboard in Excel is not the right tool:
🔧 No real-time telemetry. If you need live inverter feeds or SCADA data streaming, this template is a reporting layer, not a monitoring platform. Pair it with your existing O&M tooling.
🔐 No built-in SSO. If your IT team mandates SSO-gated access to all analytics, a cloud SaaS is the better fit. Excel file sharing relies on OneDrive / SharePoint permissions.
📐 Not a design tool. This template reports on installations — it does not design PV systems. For string sizing, shading analysis, or proposal generation, keep using Aurora or Helioscope.
These are not “bugs” — they are scope boundaries. For 80% of solar firms looking for a clean reporting view, this template solves the problem; for the other 20%, these limitations matter.
Best Practices
📅 Refresh monthly at minimum. Drop a calendar reminder for the 1st of each month to paste the previous month’s installation records, refresh, and screenshot the Overview page for your leadership deck.
🗃️ Keep the Data Sheet column order intact. Pivots bind to column positions — if you rearrange columns, you will break the refresh chain.
🔍 Use slicers before exporting. If leadership only wants the Northeast region, filter with the slicer, then copy the page to PowerPoint or save as PDF.
🤫 Hide the Support Sheet before sharing. Right-click the tab, click Hide. Stakeholders only need the polished pages.
📚 Pair with the Energy Consumption Analysis Dashboard in Excel to show both generation and consumption in one reporting pack.
Explore Relevant Templates
🔋 Energy Consumption Analysis Dashboard in Excel — the utility-facing companion template that tracks kWh consumed rather than generated.
🌱 ESG Environmental Dashboard in Excel — pair your solar numbers with full ESG environmental reporting for investor-ready packs.
⚡ Electricity Project Dashboard in Excel — project-oriented view for grid-connected electricity work.
🛢️ Oil and Gas Analysis Dashboard in Excel — same layout pattern, tuned for fossil-fuel operators diversifying into renewables.
🌞 Renewable Energy KPI Scorecard in Google Sheets — lighter weekly scorecard view in Google Sheets.
Also available as: Renewable Energy Dashboard in Power BI.
Frequently Asked Questions
What KPIs does the Solar Energy Dashboard in Excel track?
The Solar Energy Dashboard in Excel tracks 6 headline KPIs — Total Revenue, Net Profit, Total Capacity kW, Total Records, Total Energy Output, and Completion % — plus 14 chart-level metrics covering system type, client segment, panel brand, inverter brand, and region. All metrics update automatically on Data → Refresh All.
How long does setup take?
Setup for the Solar Energy Dashboard in Excel takes under 10 minutes. Paste your installation records into the Data Sheet keeping the column order intact, click Data → Refresh All, and every KPI card, chart, and slicer updates in one pass. No macros, no coding.
Which version of Excel do I need?
The Solar Energy Dashboard in Excel runs on Microsoft Excel 2016 or later on Windows and Mac, and on Excel for the web with any Microsoft 365 subscription. It uses native pivot tables and slicers — no add-ins, no VBA, no plugins.
How does this template compare to Aurora, Scoop, or OpenSolar Pro?
Aurora, Scoop, and OpenSolar Pro are strong design and CRM tools, but they cost $49–$199 per user per month. For a team of 5, that is $2,940–$11,940 a year. The Solar Energy Dashboard in Excel is $17.99 one-time and covers the performance-reporting layer most installers actually need.
Can I customize the charts, KPIs, and slicers?
Yes. Every pivot, chart, and slicer in the Solar Energy Dashboard in Excel is fully editable. Add new metrics, rename categories, change date ranges, or extend the Data Sheet with extra columns — the template is yours to modify.
Does it work for commercial and utility-scale solar companies?
Yes. The Solar Energy Dashboard in Excel scales from residential installers up to small utility-scale operators. For very large utility-scale assets requiring SCADA-level real-time telemetry, pair this template with a dedicated O&M platform.
Will I get future updates to the template?
Yes. Every NextGenTemplates purchase includes free updates. You will receive a notification when a new version of the Solar Energy Dashboard in Excel is released.
About the Author
Built by PK — Microsoft Certified Professional with 15+ years of Excel, Google Sheets, and Power BI experience. Founder of NextGenTemplates, reaching 300K+ subscribers across YouTube channels. Every template is hand-built and tested before release.
Conclusion
If you run a solar EPC firm, a rooftop installer, a commercial solar team, or a renewable energy consulting practice, the Solar Energy Dashboard in Excel replaces a $3K–$12K-a-year SaaS reporting bill with a $17.99 one-time download. It gives you the same 6 headline KPIs, the same 14 decision-quality charts, and the same slicer-driven filtering that enterprise solar firms pay thousands for — in a file you control, on a platform your team already uses.
👉 Click here to Purchase the Solar Energy Dashboard in Excel
✅ Instant download · One-time payment · No subscription
🎥 Visit Youtube.com/@PK-AnExcelExpert for step-by-step Excel dashboard tutorials.
📅 Last updated: April 2026