The Crisis Management Firms Dashboard in Excel is a ready-to-use reporting workbook for advisory firms, reputation consultants, incident response teams, business continuity groups, and executive risk leaders who need a fast way to monitor crisis engagement performance. Many crisis teams track contract value, client cases, escalation priority, response time, resolution days, satisfaction, and revenue in separate files. That creates a reporting gap when partners need one clean view for weekly operations, client reviews, or board updates.
Click here to purchase the Crisis Management Firms Dashboard in Excel.
This Excel dashboard solves that problem with 5 analysis pages, 5 headline KPI cards, 18+ chart views, slicers, a structured Data Sheet, and a Support Sheet powered by pivot tables. Replace the sample records, click Data > Refresh All, and every card, chart, slicer, and pivot updates together. For guidance on refreshing Excel pivot tables, Microsoft explains the standard workflow in its official PivotTable refresh documentation.
Key Features of Crisis Management Firms Dashboard in Excel
Click here to purchase the Crisis Management Firms Dashboard in Excel.
- 5 KPI cards for Total Contract Value, Total Net Revenue, Total Cases, Avg. Response Hours, and Avg. Satisfaction Score.
- 5 dashboard pages covering Overview, Firm Analysis, Crisis Types, Response Metrics, and Financials.
- 18+ chart views for region, firm, crisis type, priority, status, resolution band, service line, quarter, month, year, industry, and engagement channel.
- Multiple slicers to filter the dashboard quickly without rebuilding formulas or charts.
- Data Sheet tab for structured source data in the same format as the sample records.
- Support Sheet tab with pivot tables that drive the entire dashboard dynamically.
- No macros required, so the workbook stays simple to open, edit, and share inside Microsoft Excel.
Dashboard Pages Explanation
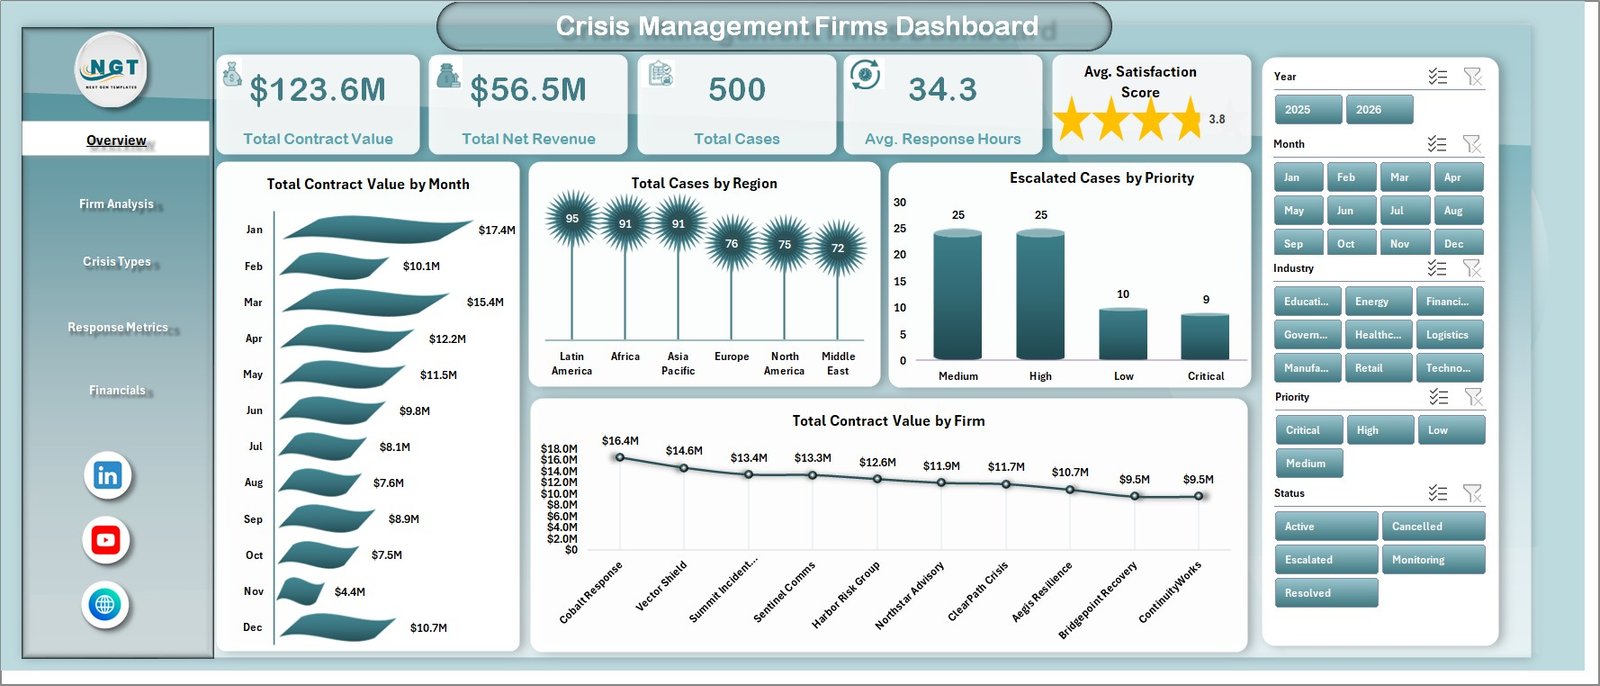
1. Overview Page
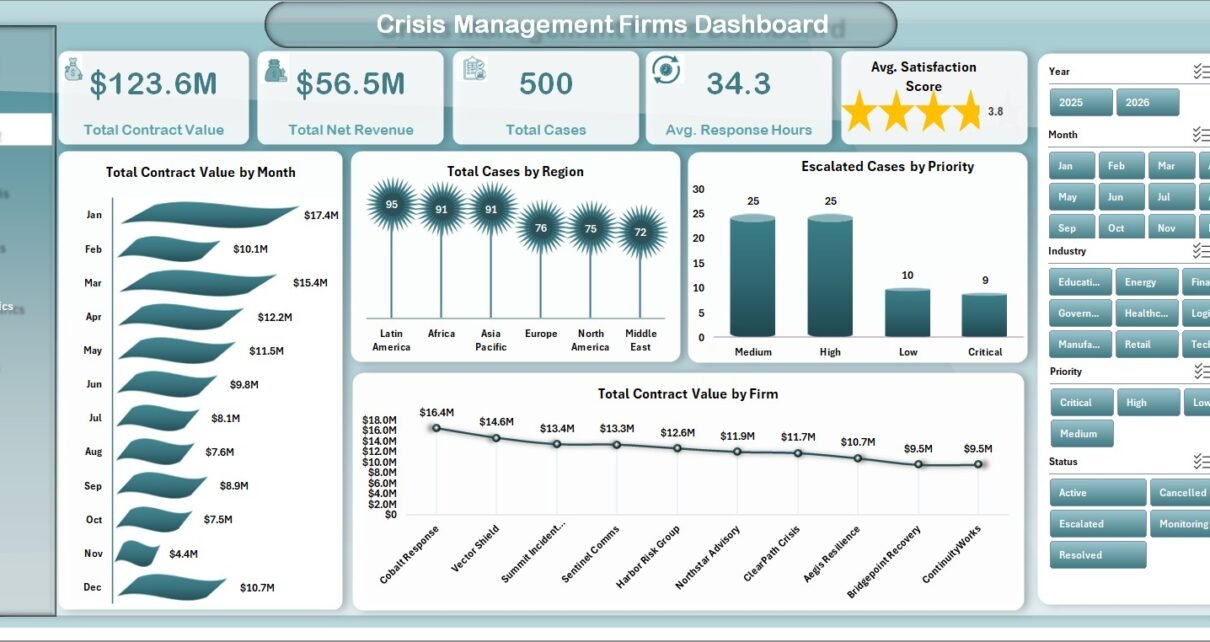
The Overview Page is the executive summary for crisis engagement performance. At the top, the dashboard displays Total Contract Value, Total Net Revenue, Total Cases, Avg. Response Hours, and Avg. Satisfaction Score so partners can review value, workload, responsiveness, and client sentiment in one place.
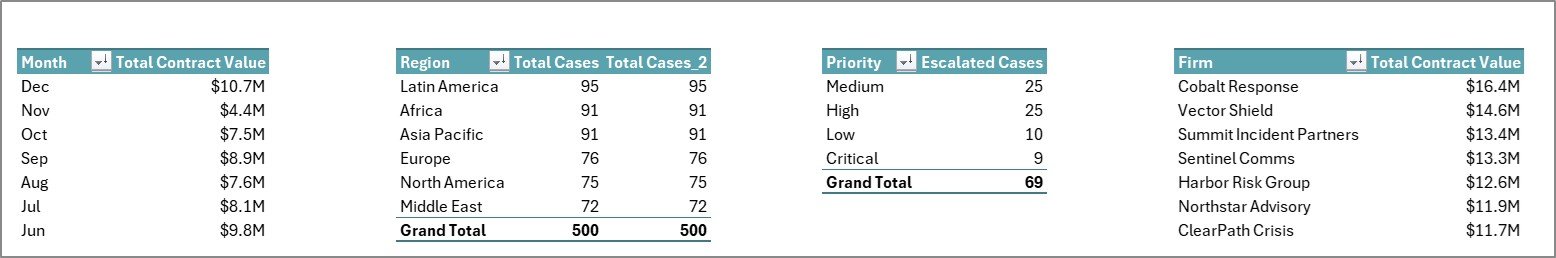
Total Contract Value by Month: This chart shows monthly movement in contract value. It helps firms identify high-demand periods and understand when crisis work is producing the most revenue.
Total Cases by Region: This view compares case volume by region. It helps management see where crisis activity is concentrated and where regional response capacity may need adjustment.
Escalated Cases by Priority: This chart shows escalated work by priority level. It helps operational leaders see whether high-priority incidents are creating pressure on the response team.
Total Contract Value by Firm: This chart compares contract value across firms or internal teams. It is useful for partner performance reviews and account planning.
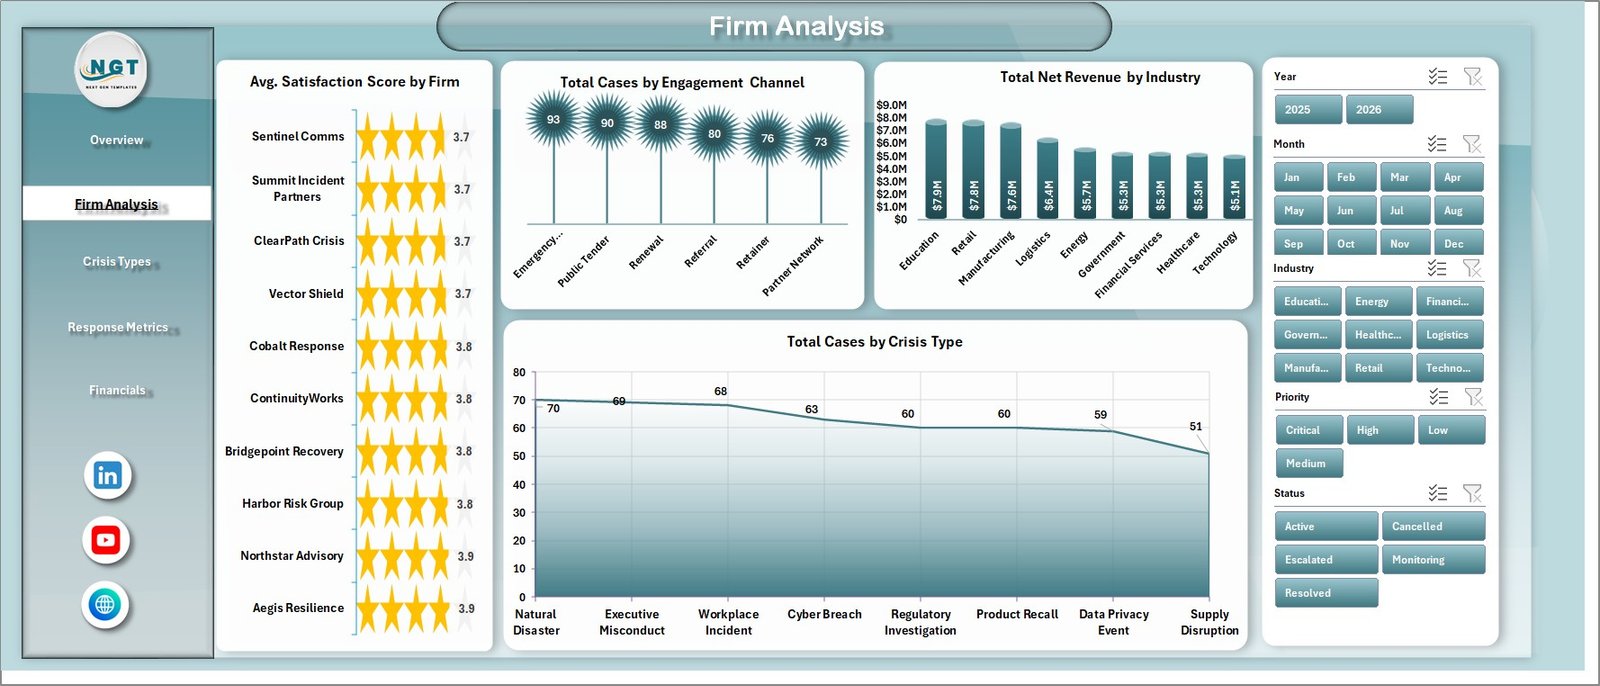
2. Firm Analysis
The Firm Analysis tab focuses on client experience, channel mix, industry revenue, and crisis portfolio shape. Avg. Satisfaction Score by Firm helps compare service quality across firms. Total Cases by Engagement Channel shows whether cases are coming from retainers, referrals, direct requests, emergency calls, or advisory programs. Total Net Revenue by Industry highlights industry contribution, and Total Cases by Crisis Type shows which crisis categories dominate the workload.
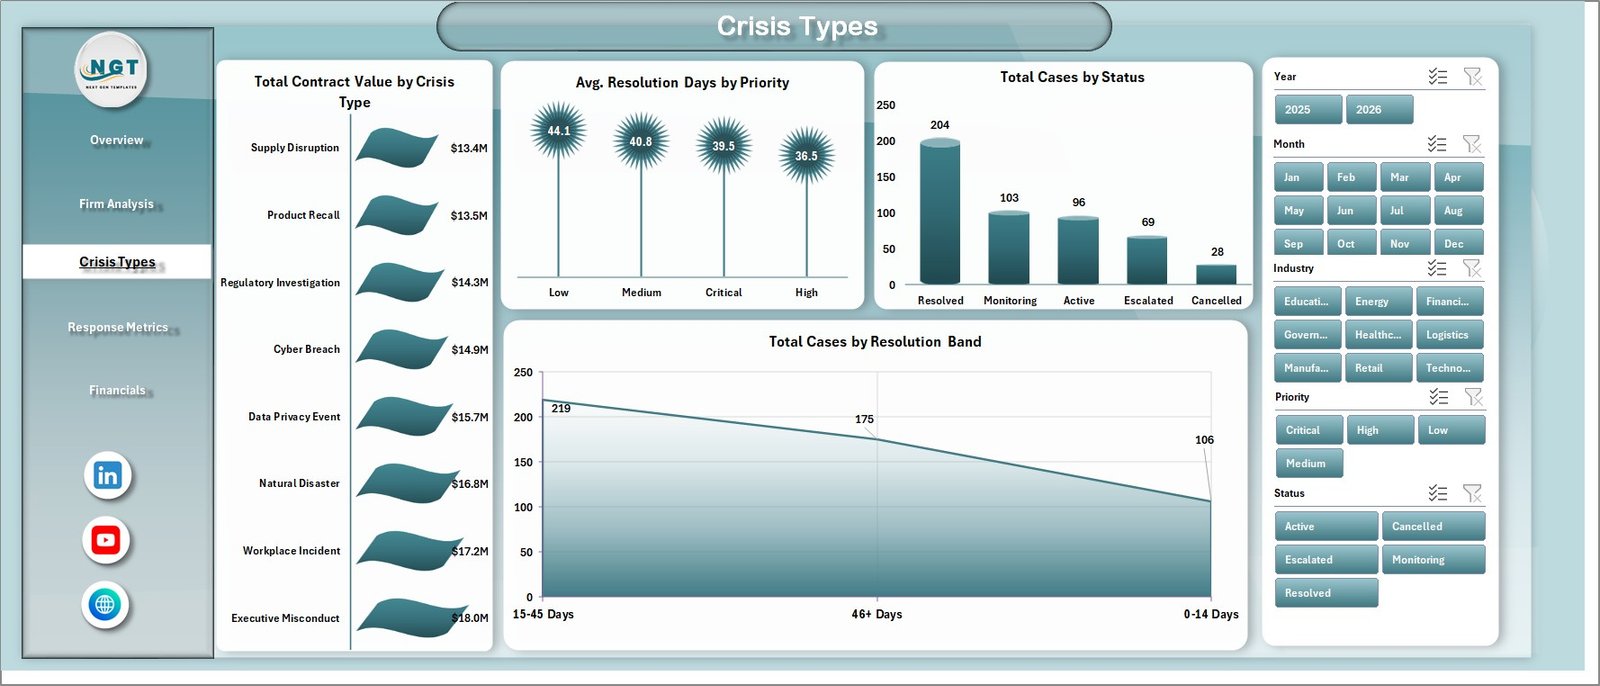
3. Crisis Types
The Crisis Types page helps teams understand case category, status, priority, and resolution patterns. Total Contract Value by Crisis Type shows which crisis categories produce the largest commercial value. Avg. Resolution Days by Priority reveals whether urgent cases are being closed fast enough. Total Cases by Status separates active, closed, pending, and escalated work, while Total Cases by Resolution Band groups cases by resolution speed.
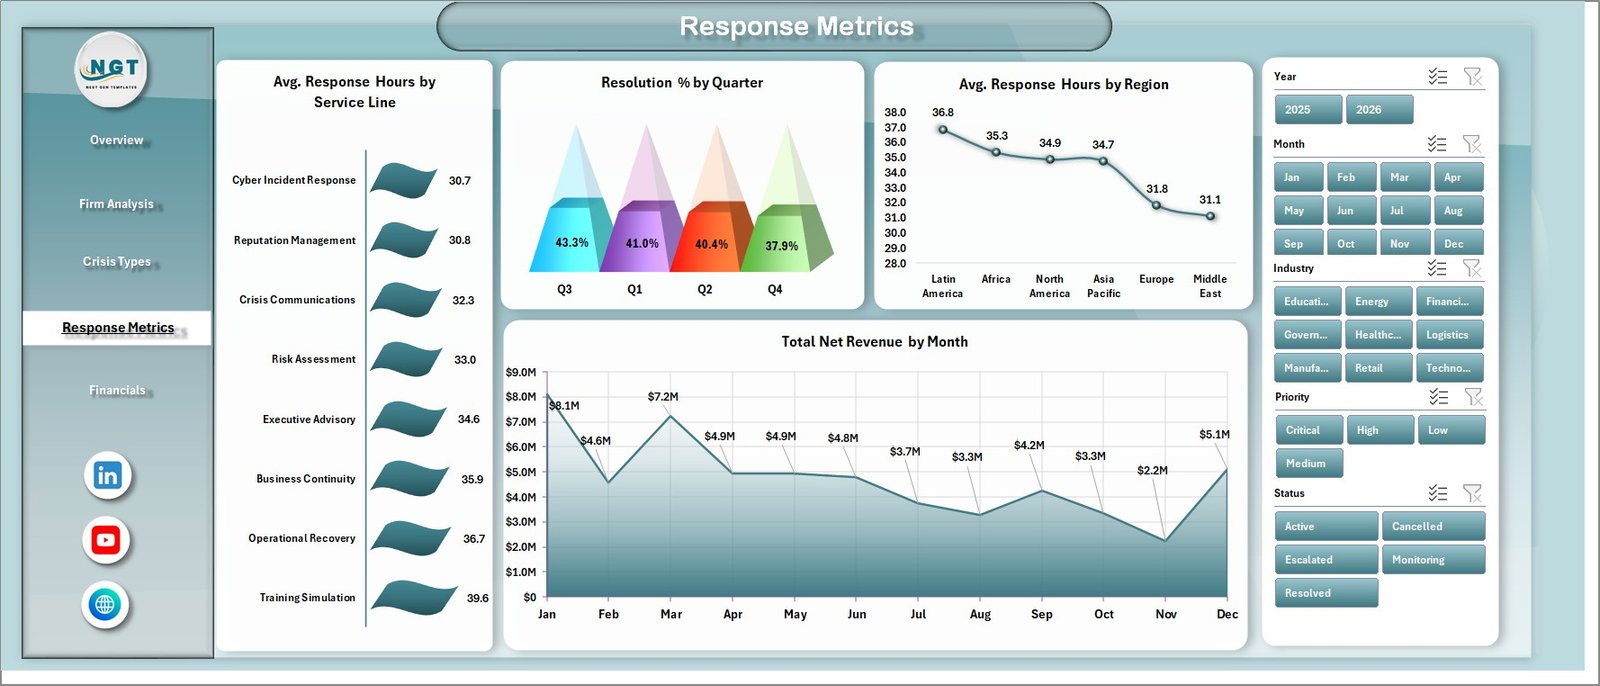
4. Response Metrics
The Response Metrics tab is built for reviewing speed, consistency, and resolution performance. Avg. Response Hours by Service Line shows which advisory services respond fastest. Resolution % by Quarter tracks closure performance over time. Avg. Response Hours by Region highlights location-based response gaps, and Total Net Revenue by Month connects response activity with financial movement.
Click here to purchase the Crisis Management Firms Dashboard in Excel.
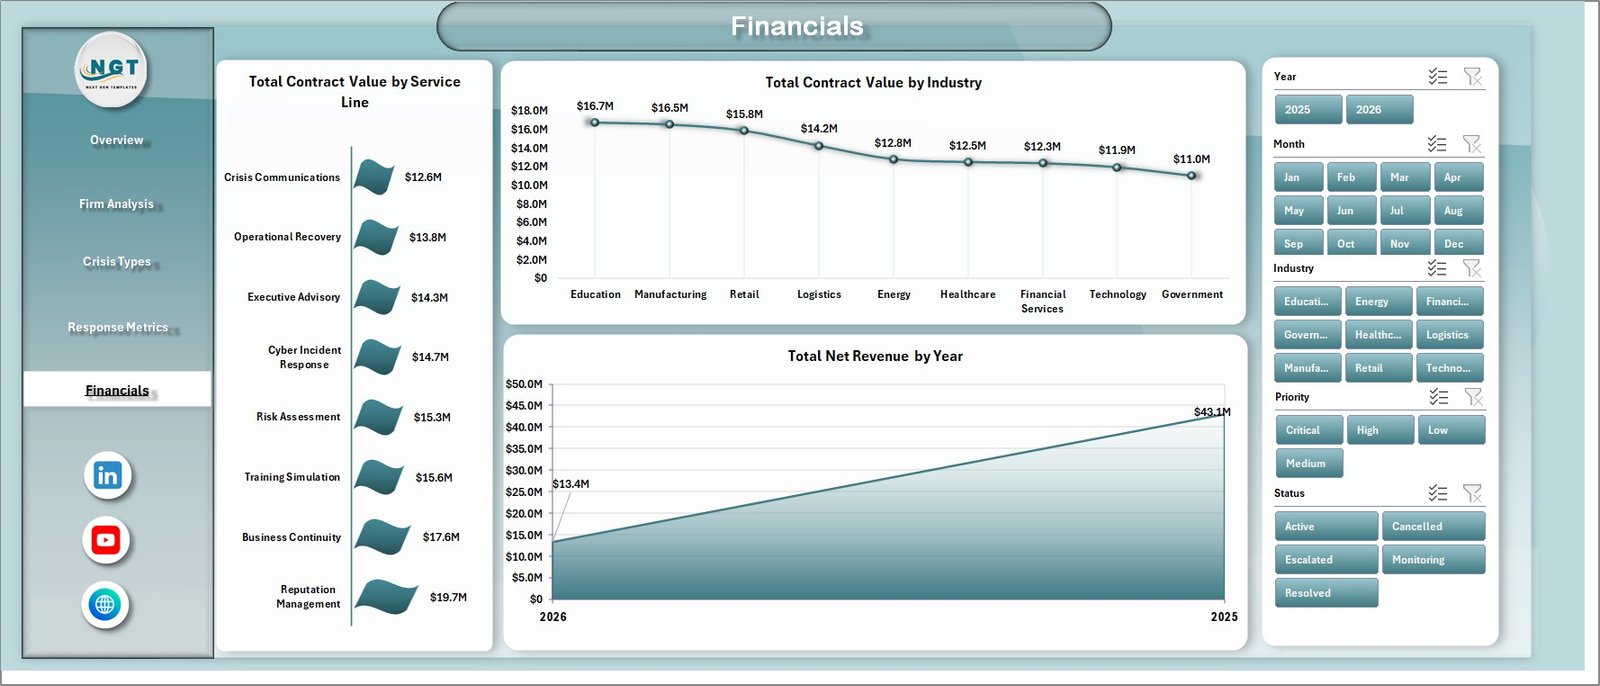
5. Financials
The Financials page gives partners and finance teams a clear view of commercial performance. Total Contract Value by Service Line shows which services generate the most value. Total Contract Value by Industry compares industry contribution, while Total Net Revenue by Year makes yearly revenue movement easy to present.
6. Data Sheet Tab
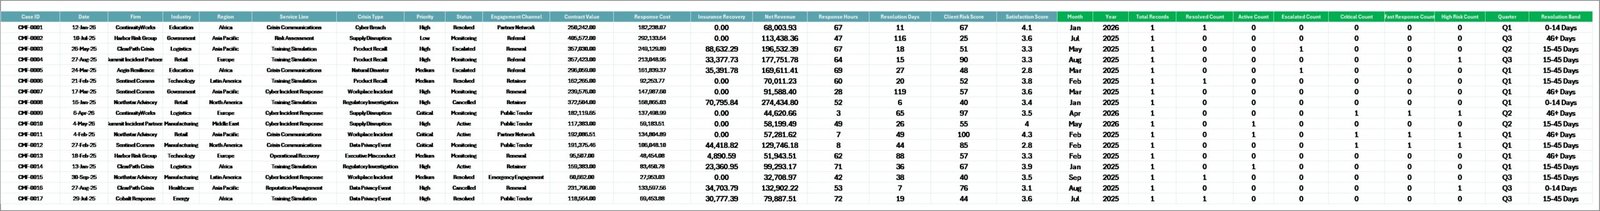
The Data Sheet is where you add your own crisis engagement data in the same format as the sample records. Once the data is updated, the dashboard can be refreshed from the Excel Ribbon.
7. Support Sheet
The Support Sheet contains the pivot tables that power the dashboard dynamically. After updating the Data Sheet, go to the Data tab in the Excel Ribbon and click Refresh All. All pivots and charts will refresh together, and the Support Sheet can be hidden for a cleaner user experience.
Crisis Management Firms Dashboard in Excel vs. Google Sheets vs. Paid CRM/SaaS – Feature Comparison
| Feature | Crisis Management Firms Dashboard in Excel | Google Sheets Alternative | Paid CRM/SaaS |
|---|---|---|---|
| Cost | $17.99 one-time | Template cost or internal build time | $50-$300+ per user/month |
| Platform | Microsoft Excel | Google Sheets in browser | Vendor cloud app |
| Setup time | Open, replace data, refresh | Copy file and configure sharing | Onboarding and permissions setup |
| Real-time team collaboration | Possible through OneDrive or SharePoint | Native Google collaboration | Usually available by seat |
| Mobile access | Limited through Excel mobile | Available through Google Sheets app | Usually available |
| Customizable fields | Fully editable workbook | Editable sheet structure | Limited by vendor settings |
| Share with link | Possible through cloud storage | Yes | Often requires login |
| Year-1 cost at 5 users | $17.99 total | Template cost or build time | $3,000-$18,000+ |
| Crisis response metrics | Included across 5 pages | Possible with manual setup | Requires configuration |
Who Should Use This Template
This dashboard is ideal for crisis management firms, reputation management consultants, corporate communications teams, legal and compliance advisors, risk management groups, business continuity teams, and executive response teams that need an Excel-based reporting layer for crisis cases.
It is especially useful when the team already has structured data but lacks a consistent way to summarize it for partners, directors, or clients. It is not meant to replace secure incident intake forms, client portals, automated alerts, evidence repositories, or full case-management software.
Real-World Use Cases
Click here to purchase the Crisis Management Firms Dashboard in Excel.
Olivia, managing partner: Olivia uses the Overview and Financials tabs before partner meetings to review total contract value, total net revenue, case volume, and service-line contribution.
Rahul, response operations lead: Rahul reviews Response Metrics every Friday to compare average response hours by service line and region. This helps him decide whether urgent crisis work needs extra staffing.
Maya, client success director: Maya uses Firm Analysis to compare satisfaction scores and engagement channels. When one firm has strong revenue but declining satisfaction, she can flag the issue before renewal discussions.
Advantages of Crisis Management Firms Dashboard in Excel
- Faster reporting: Replace manual monthly reporting with a refresh-driven dashboard.
- Better partner reviews: Combine revenue, cases, response hours, and satisfaction in one workbook.
- Flexible structure: Add new firms, industries, crisis types, regions, or service lines in the Data Sheet.
- Familiar platform: Keep the workflow inside Microsoft Excel without requiring a new SaaS login.
- Lower cost: One-time template pricing is easier for small and mid-sized advisory firms than recurring software fees.
Opportunities for Improvement
This dashboard is intentionally Excel-based, so it does not include automatic case intake, live alerts, client-facing portals, or permission-based workflows. Teams handling highly sensitive crisis data should store the file in a secure location and use internal access controls. Firms that need live collaboration, audit trails, or automated notifications may eventually pair this workbook with a dedicated CRM, ticketing system, or incident management platform.
Best Practices
- Keep the column headers in the Data Sheet unchanged for clean refresh behavior.
- Use consistent names for regions, service lines, firms, and crisis types.
- Refresh the workbook after every major data update.
- Hide the Support Sheet before sharing the workbook with non-technical users.
- Save a clean master copy before adding live client data.
- Use slicers during review meetings to quickly isolate high-priority cases or underperforming regions.
Explore Relevant Templates
Download the Crisis Management Firms Dashboard in Excel.
Emergency Management Report in Excel – incident and response reporting for emergency operations teams.
Emergency Management Dashboard in Power BI – Power BI dashboard for crisis and emergency response analytics.
Corporate Secretarial Dashboard in Excel – compliance and governance reporting in Excel.
Legal Research KPI Dashboard in Excel – legal operations KPI tracking for research teams.
Frequently Asked Questions
What does the Crisis Management Firms Dashboard in Excel track?
It tracks contract value, net revenue, total cases, average response hours, satisfaction score, firm, region, industry, engagement channel, crisis type, priority, status, resolution days, resolution band, service line, quarter, month, and year.
Do I need advanced Excel skills to use it?
No. The normal workflow is simple: paste data into the Data Sheet, click Refresh All, and use slicers. Advanced users can customize the workbook further if needed.
Can I add new crisis types or firms?
Yes. Add new values in the Data Sheet and refresh the workbook. The pivot tables, slicers, and charts will update based on the refreshed data.
Can this dashboard replace crisis case-management software?
No. It is an Excel reporting dashboard. It does not include intake forms, automated alerts, permissions, evidence storage, or client portals.
Does the workbook use macros?
No. The dashboard is based on Excel tables, pivot tables, charts, cards, and slicers, so users do not need to enable macros.
Can I hide the Support Sheet?
Yes. The Support Sheet can be hidden after setup. Keep it available for advanced edits because it contains the pivot tables that power the dashboard.
About the Author
Built by PK – Microsoft Certified Professional with 15+ years of Excel, Google Sheets, and Power BI experience. Founder of NextGenTemplates, reaching 300K+ subscribers across YouTube channels. Every template is hand-built and tested before release.
Conclusion
The Crisis Management Firms Dashboard in Excel gives crisis advisory teams a clean way to review cases, contract value, net revenue, response hours, priorities, satisfaction, crisis types, and financial trends from one workbook. Instead of rebuilding reports each month, users can update the Data Sheet, refresh the workbook, and present polished dashboard pages immediately.
Click here to purchase the Crisis Management Firms Dashboard in Excel.
Visit YouTube.com/@PK-AnExcelExpert for step-by-step Excel tutorials.
Last updated: May 2026