The Temp Staffing Dashboard in Power BI tracks 5 headline KPIs and 13 interactive charts across 5 dedicated report pages — Overview, Monthly Trend, Client Insights, Recruiter Performance, and Workforce Analysis. Setup takes under 10 minutes: open the .pbix file in Power BI Desktop, point it at your placement data, and every card, chart, and slicer refreshes automatically.
For temp staffing agency owners, branch managers, and operations leaders, this Power BI temp staffing dashboard replaces $30–$99 per user per month ATS analytics add-ons with a $17.99 one-time purchase. It works with any data source — Bullhorn export, Avionté CSV, COATS data, or a plain Excel placement sheet — and gives you fully editable DAX measures to customize every metric.
👉 Click here to Purchase the Temp Staffing Dashboard in Power BI
Key Features of the Temp Staffing Dashboard in Power BI
- 5 headline KPI cards — Total Placements, Total Bill Revenue, Total Hours Worked, Total Pay Cost, and Net Margin Amount — calculated live from your placement data.
- 13 interactive visuals covering bill revenue trends, gross margin percentage, completion rate, recruiter leaderboards, client and industry profitability, and workforce composition.
- 5 dedicated report pages — Overview, Monthly Trend, Client Insights, Recruiter Performance, and Workforce Analysis.
- Multi-level slicers on every page for filtering by region, client, industry, recruiter, worker type, skill level, and month.
- Fully editable DAX measures — add your own KPIs like “placements per recruiter per week” or “gross margin by industry per quarter” in under 5 minutes.
- Built in Power BI Desktop — runs on the free Microsoft tool, no Power BI Pro required unless you want to publish to the Power BI Service.
- Any data source — Excel, CSV, SQL Server, Bullhorn export, Avionté export, or COATS Staffing data.
Dashboard Pages Explanation
1 – Overview Page
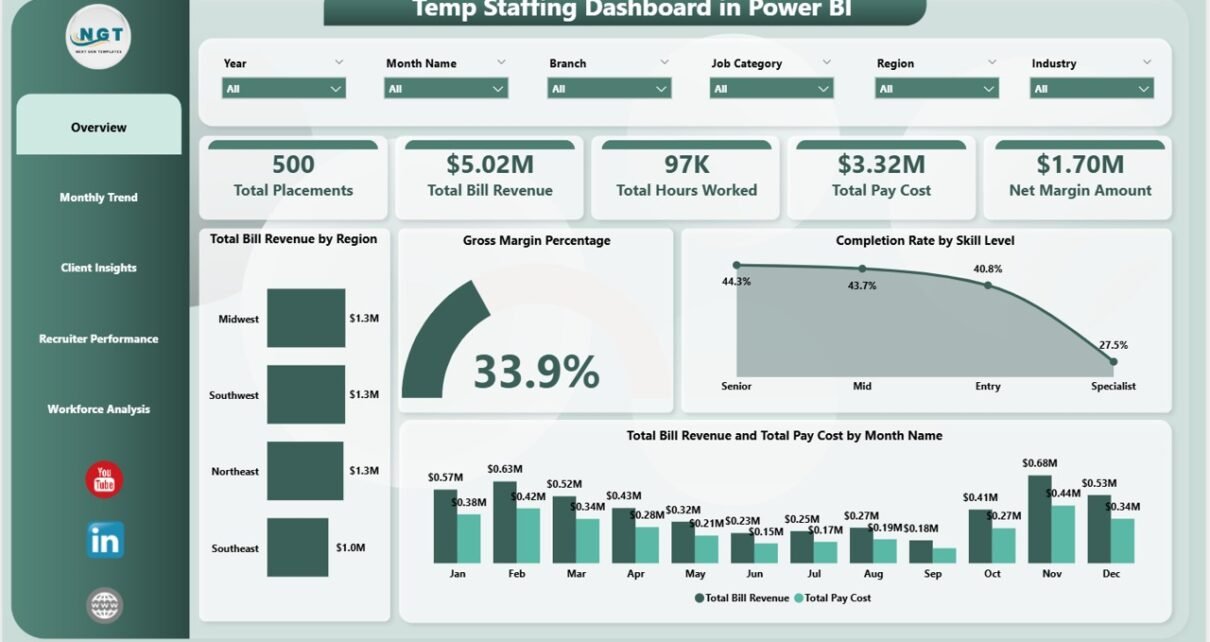
In the sheet on the top, we have the following cards to show the high-level information:
🔸 Total Placements
🔸 Total Bill Revenue
🔸 Total Hours Worked
🔸 Total Pay Cost
🔸 Net Margin Amount
We have created charts to show the analysis and multiple slicers to apply filters and see the filtered dashboard quickly. Here are the Overview page charts, each explained in 2 lines:
Total Bill Revenue by Region — Shows which regions generate the highest billable revenue across all your client engagements. Helps geographic expansion and branch investment decisions.
Gross Margin Percentage — Tracks the margin between Total Bill Revenue and Total Pay Cost. Gives instant visibility into profitability and flags when margin compression starts on specific accounts.
Completion Rate by Skill Level — Compares how often placements are completed successfully across entry, mid, and senior skill levels. Surfaces where retention is strongest and where coaching is needed.
Total Bill Revenue and Total Pay Cost by Month Name — A dual-bar view of monthly billings against monthly pay outflow. Shows seasonality and the lag between revenue and cost cycles.
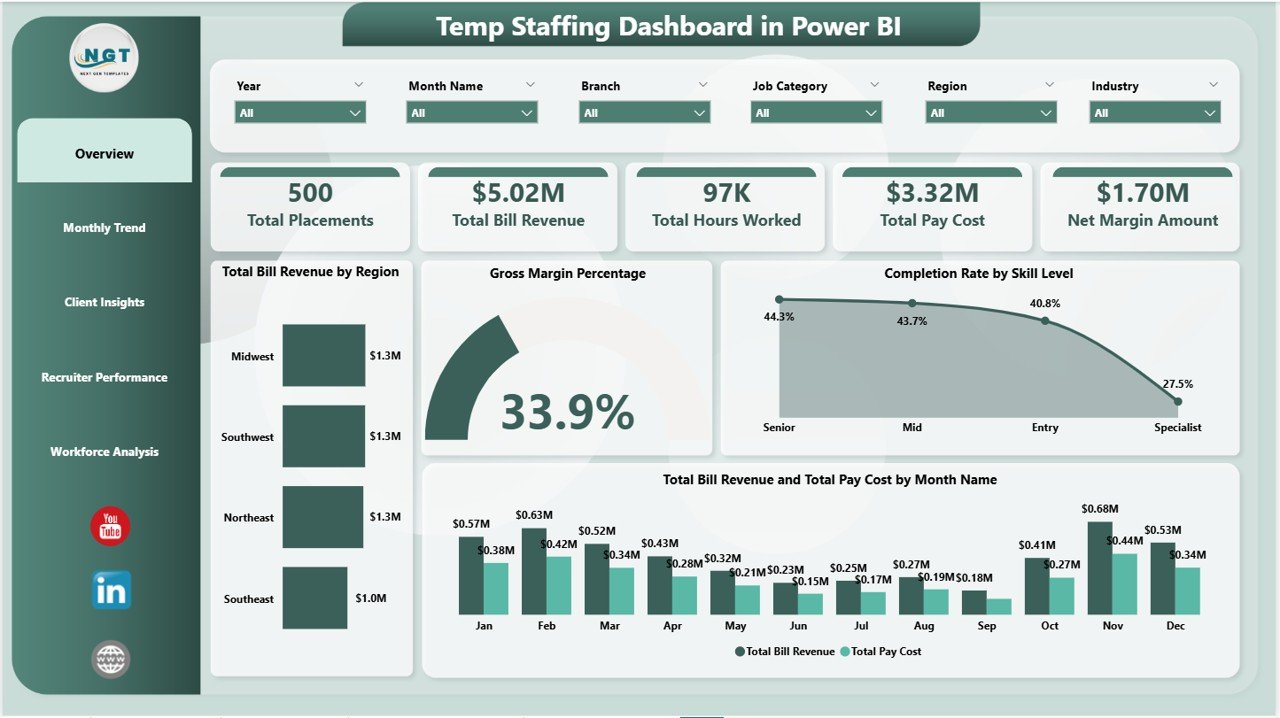
Temp Staffing Dashboard in Power BI
2 – Monthly Trend
In this sheet tab, we have created the following analyses:
Total Hours Worked by Month Name — Tracks billable hours delivered each month. Identifies capacity peaks and slow patches across the calendar year.
Completed Placements by Month Name — Shows how many placements actually ran to completion each month, not just started. The cleanest indicator of delivery quality.
Total Placements by Month Name — Counts every placement initiated each month, including in-progress and completed. Useful for sales pipeline forecasting.
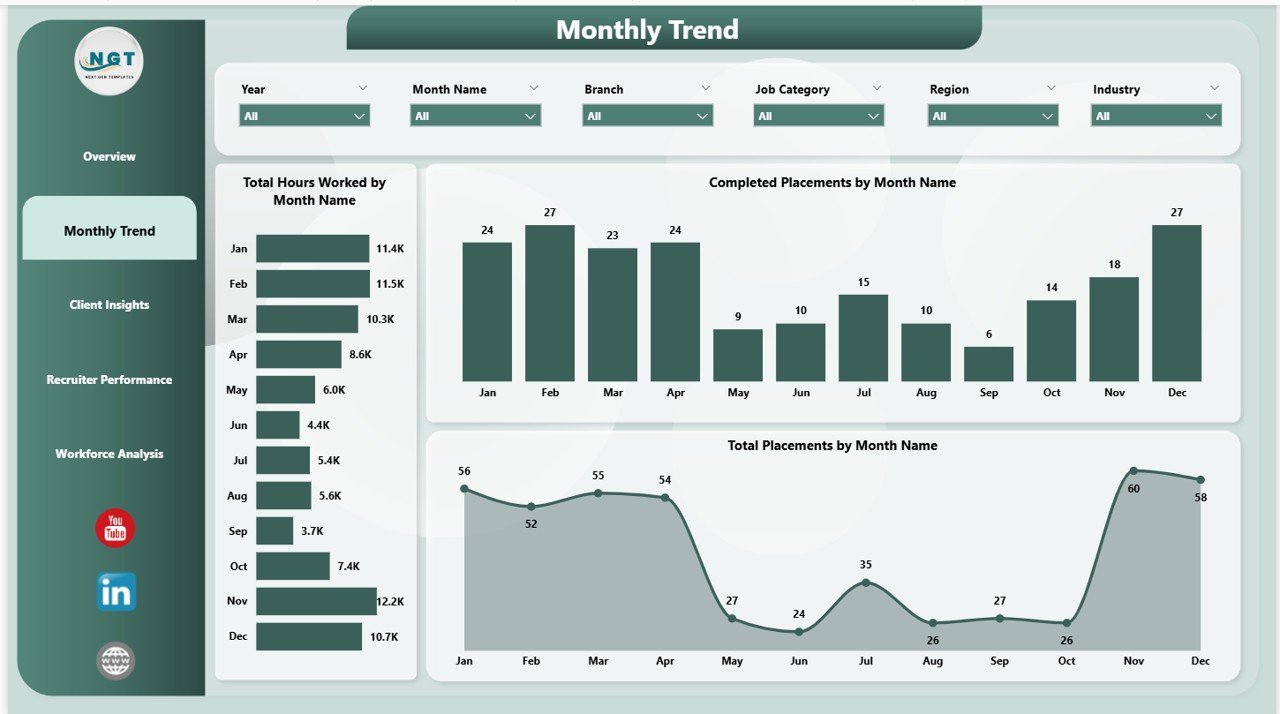
Monthly Trend
3 – Client Insights
In this sheet tab, we have created the following analyses:
Total Pay Cost by Client — Shows which client accounts drive the highest pay-cost outflow. Useful for spotting clients where your bench is heavily allocated.
Total Bill Revenue by Client — Ranks every client by billed revenue. Surfaces your most valuable accounts and the ones to protect against churn.
Total Bill Revenue by Industry — Compares revenue across verticals like healthcare, IT, light industrial, and clerical. Guides sales targeting for the next quarter.
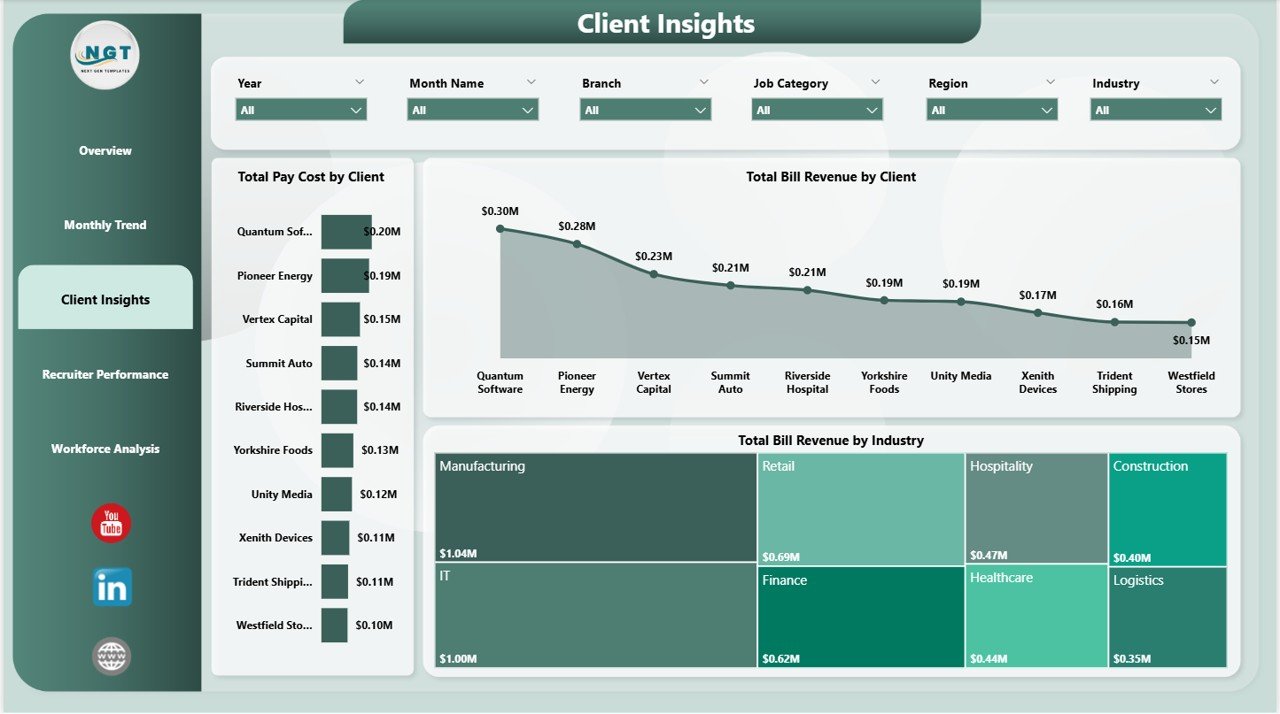
Client Insights
4 – Recruiter Performance
In this sheet tab, we have created the following analyses:
Total Placements by Recruiter — Ranks every recruiter by placement volume. The headline scoreboard for your recruiting bullpen.
Completion Rate by Recruiter — Shows what percentage of each recruiter’s placements run to completion. Volume without completion is wasted effort — this metric exposes that.
Avg Time to Fill by Recruiter — Tracks how long each recruiter takes from job order to placement. Lower is better — this is your speed-to-hire scorecard for coaching conversations.
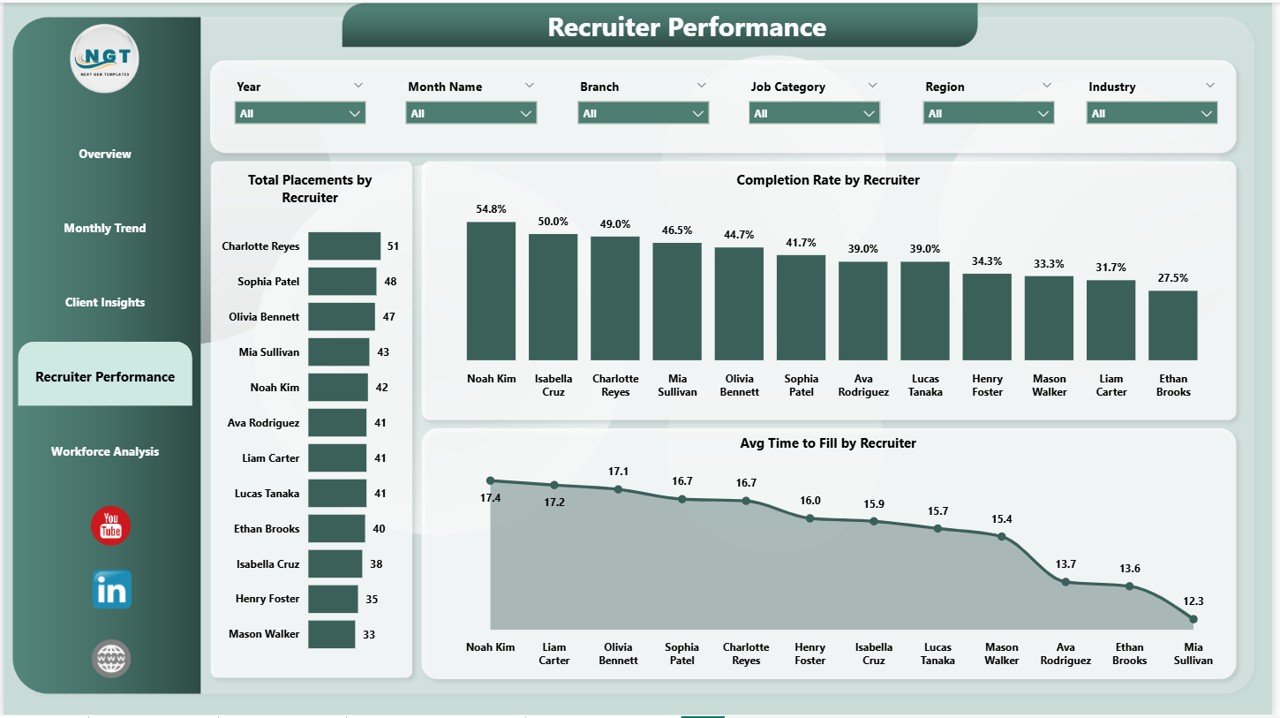
Recruiter Performance
5 – Workforce Analysis
In this sheet tab, we have created the following analyses:
Total Placements by Job Category — Shows the mix of placements across categories like administrative, IT, healthcare, light industrial, and skilled trades. Guides bench investment.
Total Placements by Worker Type — Breaks down placements by W-2, 1099, and corp-to-corp classification. Important for compliance and margin planning.
Total Bill Revenue by Skill Level — Compares billing across entry, mid, and senior skill levels. Reveals where your premium pricing lives.
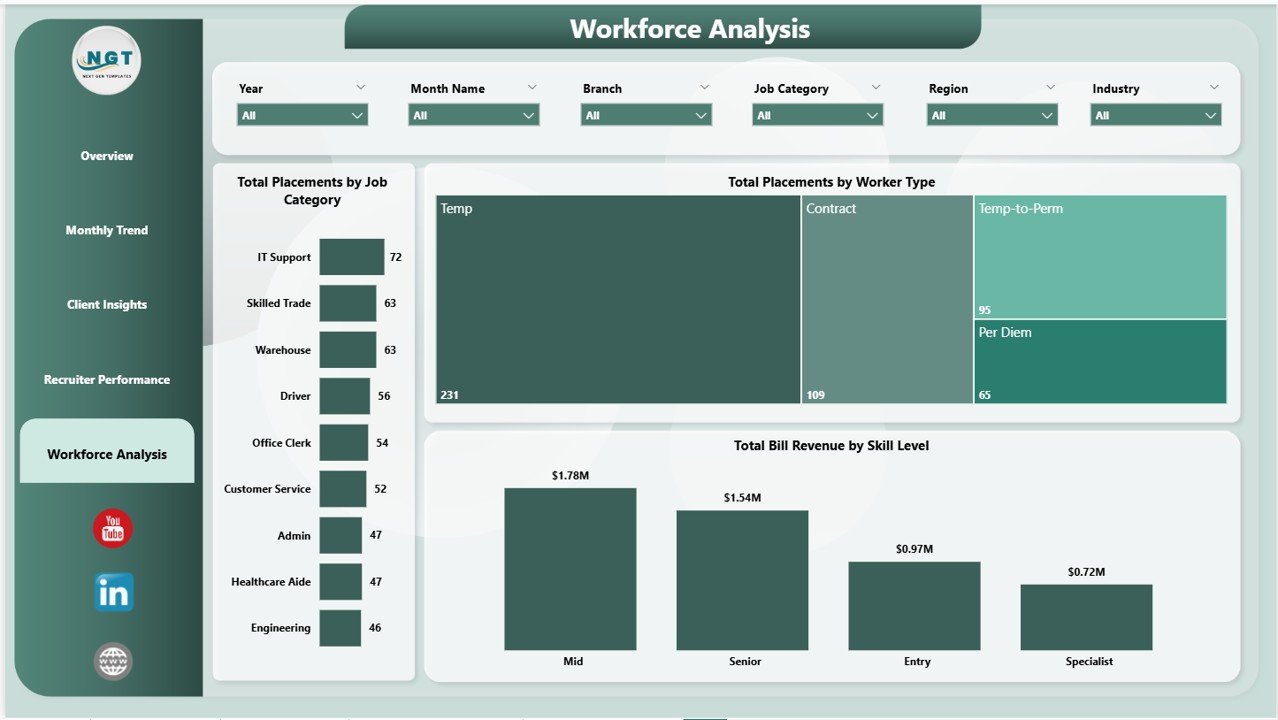
Workforce Analysis
Temp Staffing Dashboard in Power BI vs. Tableau/Qlik vs. Bullhorn/Avionté — Feature Comparison
| Feature | Temp Staffing Dashboard in Power BI | Tableau / Qlik Sense | Bullhorn / Avionté Analytics |
|---|---|---|---|
| Cost | $17.99 one-time | $70 / user / month | $30–$99 / user / month |
| Platform | Power BI Desktop (free) | Tableau / Qlik | Web-based ATS |
| Setup time | Under 10 minutes | 4–8 hours to build | 2–4 weeks onboarding |
| Pre-built temp staffing KPIs | ✅ 5 KPIs + 13 charts ready | ❌ Build from scratch | ✅ But locked to their data |
| Works with any data source | ✅ Excel, CSV, SQL | ✅ | ❌ ATS lock-in |
| Editable DAX measures | ✅ Fully customizable | ✅ (Tableau calc fields) | ❌ |
| Bill rate vs. pay cost margin tracking | ✅ Net Margin Amount KPI | Build manually | Limited |
| Year-1 cost at 5 users | $17.99 | $4,200 | $1,800–$5,940 |
| No subscription, no per-user fees | ✅ One-time only | ❌ | ❌ |
For temp staffing firms that want Bullhorn-grade analytics without the $30–$99/user/month lock-in, the Temp Staffing Dashboard in Power BI sits in the sweet spot.
Who Should Use This Template
Perfect for:
- Temp and contract staffing agency owners with 2–50 recruiters needing bill-rate vs. pay-cost visibility in one view
- Light industrial, clerical, healthcare, and IT staffing firms tracking hours worked, placements, and net margin per client
- Branch managers running weekly recruiter reviews on completion rate and time-to-fill
- Operations leaders exporting placement data from Bullhorn, Avionté, or COATS into Excel and looking for a polished dashboard layer
- Recruitment consultants reporting quarterly performance to agency leadership or external investors
Not a fit if:
- You’re an enterprise staffing firm with 500+ recruiters needing SOC 2, SSO, and pre-built row-level security
- You want a full ATS with CV parsing and email integration — this is analytics, not applicant tracking
- You’ve never opened Power BI Desktop and aren’t willing to spend 15 minutes learning the basics (Microsoft’s Power BI Desktop getting-started guide covers it)
Real-World Use Cases
Maria runs operations at a 35-recruiter light industrial staffing firm in Texas. She uses the Temp Staffing Dashboard in Power BI every Monday at 8 AM to pull up Total Bill Revenue by Region and Net Margin Amount before the leadership stand-up. When her Houston branch’s net margin dipped for two weeks in a row, the Recruiter Performance page told her exactly which recruiter’s placements were running thin on bill-pay spread. She moved that recruiter onto a coaching plan within the week — and margin recovered the next reporting cycle.
James leads a healthcare temp staffing agency in the Midwest. His monthly client reviews used to mean three days of pivoting Bullhorn exports in Excel. Now he plugs the data into the Temp Staffing Dashboard in Power BI, screenshots the Total Bill Revenue by Client and Total Bill Revenue by Industry charts, and presents directly to his C-suite in 20 minutes. He cancelled a $290/month analytics add-on after switching — that’s $3,480 back in the budget every year.
Ananya is a branch manager at an IT contract staffing firm. She uses the Workforce Analysis page to see Total Placements by Worker Type (W-2 vs. 1099 vs. corp-to-corp) and Total Bill Revenue by Skill Level. When she noticed her senior-level placements were generating 60% of revenue from 25% of placements, she shifted recruiter incentives toward higher-skill roles. Gross margin climbed two points the next quarter.
Advantages of the Temp Staffing Dashboard in Power BI
- Saves $1,800–$5,940 per year vs. an equivalent Bullhorn or Avionté analytics subscription at 5 users.
- Under 10-minute setup — open the .pbix, replace sample data, click Refresh. No IT project, no onboarding call.
- Works with any data source, so you’re not locked to a single ATS. Migrate systems and keep your dashboard.
- Editable DAX measures give you full control — add custom KPIs like “placements per recruiter per week” or “gross margin by client per quarter” in minutes.
- Bill rate vs. pay cost spread is built in. Most ATS analytics tools surface revenue OR cost separately — this dashboard tracks the spread directly via Net Margin Amount.
- Shareable via Power BI Service — one live link for your team, clients, or leadership (requires Power BI Pro).
- Lifetime access, no subscription — $17.99 one time and you own it forever across unlimited projects.
Opportunities for Improvement
No tool is perfect, and being upfront about limits helps you decide whether the Temp Staffing Dashboard in Power BI is the right fit:
- Not a replacement for a full ATS. The dashboard analyzes your placement data — it doesn’t parse CVs, send interview emails, or track candidate stages in real time. Pair it with your existing ATS.
- Timesheet collection is out of scope. The dashboard expects hours-worked data already aggregated — it doesn’t capture daily punches or approve timesheets. Use your existing payroll or timesheet system upstream.
- Row-level security is manual. Enterprise firms that need per-recruiter or per-branch data isolation will have to set up RLS themselves in Power BI Service.
- Mobile layout is adequate, not optimized. Power BI mobile renders the report, but the mobile-specific layout isn’t pre-built. You can create one in Power BI Desktop if needed.
Best Practices
- Clean your source data before loading. The dashboard is only as good as the placement table feeding it. Enforce consistent recruiter names, industry labels, and worker-type values.
- Refresh weekly at minimum. Temp staffing data goes stale fast — a weekly refresh keeps leadership conversations relevant. Use Power BI Service for scheduled refresh.
- Use slicers intentionally. Filter by region + industry + time window to spot micro-trends.
- Track bill-pay spread per client, not just per agency. Use the Client Insights page to flag accounts where margin is being squeezed before they erode total profitability.
- Publish to Power BI Service so your team has a live link instead of emailing .pbix files around.
- Pair with the Excel version if some stakeholders don’t have Power BI Desktop — the Temp Staffing Dashboard in Excel covers the same pages with pivot tables and slicers.
Explore Relevant Templates
If you liked the Temp Staffing Dashboard in Power BI, check out these related templates on NextGenTemplates:
- Staffing Agency Dashboard in Power BI — sibling Power BI dashboard focused on agency-wide recruitment metrics with Recruiter Performance, Client Analysis, Industry Insights, and Placement Pipeline pages.
- Recruitment KPI Scorecard in Excel — traffic-light scorecard format for HR leadership reviews.
- Interview Scheduling Management System V1.0 — Excel VBA tool for coordinating candidate and panel interviews.
- Candidate Application Management System V1.0 — Excel VBA system for managing the applicant pipeline.
- Browse all Power BI Dashboard Templates on NextGenTemplates.
🔄 Also available as: Temp Staffing Dashboard in Excel · Staffing Agency Dashboard in HTML.
Frequently Asked Questions
What KPIs does the Temp Staffing Dashboard in Power BI track?
The Temp Staffing Dashboard in Power BI tracks 5 headline KPIs — Total Placements, Total Bill Revenue, Total Hours Worked, Total Pay Cost, and Net Margin Amount — plus 13 supporting visuals including gross margin percentage, completion rate by skill level, revenue by month, revenue by client and industry, time-to-fill by recruiter, and placements by job category and worker type.
Do I need Power BI Pro to use this dashboard?
No. The Temp Staffing Dashboard in Power BI runs on Power BI Desktop, which Microsoft offers free. You only need Power BI Pro ($10/user/month) if you want to publish the dashboard to Power BI Service and share it with colleagues via a live link.
How does this compare to Bullhorn or Avionté analytics?
Bullhorn and Avionté cost $30–$99 per user per month and keep your data locked inside their ATS. The Temp Staffing Dashboard in Power BI is a $17.99 one-time purchase, works with any data source, and gives you fully editable DAX measures — no per-user fees, ever. At 5 users, that’s a first-year saving of $1,800–$5,940.
How long does setup take?
Under 10 minutes for most users. Open the .pbix file in Power BI Desktop, replace the sample placement table with your own data (same column structure), and click Refresh. All 5 pages and 13 visuals update automatically from the new data.
What data format does the Temp Staffing Dashboard in Power BI expect?
The dashboard expects one placements table with columns like Placement Date, Recruiter, Client, Industry, Region, Worker Type, Skill Level, Job Category, Hours Worked, Bill Rate, Pay Rate, and Status. Column mapping details are documented inside the .pbix file’s Power Query Editor.
Can I add my own custom KPIs and charts?
Yes. Every DAX measure, chart, and slicer in the Temp Staffing Dashboard in Power BI is fully editable. Add new measures, duplicate visuals, rebrand the color palette, or rearrange pages to match your agency’s reporting style. See the Microsoft DAX reference if you need measure syntax help.
Is this a one-time purchase or a subscription?
One-time purchase. $17.99 gets you lifetime access to the Temp Staffing Dashboard in Power BI with no recurring fees, no per-user charges, and no subscription renewals. Download once, use forever across unlimited projects.
About the Author
Built by PK — Microsoft Certified Professional with 15+ years of Excel, Google Sheets, and Power BI experience. Founder of NextGenTemplates, reaching 300K+ subscribers across YouTube channels. Every template is hand-built and tested before release.
Conclusion
The Temp Staffing Dashboard in Power BI gives temp staffing agency owners, branch managers, and operations leaders a complete view of placements, bill revenue, hours worked, pay cost, and net margin — for a $17.99 one-time purchase instead of $30–$99 per user per month.
👉 Click here to Purchase the Temp Staffing Dashboard in Power BI
✅ Instant download · One-time payment · No subscription
🎥 Visit Youtube.com/@PK-AnExcelExpert for step-by-step video tutorials on Power BI dashboards, DAX, and Excel analytics.
📅 Last updated: May 2026