Security companies that rely on manual spreadsheets spend an estimated 6–10 hours per month building reports that a connected Power BI dashboard can generate in under 15 minutes. The Security Company Dashboard in Power BI delivers 5 executive KPI cards, 12+ pre-built charts, and interactive slicers across 5 purpose-built pages — covering everything from guard deployment and profit margins to SLA compliance and client-level revenue analysis. For a one-time cost of $17.99, it replaces tools that charge $50–100+/user/month.
✅ Click here to Purchase the Security Company Dashboard in Power BI
Instant download · One-time payment · No subscription · Lifetime access
Key Features of Security Company Dashboard in Power BI
The Security Company Dashboard in Power BI is built around the five reporting areas that security company managers and finance leads request most often. Here is what each page delivers:
- 5 Executive KPI Cards — Total Staff Cost, Total Guards Deployed, Total Service Revenue, Net Profit, and Total Contracts give leadership a full business snapshot the moment the dashboard opens.
- Profit Margin Analysis by Region — The Profit Margin by Region chart and the overall Profit Margin visual on the Overview page make it immediately visible which territories are over- or under-performing.
- SLA & Incident Tracking — Three metrics on the Incident & SLA page (SLA Compliance by Region, Avg Response Time by Priority, Avg Response Time by Incident Type) give compliance teams the data they need to satisfy client contracts and prepare for audits.
- Revenue Trend Analysis — Monthly and quarterly revenue breakdowns help finance leads spot seasonal demand patterns and cost anomalies before they affect quarterly targets.
- Operations & Branch Profitability — The Operations page breaks down Net Profit by Branch Office and Total Contracts by Shift so managers can quickly compare location performance and identify high-cost staffing patterns.
- Client Insights — SLA Compliance by Client Type and Net Profit by Contract Type on the Client Insights page give account managers the facts needed for pricing discussions and contract renewals.
- Interactive Slicers — Filter by region, contract type, branch office, and shift across every page for instant drill-down without rebuilding reports.
Dashboard Pages Explanation
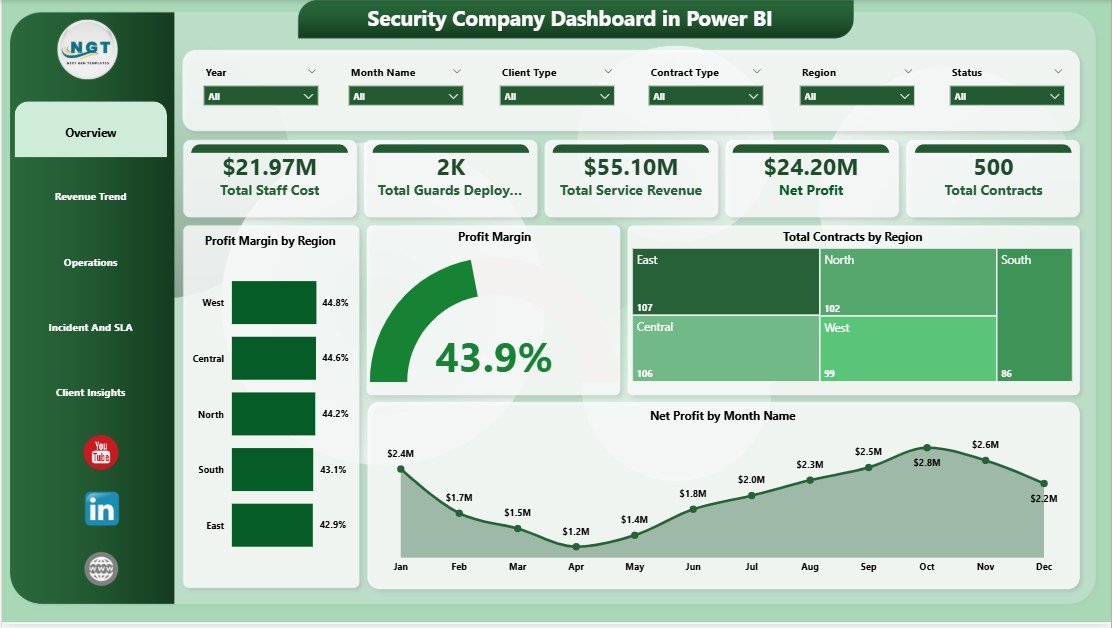
Page 1 — Overview
The Overview page is designed for executive-level reporting. Five KPI cards at the top of the page display Total Staff Cost, Total Guards Deployed, Total Service Revenue, Net Profit, and Total Contracts — giving any manager or director the high-level business picture at a glance. Below the cards, four charts deepen the analysis: Profit Margin by Region highlights geographic performance gaps, Profit Margin shows overall margin trends, Total Contracts by Region visualizes workload distribution, and Net Profit by Month Name reveals seasonal profit patterns across the year. Slicers let users filter the entire page by region, contract type, and time period within seconds.
Security Company Dashboard in Power BI – Overview Page
Page 2 — Revenue Trend
The Revenue Trend page is built for finance leads who need to understand where revenue is coming from and how it evolves over time. Total Contracts by Contract Type breaks down the revenue mix — showing whether recurring contracts, project-based contracts, or patrol-only agreements drive the most volume. Total Equipment Cost by Quarter flags capital and operational expenditure spikes, making quarterly budget planning more data-driven. Avg Revenue Per Contract by Month Name shows how the per-contract average shifts seasonally, which helps finance teams model annual revenue projections with more accuracy. According to Microsoft’s Power BI documentation, connecting live Excel or CSV data sources to these visuals enables automatic refresh so the revenue trend always reflects the latest records.
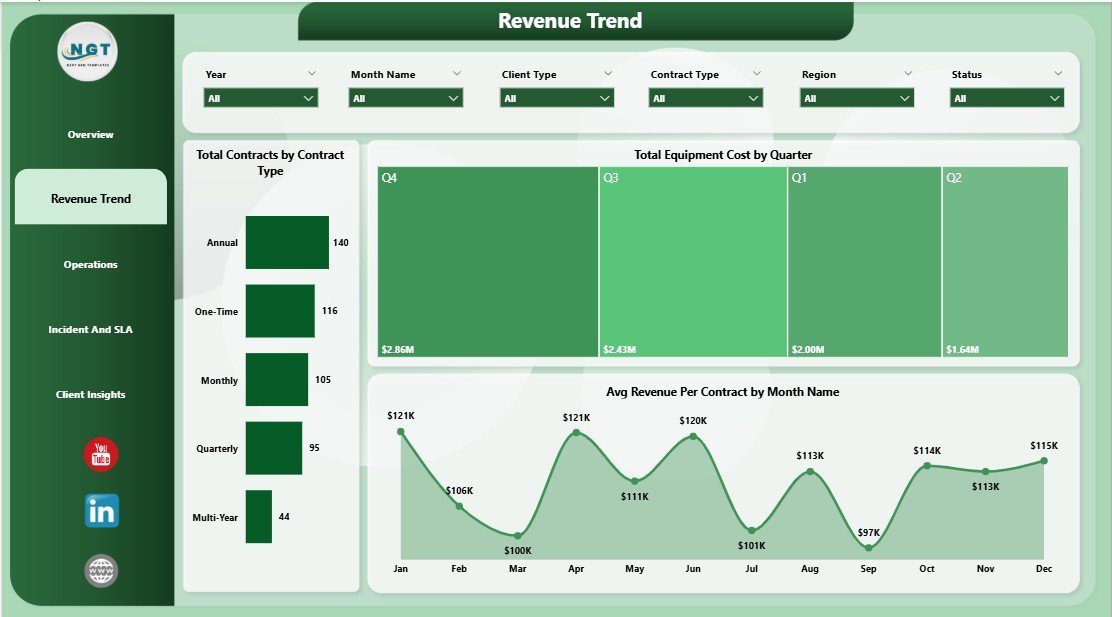
Security Company Dashboard in Power BI – Revenue Trend Page
Page 3 — Operations
Operations managers at security companies often struggle to identify which branch offices and which shifts generate the most or least profit. The Operations page solves this directly. Total Service Revenue by Equipment Used shows whether armed patrols, CCTV monitoring, or other service types generate the highest revenue per deployment. Net Profit by Branch Office ranks every location by profitability so regional managers can benchmark against each other. Total Contracts by Shift breaks down whether day, night, or 24-hour contracts make up the majority of the workload — valuable for shift scheduling and overtime cost control. All three visuals work together with shared slicers for an integrated operational view.
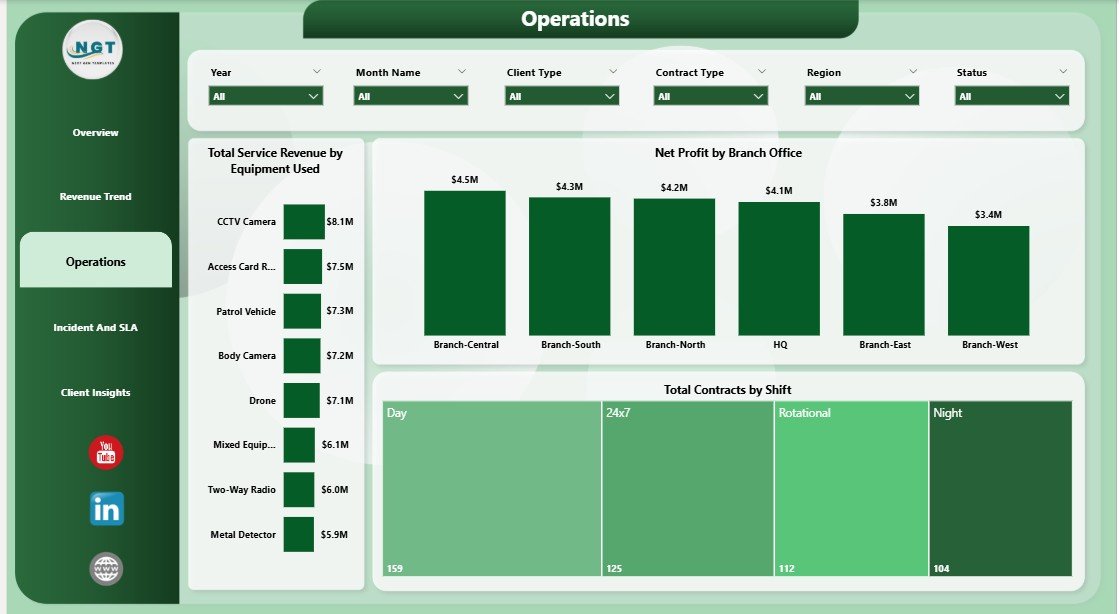
Security Company Dashboard in Power BI – Operations Page
Page 4 — Incident & SLA
Meeting SLA targets is a contractual requirement for most security companies, and failing to track them in real time leads to client disputes and contract losses. The Incident & SLA page addresses this with three focused visuals. SLA Compliance by Region shows which territories are meeting their response time commitments and which are falling short — allowing operations leaders to reallocate resources proactively. Avg Response Time by Priority breaks down response times for high-, medium-, and low-priority incidents to verify that critical calls are always handled within contract thresholds. Avg Response Time by Incident Type provides the granularity needed to identify specific incident categories (such as alarm activations or trespass reports) that consistently exceed response time targets. Together these three charts give compliance and operations teams the audit-ready data they need.
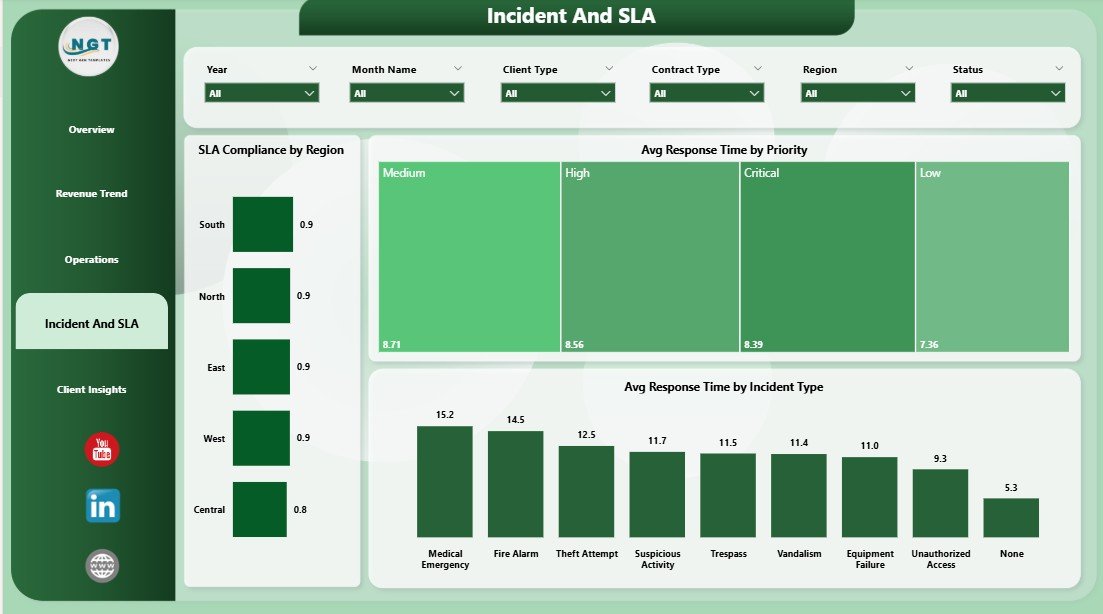
Security Company Dashboard in Power BI – Incident & SLA Page
Page 5 — Client Insights
The Client Insights page is the most account-management-focused section of the dashboard. SLA Compliance by Client Type segments performance by client category — corporate, residential, government, or retail — so account managers can see which client segments are at risk of SLA breach before renewal conversations. Net Profit by Contract Type reveals which deal structures (annual, monthly, project-based) are the most profitable, supporting smarter pricing decisions. Total Service Revenue by Month Name provides a client-level revenue timeline to compare growth or decline across client categories month over month. This page is particularly useful in the 30 days before major contract renewals.
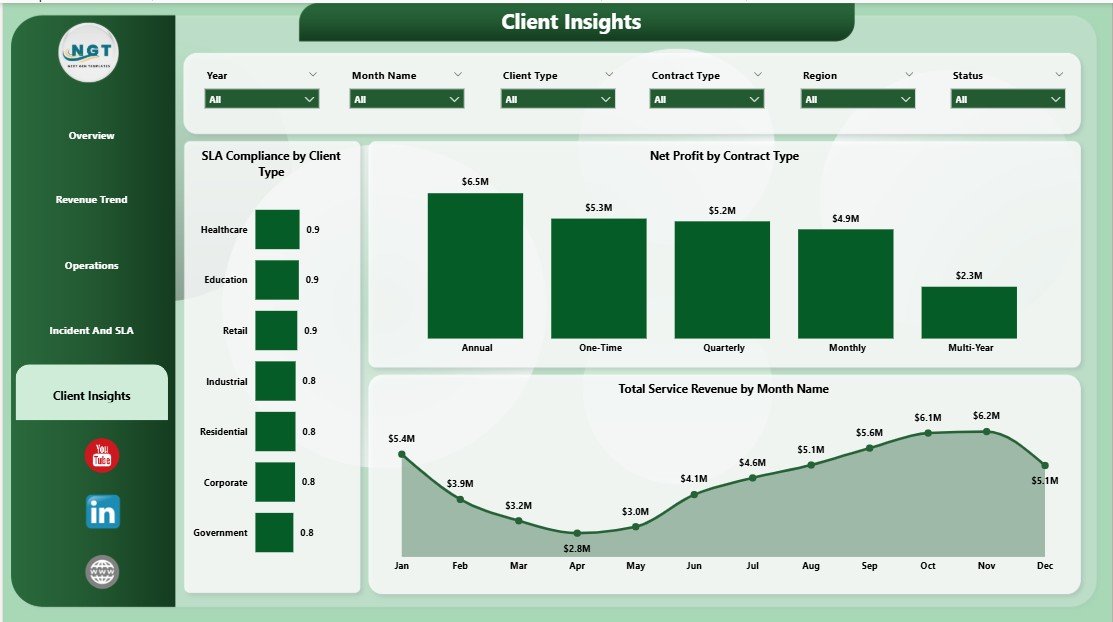
Security Company Dashboard in Power BI – Client Insights Page
Security Company Dashboard in Power BI vs. Tableau vs. Trackforce Valiant — Feature Comparison
| Feature | Security Company Dashboard in Power BI | Tableau Desktop | Trackforce Valiant |
|---|---|---|---|
| Cost | $17.99 one-time ✅ | $70/user/month | $50–100+/user/month |
| Platform | Power BI Desktop (free) ✅ | Requires Tableau license | Cloud SaaS |
| Security-specific KPI pages | 5 pages ✅ | Build from scratch | Partial |
| SLA & Incident tracking | Built-in ✅ | Custom build required | ✅ Advanced |
| Profit Margin by Region | Built-in ✅ | Custom build required | ❌ Not included |
| Client Insights page | Built-in ✅ | Custom build required | Limited |
| Customizable fields | Full Power BI flexibility ✅ | ✅ | Limited |
| Year-1 cost (5 users) | $17.99 total ✅ | $4,200 | $3,000–6,000 |
For security companies that want clear financial KPI visibility across revenue, operations, and SLA without paying $50–100+/user/month, the Security Company Dashboard in Power BI is the most cost-effective one-time solution.
Who Should Use This Template
Perfect for:
- Security company owners managing 10–500+ guards who need monthly business performance reporting
- Finance directors tracking staff costs, equipment expenses, and profit margins across multiple regions
- Operations managers comparing branch profitability and monitoring shift-level contract data
- Compliance teams preparing SLA audit reports and monitoring incident response time against contractual obligations
- Account managers preparing client review presentations and contract renewal data packages
Not a fit if:
- You need real-time IoT guard-tracking integrations or SOC-2 security compliance tooling
- Your team doesn’t have access to a Windows or Mac computer to run free Power BI Desktop
- You need live streaming data from access-control hardware rather than periodic data refresh
Real-World Use Cases
Marcus manages operations for a 120-guard regional security firm. Every Monday he opens the Security Company Dashboard in Power BI, filters by branch office, and reviews the Net Profit by Branch Office chart to find which location underperformed last week — without waiting two days for a manual accounting report. The slicers let him drill into a single region in one click and immediately see whether the issue is contract volume, shift costs, or equipment spend.
Priya is finance director at a multi-site contract security provider. She uses the Revenue Trend page during quarterly board presentations to show Avg Revenue Per Contract by Month and Total Equipment Cost by Quarter — giving leadership a clear view of where margins are tightening and which contract types are driving the most profit. Before discovering this template, building the same charts in Excel took her team 8 hours each quarter.
James runs the SLA compliance team for a mid-sized security company. Before client renewal meetings, he pulls up the Incident & SLA page and Client Insights page to show SLA Compliance by Region and Client Type side by side. This gives account managers the data to justify rate increases or, when needed, to address compliance gaps before the client raises them first.
Advantages of Security Company Dashboard in Power BI
The most significant advantage is the breadth of analysis in a single .pbix file. Most security companies either track financial KPIs separately from operational metrics, or they rely on monthly reports built manually in Excel. The Security Company Dashboard in Power BI consolidates profit margins, guard deployment, revenue trends, SLA compliance, and client-level performance into one report that refreshes automatically when connected to updated data. This eliminates duplicate reporting and gives every team — finance, operations, compliance, and account management — a shared, consistent view of business performance.
The one-time pricing model is a second meaningful advantage. At $17.99 compared to $50–100+/user/month for security management platforms, the total Year-1 cost for a five-person leadership team is approximately $17.99 vs $3,000–6,000. The savings alone justify dozens of hours of customization work if needed.
Opportunities for Improvement
The Security Company Dashboard in Power BI uses Excel or CSV data as its input layer, which means real-time data from guard-management hardware, access-control systems, or dispatch software requires an intermediate export step before Power BI can refresh. Teams that need sub-hourly reporting from live systems will need to set up automated data exports or use Power BI’s gateway and dataflow features for scheduled refreshes. Additionally, the template covers financial and operational KPIs but does not include payroll processing, leave tracking, or client invoicing — those workflows require dedicated HR and billing tools alongside this dashboard. You can also explore the Security Company Dashboard in Excel if your team prefers a fully Excel-based workflow, or the Security KPI Dashboard in Power BI if you need MTD/YTD KPI tracking with target-vs-actual comparisons.
Best Practices
- Standardize your data structure before connecting — use consistent region names, contract type labels, and branch names across all source records to ensure filters work correctly across pages.
- Set up a scheduled data refresh in Power BI Desktop or Power BI Service so the dashboard reflects the latest month-end records automatically without manual file replacement.
- Share the Incident & SLA page directly with compliance officers as a PDF export at the end of each reporting period to maintain an audit trail without giving external recipients full dashboard access.
- Use the Client Insights page 30–45 days before major contract renewals to identify at-risk accounts where SLA compliance is declining so account managers can address issues proactively.
Explore Relevant Templates
🔹 Security KPI Dashboard in Power BI — MTD/YTD KPI tracking for incidents, patrols, access control, and compliance with target-vs-actual comparisons.
🔹 Security Company Dashboard in Excel — The same 5-page analysis in Excel for teams that prefer spreadsheet-based reporting.
🔹 Browse all Power BI Dashboard Templates for 600+ industry-specific reporting solutions.
Frequently Asked Questions
What KPIs does the Security Company Dashboard in Power BI track?
The Security Company Dashboard in Power BI tracks 5 executive KPIs on the Overview page: Total Staff Cost, Total Guards Deployed, Total Service Revenue, Net Profit, and Total Contracts. Across all 5 pages it covers 12+ metrics including Profit Margin by Region, SLA Compliance by Region, Avg Response Time by Priority and Incident Type, Net Profit by Branch Office, and Total Service Revenue by Month Name.
Do I need a paid Power BI license?
No. The Security Company Dashboard in Power BI runs on Power BI Desktop, which is a free download from Microsoft. A paid Power BI Pro or Premium Per User license is only needed if you want to publish the report to Power BI Service for shared cloud access by a team. For single-user or local reporting, the free desktop version is fully sufficient.
How long does initial setup take?
Most users complete setup in under 15 minutes. Download the .pbix file, open it in Power BI Desktop, replace the sample data with your own Excel or CSV records, and click Refresh. All 5 pages and 12+ visuals update immediately. No formulas to rebuild, no charts to reconfigure.
How does this compare to guard management software like Trackforce Valiant?
Guard management platforms like Trackforce Valiant focus on patrol scheduling, guard clocking, and dispatch — they charge $50–100+/user/month. The Security Company Dashboard in Power BI focuses on financial and operational KPIs (profit margins, SLA compliance, revenue by contract type) that guard scheduling software doesn’t cover. They serve different reporting needs and work well together.
Can I add my own pages or modify the existing charts?
Yes. The Security Company Dashboard in Power BI is a standard .pbix file with full Power BI Desktop editing capabilities. You can add pages, rename fields, change visual types, add new DAX measures, and adjust slicers to match your specific region structure, contract categories, or shift patterns — all within free Power BI Desktop.
Is there an Excel version of this dashboard?
Yes. The Security Company Dashboard in Excel covers the same 5 pages and KPI set in a familiar Excel environment without requiring Power BI Desktop. Both versions are available as separate one-time purchases on NextGenTemplates.
What file format is included in the download?
The download contains one .pbix Power BI Desktop file with 5 pre-built dashboard pages, realistic sample security operations data, and all DAX measures pre-configured. No additional plugins or add-ins are needed beyond free Power BI Desktop.
About the Author
Built by PK — Microsoft Certified Professional with 15+ years of Excel, Google Sheets, and Power BI experience. Founder of NextGenTemplates, reaching 300K+ subscribers across YouTube channels. Every template is hand-built and tested before release.
Conclusion
The Security Company Dashboard in Power BI gives security company owners, finance directors, operations managers, and compliance teams a single 5-page reporting solution that covers every dimension of business performance — from guard deployment and profit margins to SLA compliance and client-level revenue trends. At $17.99 as a one-time purchase, it delivers reporting clarity that typically requires months of custom Power BI development or expensive SaaS subscriptions.
✅ Click here to Purchase the Security Company Dashboard in Power BI
Instant download · One-time payment · No subscription · Lifetime access
🎥 Watch step-by-step tutorials: Youtube.com/@PK-AnExcelExpert
📅 Last updated: May 2026