Security companies manage complex operations: multiple client contracts, guard deployments across shifts and regions, SLA commitments, and incident response timelines — all simultaneously. According to the Global Security Industry Alliance, the private security market exceeded $230 billion globally in 2024, yet most small-to-mid-sized firms still track operations using scattered spreadsheets with no unified dashboard view. The Security Company Dashboard in Excel changes that.
This ready-to-use Excel template tracks 17 KPIs across 5 interactive pages, with 15+ pre-built charts and 4 dynamic slicers. Replace the sample data in the Data Sheet tab, click Data → Refresh All in the Excel Ribbon, and every metric, chart, and KPI card updates automatically — no formulas to edit, no VBA required.
🌍 8,400+ teams in 40+ countries use NextGenTemplates to replace expensive SaaS tools with one-time-purchase Excel, Google Sheets, Power BI, and HTML templates. Instant download · One-time payment · No subscription.
Key Features of the Security Company Dashboard in Excel
This dashboard is built on Excel PivotTables — one of the most reliable data aggregation tools in Excel — ensuring every chart reflects the source data without formula maintenance. Three definitive facts about what this template delivers:
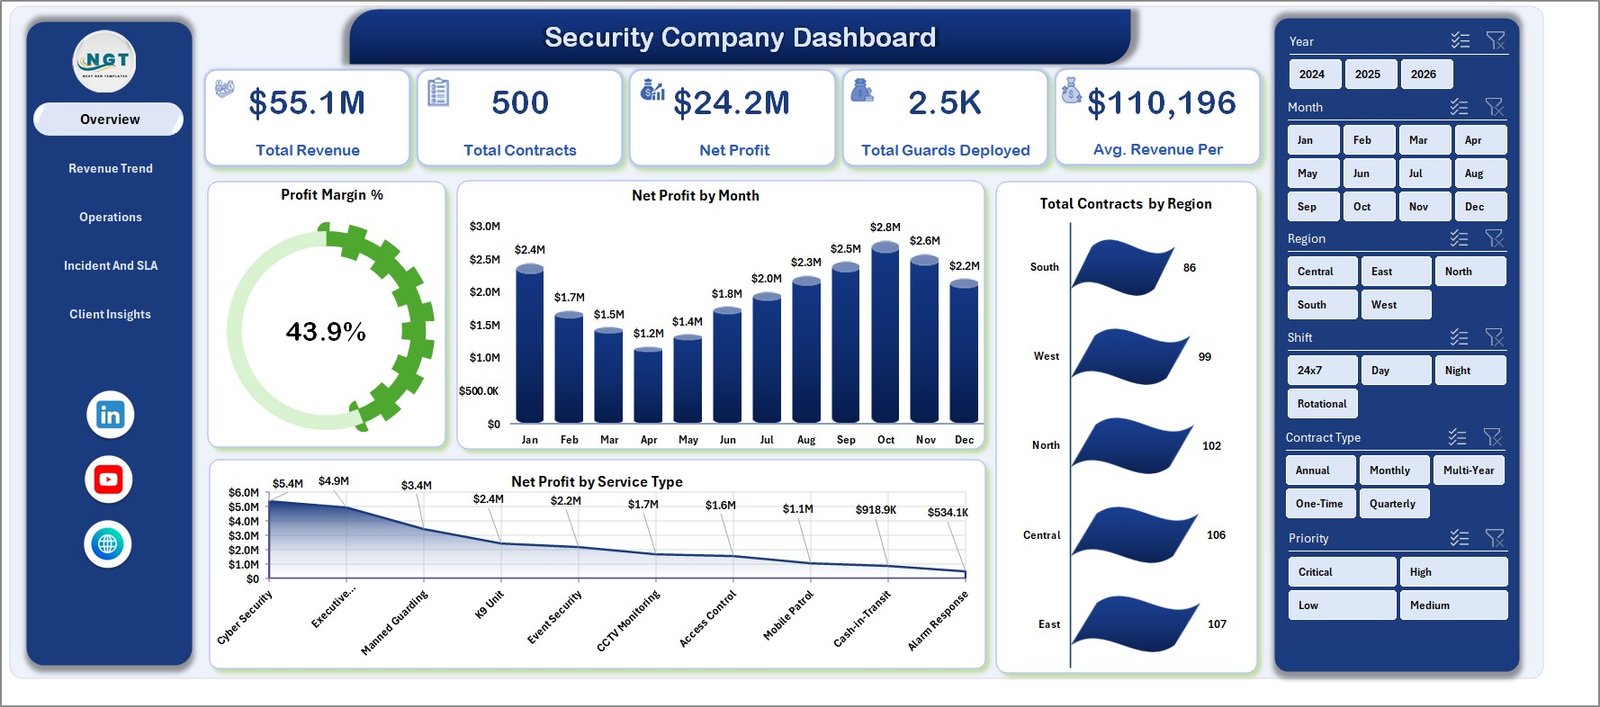
- The Security Company Dashboard in Excel tracks 5 top-line financial KPIs on the Overview page — Total Revenue, Net Profit, Total Contracts, Total Guards Deployed, and Avg. Revenue Per Contract — with 4 slicers that filter every chart simultaneously.
- The Incident & SLA page monitors 4 compliance metrics: Avg. Response Time by Priority, SLA Compliance % by Service Type, SLA Compliance % by Region, and Avg. Response Time by Incident Type.
- The Client Insights page surfaces 4 client-level analyses: Net Profit by Client Type, SLA Compliance % by Client Type, Avg. Satisfaction by Supervisor, and Total Revenue by City — enabling targeted client retention decisions.
Dashboard Pages Explanation
1. Overview Page
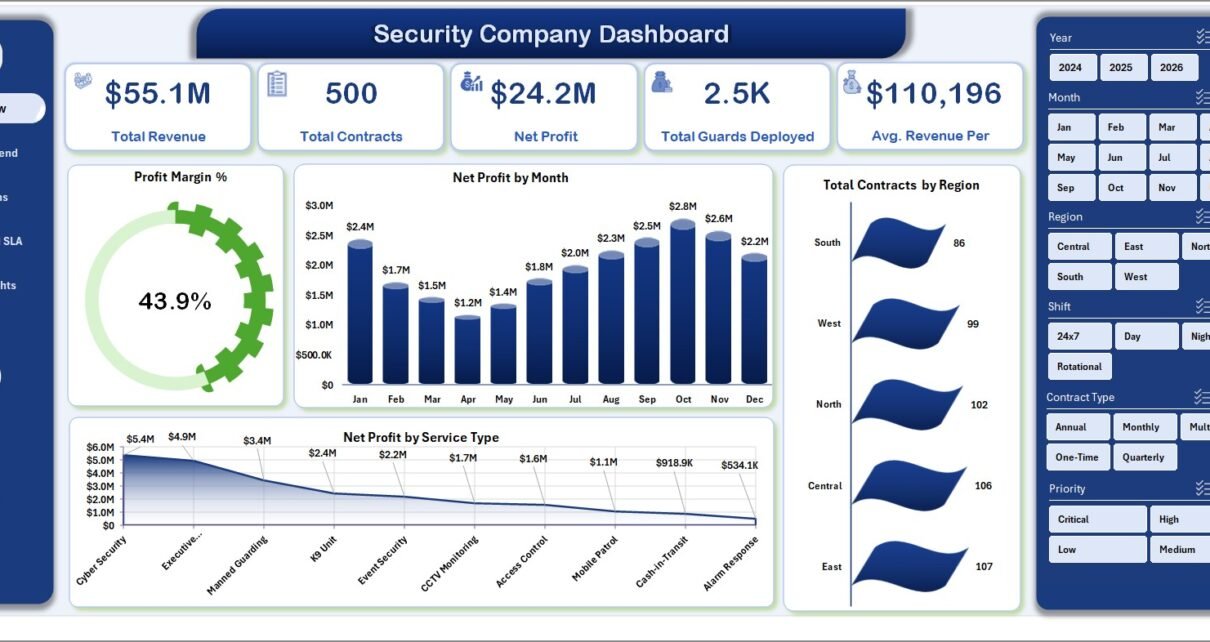
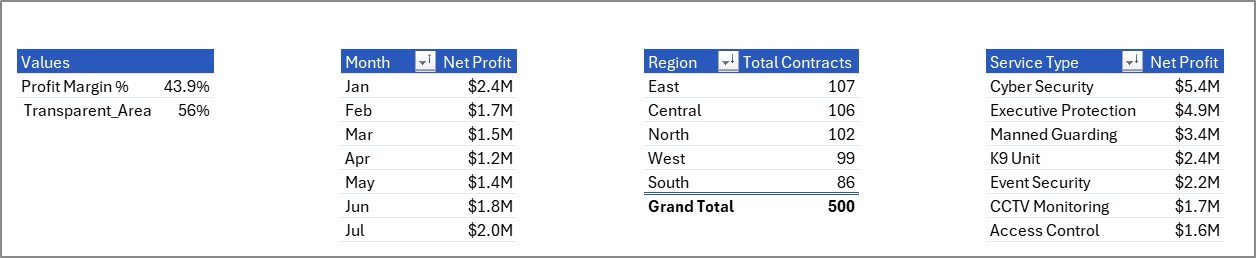
The Overview page is the command centre for your security operations. Five KPI cards surface Total Revenue, Total Contracts, Net Profit, Total Guards Deployed, and Avg. Revenue Per Contract. Below, four pivot charts — Profit Margin %, Net Profit by Month, Total Contracts by Region, and Net Profit by Service Type — deliver a graphical breakdown of business health. Four interactive slicers let you filter the entire page by any dimension in seconds.
Security Company Dashboard in Excel – Overview Page
2. Revenue Trend
The Revenue Trend page answers the critical financial question: where is money coming from, and how is it changing? Four analyses — Net Profit by Year, Total Equipment Cost by Quarter, Total Contracts by Contract Type, and Avg. Revenue Per Contract by Month — let finance leads spot seasonal dips, equipment cost spikes, and contract mix shifts at a glance.
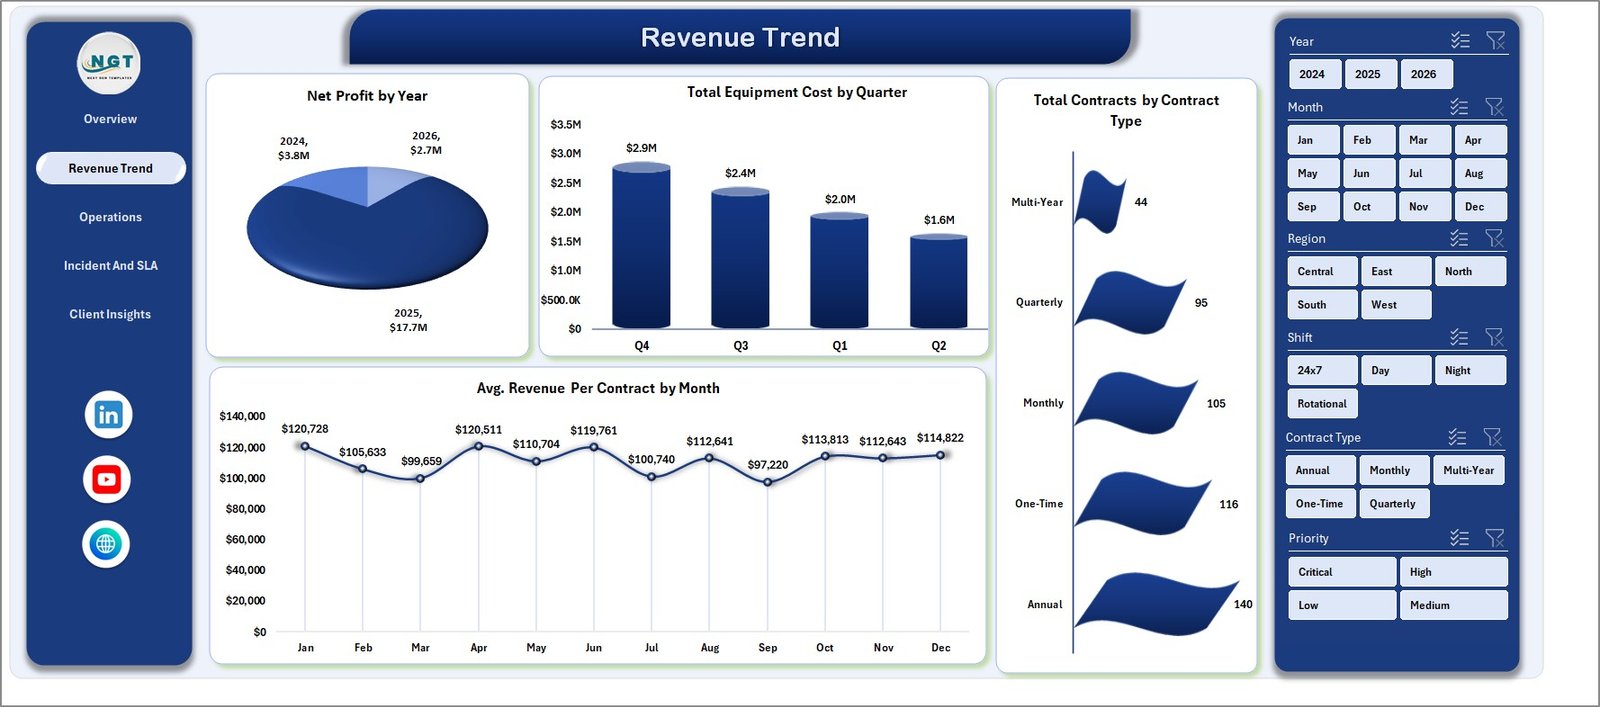
Security Company Dashboard – Revenue Trend Page
3. Operations
The Operations page gives regional managers the deployment view they need. Four charts cover Total Contracts by Shift, Total Service Hours by Service Type, Total Revenue by Equipment Used, and Net Profit by Branch Office — making it easy to compare branch-level performance and identify which shifts and equipment configurations generate the most value.
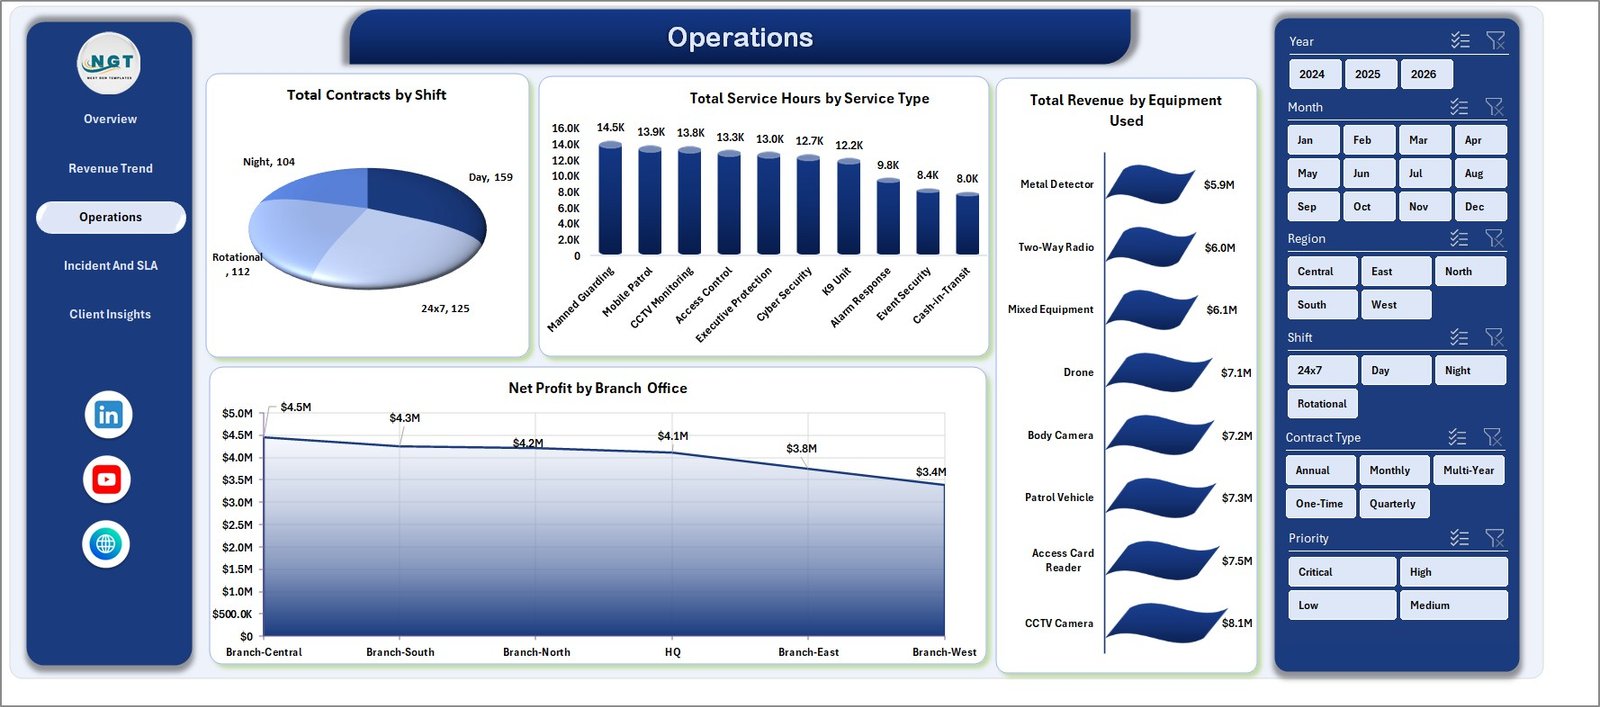
Security Company Dashboard – Operations Page
4. Incident & SLA
SLA compliance is a core retention driver in the security industry. This page tracks four critical metrics: Avg. Response Time by Priority, SLA Compliance % by Service Type, SLA Compliance % by Region, and Avg. Response Time by Incident Type. Operations managers can spot compliance gaps before they reach client review meetings.
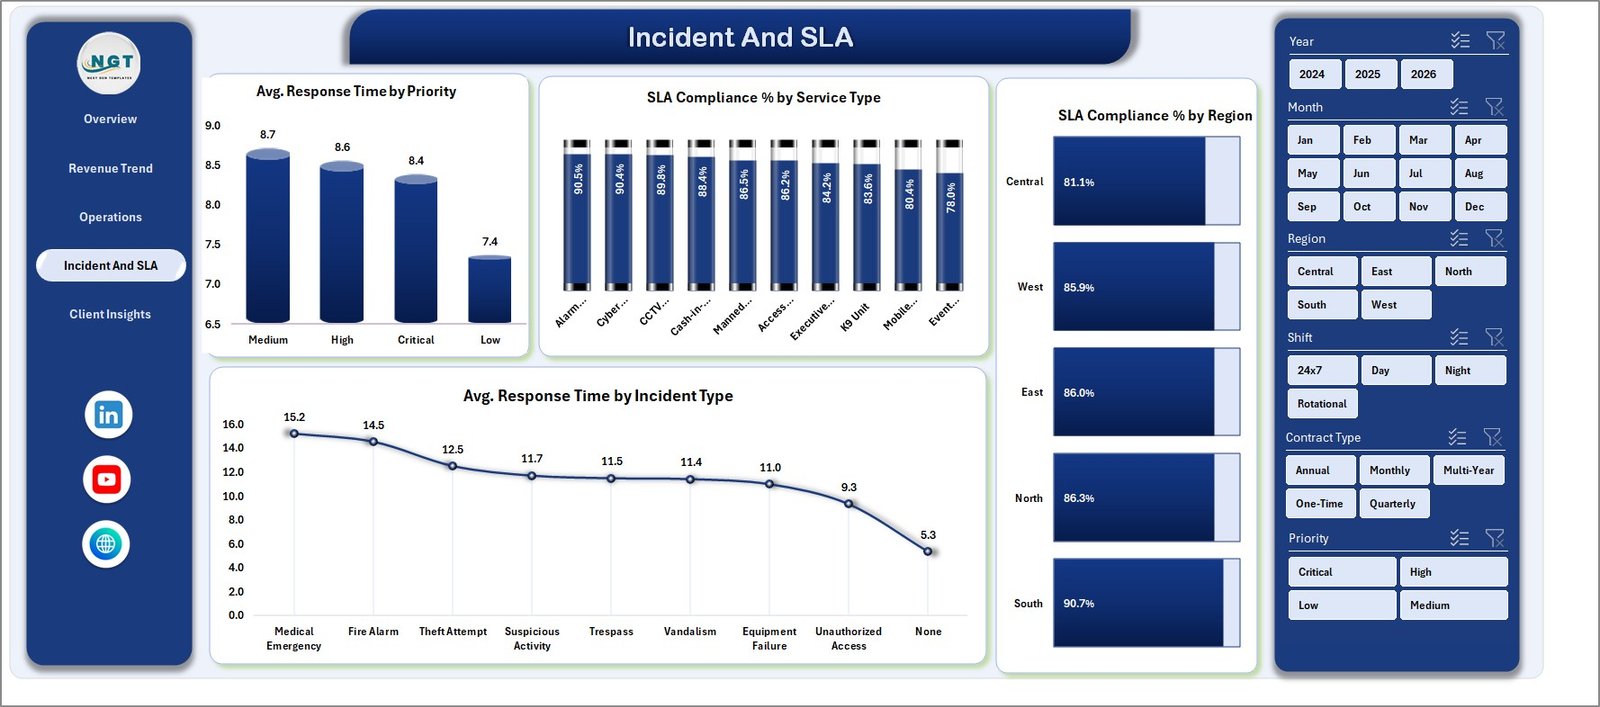
Security Company Dashboard – Incident and SLA Page
5. Client Insights
The Client Insights page makes client portfolio management data-driven. Four analyses — Net Profit by Client Type, SLA Compliance % by Client Type, Avg. Satisfaction by Supervisor, and Total Revenue by City — help account managers identify highest-value client segments and flag underperforming supervisors before clients do.
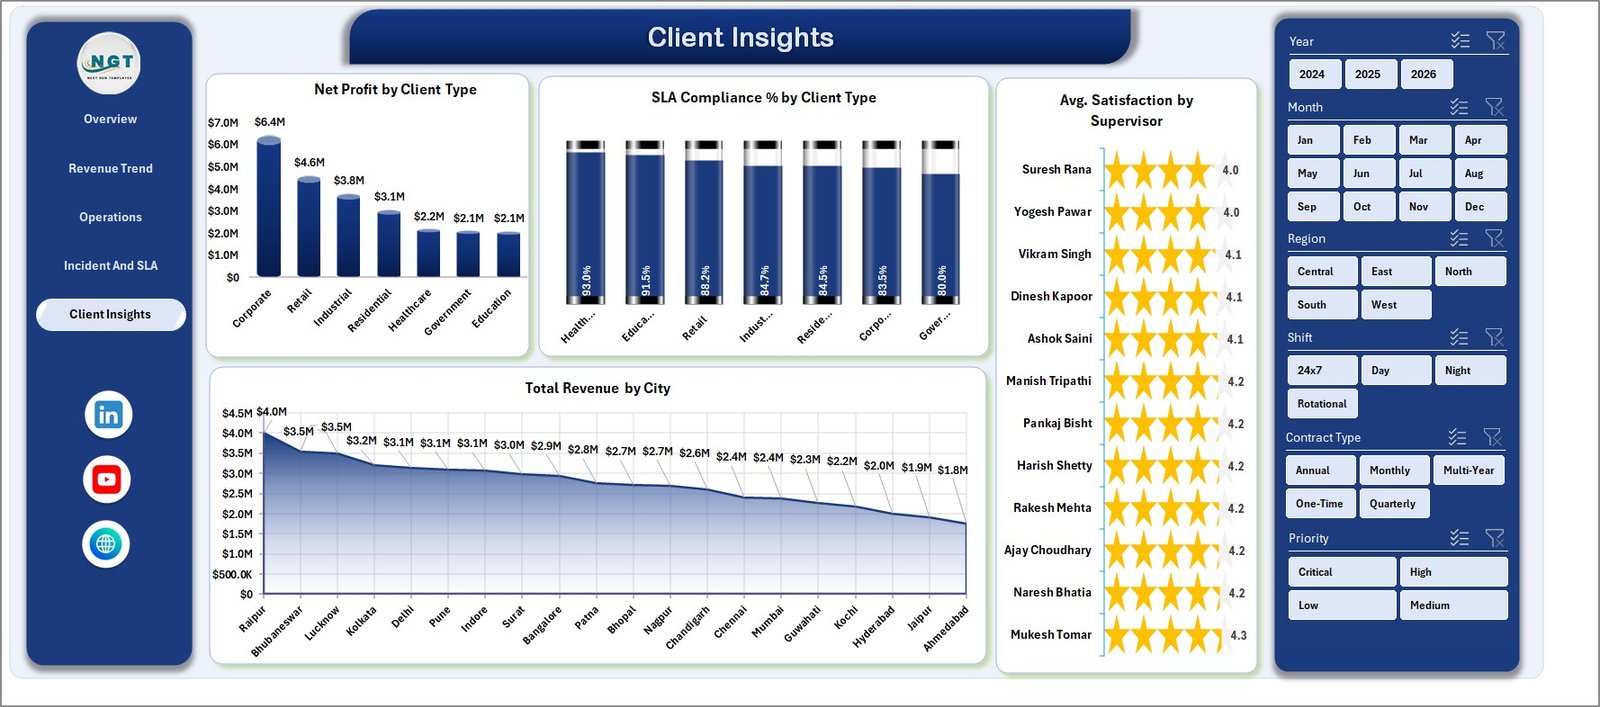
Security Company Dashboard – Client Insights Page
6. Data Sheet
All raw records live here in a structured table. Add your own guard contracts, incident data, revenue records, and client information in the same column format as the sample data — then refresh. No formulas to edit.

Security Company Dashboard – Data Sheet Tab
7. Support Sheet
The Support Sheet holds all pivot tables that power every chart and KPI card across the 5 pages. Keep this sheet hidden during day-to-day use. After updating the Data Sheet, click Data → Refresh All in the Excel Ribbon and all pivots refresh instantly.
Security Company Dashboard – Support Sheet Tab
Security Company Dashboard in Excel vs. Google Sheets vs. GuardTrax — Feature Comparison
| Feature | Security Company Dashboard in Excel | Google Sheets Security Template | GuardTrax (SaaS) |
|---|---|---|---|
| Cost | $17.99 one-time ✅ | Free but limited | $35–80 / user / month |
| Platform | Microsoft Excel ✅ | Browser only | Cloud SaaS app |
| Setup time | Under 10 minutes ✅ | 15–30 minutes | 1–3 days onboarding |
| 5 dashboard pages | Yes ✅ | No | Partial |
| SLA compliance tracking | Yes ✅ | Limited | Yes |
| Works offline | Yes ✅ | No | No |
| Customizable fields | Fully ✅ | Limited | Paid add-on |
| Year-1 cost (5 users) | $17.99 total ✅ | $0 (limited) | $2,100–$4,800 |
For security companies that want full KPI and SLA reporting without a monthly SaaS bill, the Security Company Dashboard in Excel sits in the sweet spot.
Who Should Use This Template
Perfect for:
- Security company owners and operations managers tracking 5–500 guards across multiple sites and shifts
- Finance leads who need monthly revenue, contract, and profit breakdowns by region and service type
- Account managers monitoring client SLA compliance and satisfaction scores
- Regional managers comparing branch-level performance and guard deployment efficiency
Not a fit if:
- You need real-time live GPS guard tracking or integrated dispatch — that requires dedicated SaaS software
- Your team needs simultaneous multi-user cloud editing — consider a Google Sheets-based version instead
Real-World Use Cases
Raj manages operations at a 120-guard firm covering retail and commercial clients across three cities. Every Monday, he opens the Incident & SLA page of the Security Company Dashboard in Excel to check SLA compliance by region — flagging any service type below 90% before weekly client calls. He presents the Overview KPI cards to ownership without spending hours compiling reports from multiple systems.
Diana is the Finance Director at a 200-person security company. She uses the Revenue Trend page to track Total Equipment Cost by Quarter, spotting a Q3 spike from vehicle maintenance that was cutting into branch margins. With the Net Profit by Branch Office chart on the Operations page, she identified two underperforming offices and restructured their equipment allocation.
Carlos is a Regional Manager overseeing four branch offices. He uses the Client Insights page to compare Avg. Satisfaction by Supervisor — identifying two supervisors with consistently lower scores and routing training resources before contract renewal season. Total cost for this insight: $17.99, once.
Advantages of the Security Company Dashboard in Excel
- One-time cost — $17.99 vs. $35–$80/user/month for SaaS alternatives. For a 5-person team over one year, the saving exceeds $2,000.
- Offline and portable — works without internet; share via email or OneDrive with no access restrictions.
- Full customization — add columns, rename categories, or adjust the data structure with no developer required.
- Instant refresh — one click via the Excel Ribbon updates every chart and KPI card across all 5 pages.
- SLA and incident intelligence — the dedicated Incident & SLA page fills a gap that most free Excel templates ignore entirely.
Opportunities for Improvement
Like any Excel-based template, the Security Company Dashboard has limitations worth acknowledging. It does not provide real-time data feeds — you update the Data Sheet manually. It does not support simultaneous multi-user editing without cloud storage like OneDrive or SharePoint. And while it tracks SLA compliance percentages and response times, it does not replace a live incident dispatch system. For companies whose operations require those capabilities, a dedicated SaaS platform may be the better fit.
Best Practices
- Update the Data Sheet weekly or monthly — consistent data entry makes trend charts meaningful.
- Use slicers on the Overview page to filter by region before client meetings for a tailored view of each client’s contract performance.
- Keep the Support Sheet hidden in day-to-day use to prevent accidental pivot edits.
- Back up the file to OneDrive or SharePoint before every major data entry session.
Explore Relevant Templates
If you found the Security Company Dashboard useful, explore these related Excel Dashboard Templates from NextGenTemplates:
- Pest Control Dashboard in Excel — Field service operations tracking for pest control businesses
- Cybersecurity Report in Excel — Security incident and vulnerability reporting for IT teams
Also check out the Pest Control Dashboard blog post for a step-by-step walkthrough of a similar field service dashboard.
Frequently Asked Questions
What KPIs does the Security Company Dashboard in Excel track?
The Security Company Dashboard in Excel tracks 17+ KPIs including Total Revenue, Net Profit, Total Contracts, Total Guards Deployed, Avg. Revenue Per Contract, Profit Margin %, SLA Compliance % by region and service type, and Avg. Response Time by priority and incident type. All metrics update automatically when you refresh the pivot tables.
How long does setup take?
Setup takes under 10 minutes. Open the Excel file, navigate to the Data Sheet tab, replace the sample records with your own data following the existing column structure, and click Data → Refresh All in the Excel Ribbon. Every chart and KPI card updates instantly with no formula editing required.
Does the Security Company Dashboard work on Mac?
Yes. The Security Company Dashboard in Excel is fully compatible with Microsoft Excel for Mac (2016 or later) and Excel for Windows. All slicers, pivot tables, and charts work on both platforms without modification.
How does this compare to GuardTrax or Trackforce Valiant?
GuardTrax and similar SaaS platforms start at $35–$80 per user per month with multi-day onboarding. The Security Company Dashboard in Excel delivers KPI and SLA reporting for a one-time $17.99 with no per-user fees, no subscriptions, and no internet required for day-to-day use.
Can I add more data rows or columns?
Yes. The Data Sheet supports unlimited rows. Add records below the existing sample data in the same column format and click Refresh All. You can also add new columns to the Data Sheet and create additional pivot fields in the Support Sheet for custom analyses beyond the 5 pre-built pages.
Is a subscription or internet connection required?
No. The Security Company Dashboard in Excel is a one-time purchase with no recurring fees. It works fully offline in Microsoft Excel — no internet connection needed for day-to-day use. Download once and it is yours permanently.
About the Author
Built by PK — Microsoft Certified Professional with 15+ years of Excel, Google Sheets, and Power BI experience. Founder of NextGenTemplates, reaching 300K+ subscribers across YouTube channels (@PK-AnExcelExpert, @NextGenTemplates, @NeoTechNavigators). Every template is hand-built and tested before release.
Conclusion
The Security Company Dashboard in Excel gives security company owners, operations managers, and finance leads a single structured view of revenue, contracts, guard deployment, SLA compliance, and client satisfaction — in a file that costs $17.99 once and runs offline without subscriptions.
👉 Click here to Purchase the Security Company Dashboard in Excel
✅ Instant download · One-time payment · No subscription · Lifetime access
🎥 Watch step-by-step tutorials on Youtube.com/@PK-AnExcelExpert
📅 Last updated: May 2026