Infrastructure project teams worldwide lose an estimated 20-30% of project value to poor cost controls and inadequate progress monitoring — problems that compound quickly when managing multi-region bridge portfolios with dozens of concurrent contracts. The Bridge Construction Dashboard in Power BI addresses this directly by delivering 5 dedicated report pages, 5 headline KPI cards, and 17 pre-built interactive visuals purpose-built for bridge construction management. According to Microsoft’s Power BI documentation, organizations using well-structured Power BI dashboards reduce reporting time by up to 80% compared to manual spreadsheet-based workflows. Setup takes under 10 minutes: open the .pbix file in Power BI Desktop, connect your project data, and every chart and KPI updates automatically.
🌍 Join 8,400+ teams in 40+ countries using NextGenTemplates to replace paid SaaS tools with one-time-purchase Power BI, Excel, Google Sheets, and HTML templates.
👉 Click here to Purchase the Bridge Construction Dashboard in Power BI
✅ Instant download · One-time payment · No subscription · Lifetime access
Key Features of the Bridge Construction Dashboard in Power BI
The Bridge Construction Dashboard in Power BI includes 5 KPI cards — Total Projects, Total Budget, Total Actual Cost, Total Safety Incidents, and Avg Quality Score — giving project directors a complete portfolio health view on the Overview page without navigating multiple reports or systems.
All 17 visuals are fully interactive and linked to the slicer panel at the top of each page. Users can filter the entire dashboard by region, bridge type, priority level, construction phase, or project status in a single click — no manual pivot table refreshes, no conditional formatting updates, no formula edits required.
The dedicated Safety and Quality page makes this dashboard stand out among construction-focused Power BI templates. Most generic project dashboards fold safety into a secondary metric. Here, Avg Quality Score by Bridge Type, Total Projects by Inspection Result, and Total Safety Incidents by Phase each get their own visual — giving HSE managers the focused view they need to spot risk patterns before incidents escalate.
👉 Click here to Purchase the Bridge Construction Dashboard in Power BI
Dashboard Pages Explanation
Page 1 — Overview Page
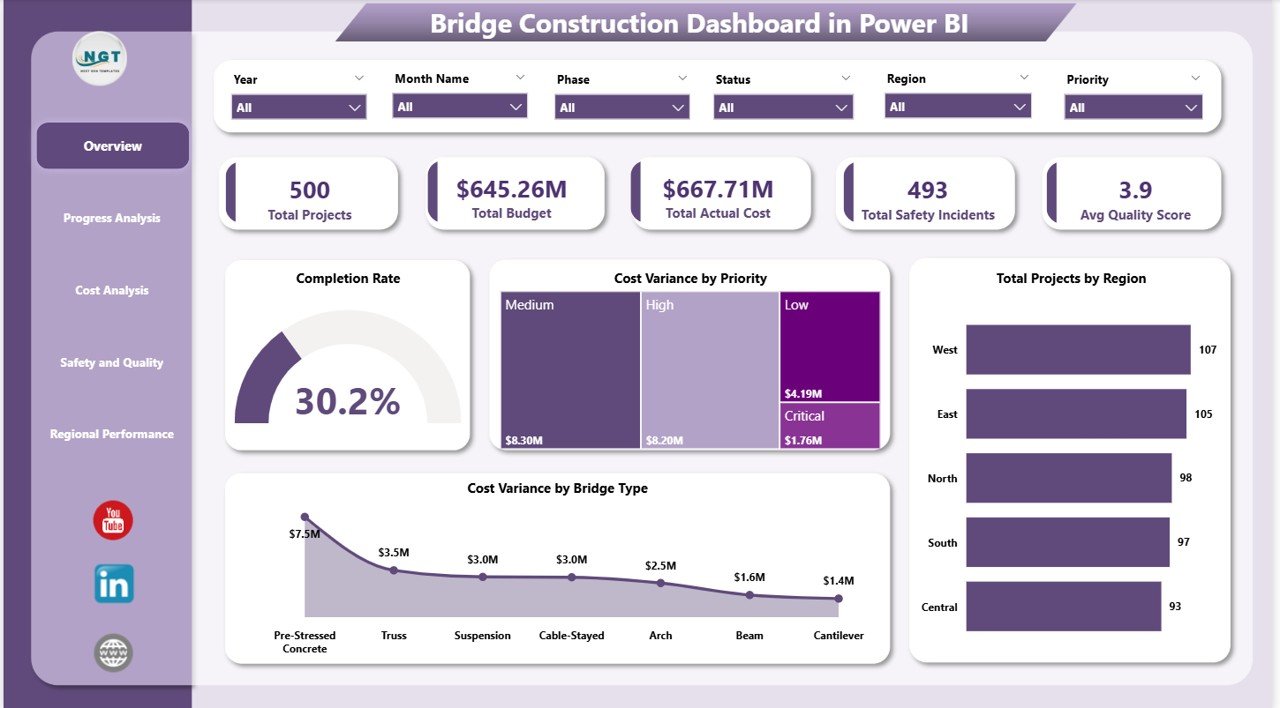
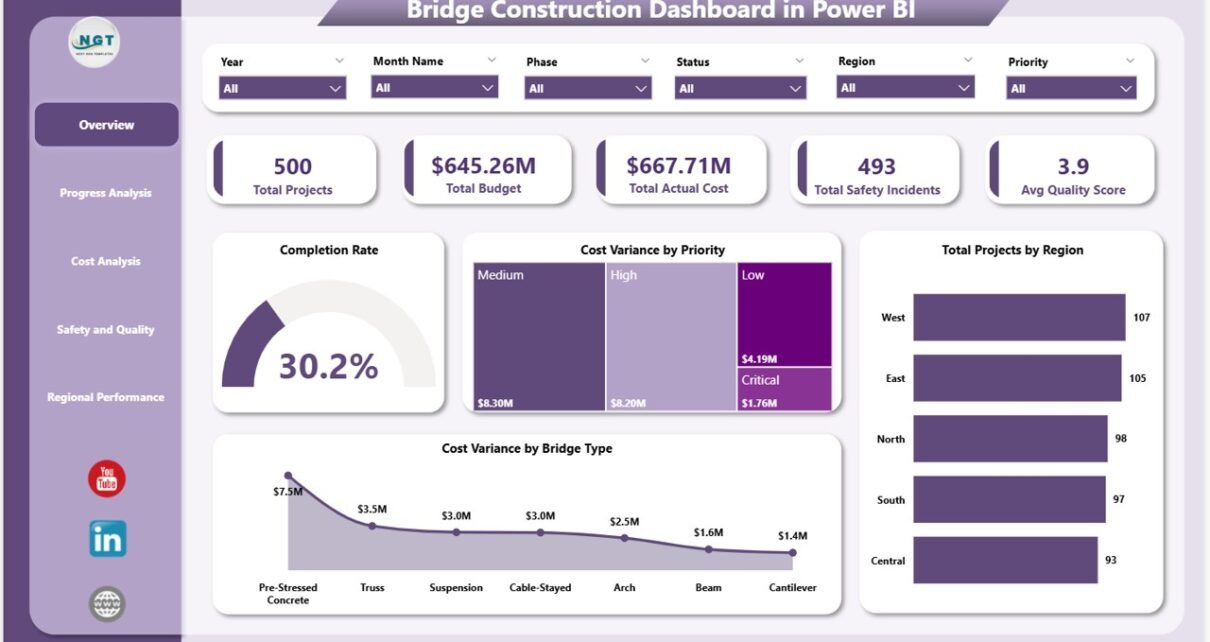
Overview Page
The Overview page opens with 5 KPI cards — Total Projects, Total Budget, Total Actual Cost, Total Safety Incidents, and Avg Quality Score — that give executives a one-screen portfolio summary. Four analysis charts sit below: Completion Rate shows the percentage of projects on schedule across the portfolio; Cost Variance by Priority compares budget vs. actual spend broken down by project priority level; Total Projects by Region shows the geographic distribution of the construction portfolio; and Cost Variance by Bridge Type reveals which bridge categories (suspension, cable-stayed, girder, etc.) are running over budget. Multiple slicers at the top allow instant cross-filtering of all four charts simultaneously.
Page 2 — Progress Analysis
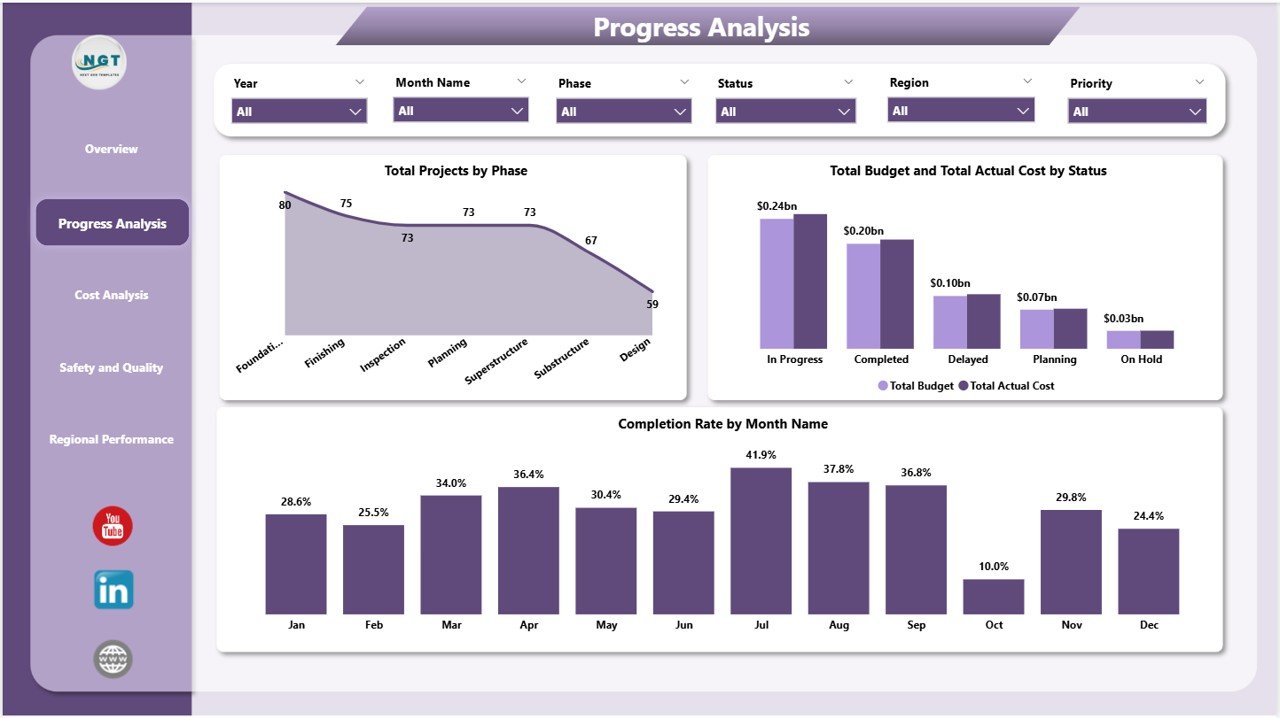
Progress Analysis Page
The Progress Analysis page breaks construction progress into three views: Total Projects by Phase shows how projects are distributed across design, procurement, construction, and closeout phases; Total Budget and Total Actual Cost by Status compares financial performance across active, on-hold, and completed projects; and Completion Rate by Month Name reveals month-over-month progress trends, helping program managers identify which periods typically see stalls or acceleration in the portfolio.
Page 3 — Cost Analysis
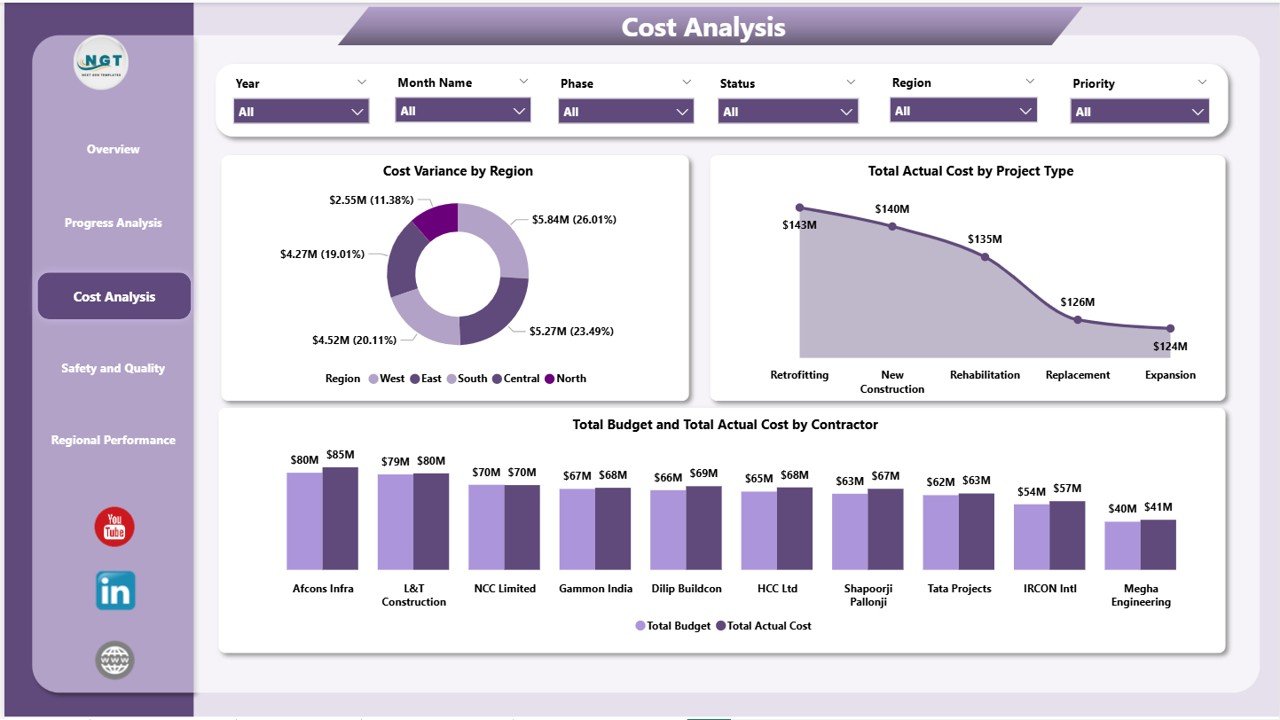
Cost Analysis Page
The Cost Analysis page gives finance and project controls teams three essential views: Cost Variance by Region identifies which regional offices are consistently over or under budget; Total Actual Cost by Project Type breaks down spend across bridge categories to reveal where costs concentrate; and Total Budget and Total Actual Cost by Contractor is the most actionable chart on this page — showing exactly which contractors are delivering within budget and which are driving overruns.
Page 4 — Safety and Quality
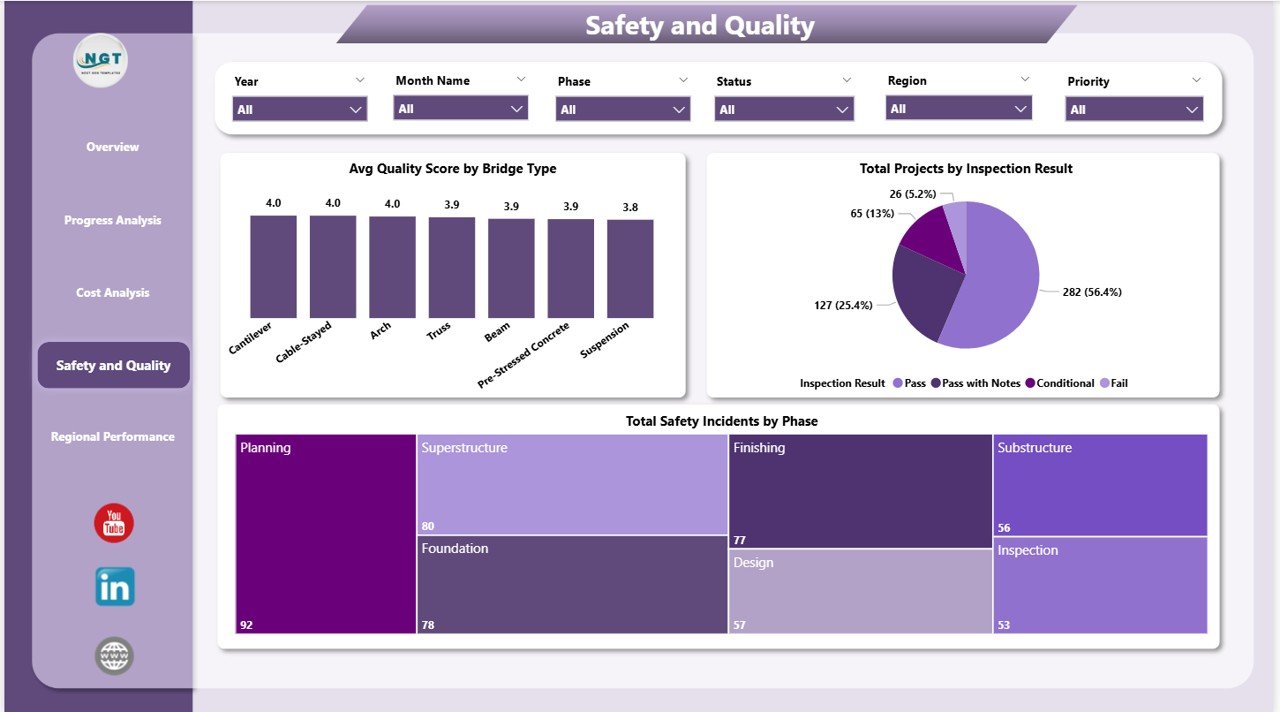
Safety and Quality Page
The Safety and Quality page delivers three dedicated HSE and inspection visuals: Avg Quality Score by Bridge Type benchmarks construction quality across bridge categories, making it easy to identify where engineering standards need reinforcement; Total Projects by Inspection Result categorizes projects by pass, conditional, and fail inspection outcomes; and Total Safety Incidents by Phase surfaces which construction phases carry the highest on-site risk — critical information for pre-phase safety planning and workforce briefing.
Page 5 — Regional Performance
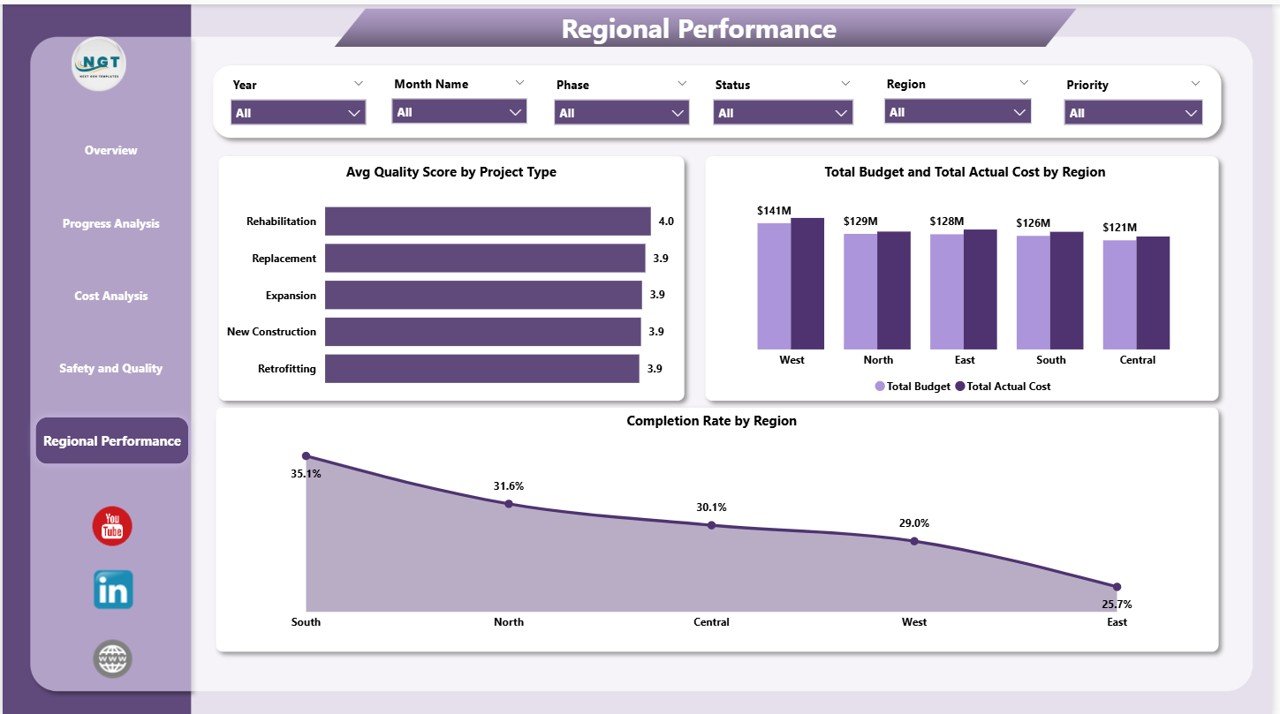
Regional Performance Page
The Regional Performance page brings geographic benchmarking together in one view: Avg Quality Score by Project Type compares quality outcomes across different bridge engineering types; Total Budget and Total Actual Cost by Region ranks regions by budget consumption and variance; and Completion Rate by Region shows which regional offices are meeting schedule targets and which are falling behind — enabling objective, data-driven conversations at portfolio review meetings.
Bridge Construction Dashboard in Power BI vs. Tableau vs. Oracle Primavera — Feature Comparison
| Feature | Bridge Construction Dashboard in Power BI | Tableau Desktop | Oracle Primavera P6 |
|---|---|---|---|
| Cost | $17.99 one-time | $70/user/month | $1,500+ per user/year |
| Setup time | Under 10 minutes | 2-5 hours data modeling | Days to weeks |
| Bridge-specific KPIs | ✅ Pre-built (5 cards, 17 visuals) | ❌ Build from scratch | ⚠️ Project mgmt focus only |
| Safety & quality page | ✅ Dedicated | ❌ Custom build required | ⚠️ Add-on module |
| Regional benchmarking | ✅ Built in | ❌ Manual setup | ⚠️ Limited |
| No per-user fees | ✅ | ❌ Per-seat | ❌ Per-seat |
| Year-1 cost (5 users) | $17.99 total | $4,200 | $7,500+ |
For construction teams that need bridge-specific reporting without enterprise licensing costs, the Bridge Construction Dashboard in Power BI sits in the sweet spot.
Who Should Use This Template
Perfect for:
- Infrastructure project managers overseeing 5-50 active bridge construction projects
- Public works departments and government agencies tracking multi-region bridge portfolios
- HSE managers who need a dedicated safety incident and quality score monitoring view
- Finance and project controls teams tracking budget vs. actual cost by contractor and region
- Power BI practitioners who want a ready-made construction-specific .pbix starting point
Not a fit if:
- You need real-time ERP integration (SAP, Oracle) — this template uses a flat data model
- You need Gantt charts or critical path scheduling (see Construction Project Timeline in Google Sheets)
- Your team doesn’t have Power BI Desktop installed (though it is free from Microsoft)
Real-World Use Cases
Marco manages a state DOT portfolio of 22 bridge rehabilitation projects across three regions. Every Monday he opens the Regional Performance page to see which regions are behind schedule and which contractors are over budget — in under two minutes, without a weekly report from his team. He’s reduced his Monday morning reporting prep from 90 minutes to under 10.
Priya is a project controls analyst at an infrastructure consultancy managing bridge design-build contracts. She uses the Cost Analysis page each month to compare contractor spend against contract values, flagging variances over 10% to project sponsors before they become escalation items. The Contractor chart alone saves her team one full day of Excel reconciliation per month.
James is an HSE officer on a 12-bridge highway expansion program. The Safety and Quality page gives him a real-time view of incident counts by construction phase and inspection pass rates by bridge type — replacing a manual spreadsheet that took four hours to update weekly. He now spends that time on actual site visits instead.
Advantages of the Bridge Construction Dashboard in Power BI
- ✅ Purpose-built for bridge construction — Unlike generic project dashboards, every KPI and chart in this template is specific to bridge construction workflows: phases, bridge types, inspection outcomes, and contractor cost structures
- ✅ 5 focused report pages — Overview, Progress, Cost, Safety, and Regional Performance each serve a distinct audience and use case, reducing dashboard clutter and improving report navigation
- ✅ One-time cost with no user limits — Share the .pbix file with your entire team at no additional cost, or publish to Power BI Service for browser-based access
- ✅ Fully customizable — Add DAX measures, modify visuals, change color themes, and extend the data model to match your organization’s specific terminology and reporting requirements
Opportunities for Improvement
- ⚠️ No Gantt chart or timeline view — This dashboard focuses on KPI and financial performance. For schedule management, pair it with a dedicated timeline tool
- ⚠️ Flat data model — The template uses a single data table structure. Teams with complex relational data (multiple fact tables, many-to-many relationships) may need to extend the data model
- ⚠️ No real-time data streaming — The dashboard refreshes from a static data source. Real-time IoT or sensor data integration requires additional Power BI configuration
Best Practices
- 💡 Keep your data source structured — The dashboard performs best when your source data has consistent column names matching the template’s field mappings. Review the sample data sheet before connecting your own data
- 💡 Use the slicer hierarchy — Start broad (filter by Region), then narrow down (Bridge Type, Phase) to avoid confusion when multiple slicers interact
- 💡 Publish to Power BI Service for team access — Once your data is connected and the dashboard is configured, publish to Power BI Service so project managers in different regions can access it from any browser without needing Power BI Desktop installed
- 💡 Schedule automatic data refresh — If your data source supports it (SharePoint, SQL Server, Azure), configure a scheduled refresh in Power BI Service to keep the dashboard current without manual intervention
Explore Relevant Templates
🔹 Bridge Construction Dashboard in Excel — The same bridge project analytics in Microsoft Excel format for spreadsheet-first teams and organizations not yet using Power BI.
🔹 Landscaping Dashboard in Power BI — Field operations and project performance tracking for landscaping and outdoor service businesses.
🔹 Resource Allocation KPI Dashboard in Power BI — Track resource utilization, capacity planning, and team workload distribution across multiple concurrent projects.
🔹 Browse all Power BI Dashboard Templates →
Frequently Asked Questions
What KPIs does the Bridge Construction Dashboard in Power BI track?
The Bridge Construction Dashboard in Power BI tracks 5 headline KPIs — Total Projects, Total Budget, Total Actual Cost, Total Safety Incidents, and Avg Quality Score — plus 17 additional metrics across cost variance, completion rate, regional performance, and safety analysis across its 5 report pages.
Do I need a paid Power BI license to use this dashboard?
No. The Bridge Construction Dashboard in Power BI works with Power BI Desktop, which is completely free to download from Microsoft. A Power BI Pro or Premium license is only required if you want to publish and share reports through Power BI Service with other users.
How long does it take to set up the dashboard with my own data?
Under 10 minutes for most users. Open the .pbix file in Power BI Desktop, connect to your data source via Transform Data, and all 17 visuals and 5 KPI cards update automatically. No DAX coding or formula editing is required to get started.
How does this compare to building a bridge construction dashboard in Tableau?
Tableau Desktop costs $70/user/month and requires 2-5 hours of custom data modeling and layout design to build a bridge-specific dashboard from scratch. The Bridge Construction Dashboard in Power BI delivers a purpose-built, ready-to-use solution for a one-time $17.99 with no recurring fees and no build time.
Can I add my own KPIs and modify the existing charts?
Yes. The .pbix file is fully editable in Power BI Desktop. You can add custom DAX measures, modify existing visuals, change color themes, add new pages, and extend the data model to track any additional KPIs or dimensions your organization requires.
Is there an Excel version available?
Yes — the Bridge Construction Dashboard in Excel is available for teams that prefer spreadsheet-based reporting and don’t have Power BI Desktop.
About the Author
Built by PK — Microsoft Certified Professional with 15+ years of Excel, Google Sheets, and Power BI experience. Founder of NextGenTemplates, reaching 300K+ subscribers across YouTube channels. Every template is hand-built and tested before release.
Conclusion
The Bridge Construction Dashboard in Power BI is one of the most focused, construction-specific Power BI templates available for infrastructure project managers, HSE officers, and project controls teams. With 5 dedicated report pages, 5 KPI cards, and 17 pre-built interactive visuals covering cost variance, safety monitoring, and regional performance, it replaces hours of manual reporting with a 10-minute setup and instant insight.
👉 Click here to Purchase the Bridge Construction Dashboard in Power BI
✅ Instant download · One-time payment · No subscription · Lifetime access
For video tutorials and walkthroughs, visit Youtube.com/@PK-AnExcelExpert
📅 Last updated: May 2026