In today’s competitive manufacturing environment, companies must monitor performance continuously to remain profitable and efficient. The adhesives and sealants industry, in particular, depends heavily on production efficiency, quality consistency, raw material utilization, and operational control. However, many organizations still rely on scattered spreadsheets and manual reports. As a result, decision-makers often struggle to identify performance gaps quickly.
Therefore, businesses increasingly adopt structured performance monitoring systems. One of the most effective solutions is the Adhesives and Sealants KPI Dashboard in Excel — a ready-to-use analytical tool designed to track, measure, and improve operational performance using Key Performance Indicators (KPIs).
In this comprehensive guide, you will learn everything about the Adhesives and Sealants KPI Dashboard in Excel, including its structure, features, benefits, implementation approach, best practices, and frequently asked questions.
Click to Purchases Adhesives and Sealants KPI Dashboard in Excel
What Is an Adhesives and Sealants KPI Dashboard in Excel?
An Adhesives and Sealants KPI Dashboard in Excel is an interactive performance monitoring system that helps manufacturers track production, quality, sales, efficiency, and financial metrics in one centralized dashboard.
Instead of reviewing multiple reports separately, managers can analyze all KPIs from a single screen. Consequently, teams make faster decisions and respond quickly to operational issues.
Moreover, Excel automation allows users to update data easily while dashboards automatically refresh calculations and visuals. Because of this, organizations gain real-time visibility into performance trends.
Why Do Adhesives and Sealants Companies Need KPI Tracking?
The adhesives and sealants industry involves complex processes such as:
-
Chemical formulation
-
Batch production
-
Quality testing
-
Packaging operations
-
Supply chain coordination
-
Regulatory compliance
Since these processes generate large volumes of data, companies need structured monitoring tools. Without KPIs, organizations often face:
-
Production inefficiencies
-
High material wastage
-
Delayed deliveries
-
Quality inconsistencies
-
Reduced profitability
Therefore, a KPI dashboard becomes essential for operational excellence.
Click to Purchases Adhesives and Sealants KPI Dashboard in Excel
Key Features of the Adhesives and Sealants KPI Dashboard in Excel
This ready-to-use dashboard includes seven structured worksheets, each serving a specific analytical purpose. Together, they create a complete performance management system.
1. Home Sheet – Central Navigation Hub
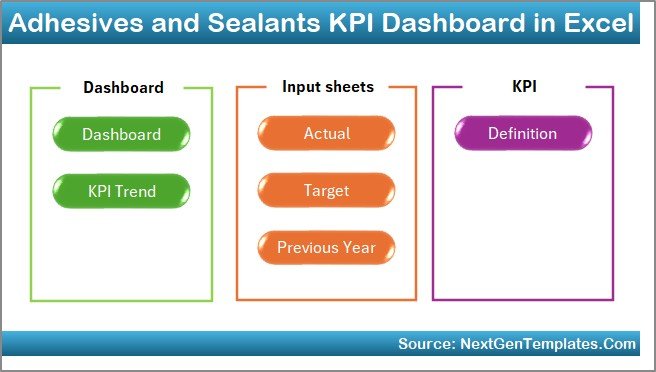
The Home Sheet acts as an index page that improves user experience and navigation.
Key Highlights
-
Six navigation buttons for quick access
-
Clean and professional layout
-
One-click movement between sheets
-
User-friendly structure for non-technical users
Because navigation becomes simple, users save time and avoid confusion while analyzing data.
2. Dashboard Sheet – Main KPI Overview
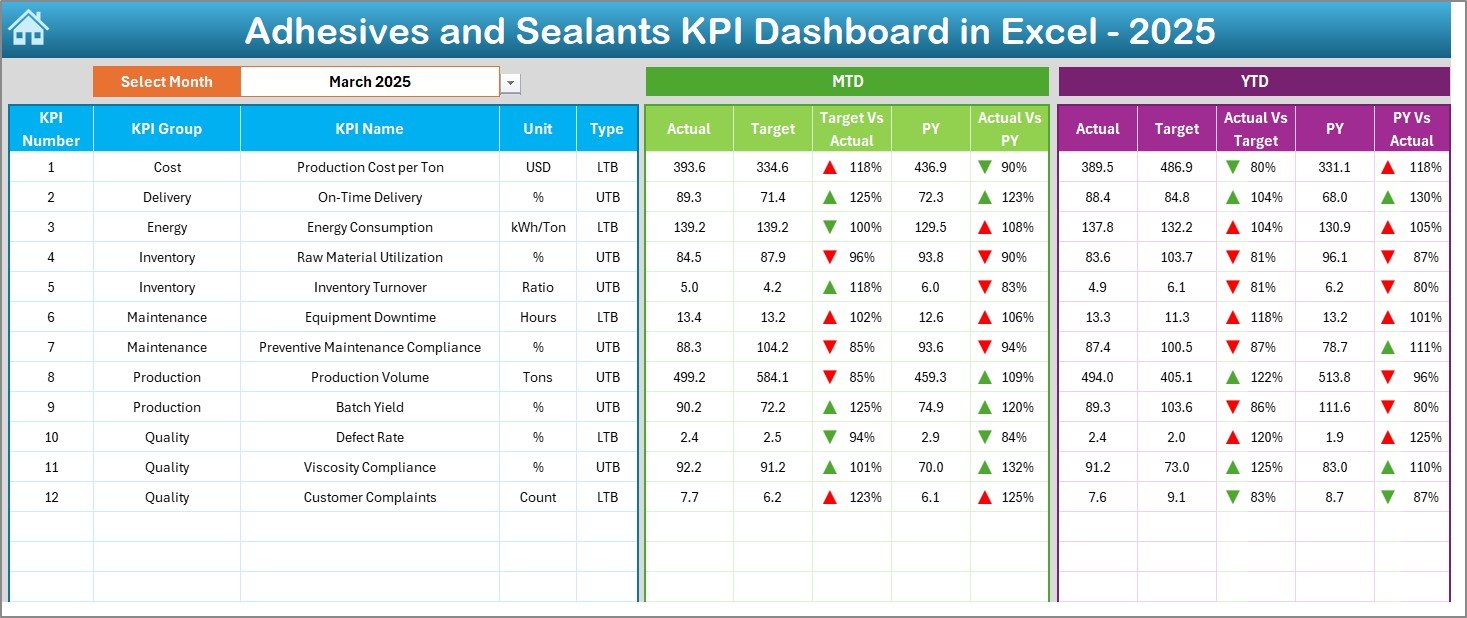
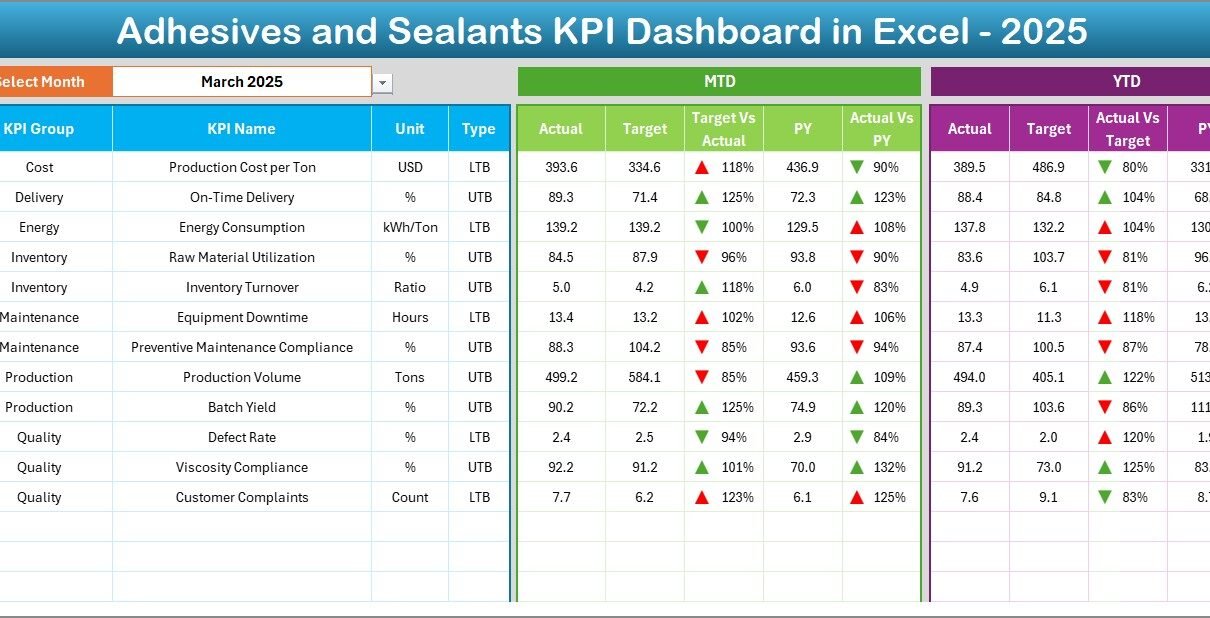
The Dashboard Sheet serves as the heart of the system. Here, users can view all KPIs in a single interactive interface.
Monthly Selection Control
-
Month dropdown located in cell D3
-
Selecting a month automatically updates the entire dashboard
-
Dynamic calculations refresh instantly
Therefore, managers can review monthly performance within seconds.
KPI Performance Metrics Displayed
The dashboard presents both MTD (Month-To-Date) and YTD (Year-To-Date) insights:
MTD Analysis
-
Actual values
-
Target values
-
Previous year comparison
-
Target vs Actual variance
-
Previous Year vs Actual comparison
YTD Analysis
-
Actual performance
-
Target performance
-
Previous year performance
-
Variance indicators
Conditional Formatting Indicators
The dashboard uses visual signals such as:
-
Up arrows for positive performance
-
Down arrows for underperformance
-
Color-based highlights
As a result, users instantly understand performance status without deep analysis.
Click to Purchases Adhesives and Sealants KPI Dashboard in Excel
3. KPI Trend Sheet – Performance Trend Analysis

The KPI Trend Sheet provides deeper analytical insights.
Interactive KPI Selection
Users select a KPI using the dropdown in cell C3, which dynamically updates all information.
Information Displayed
-
KPI Group
-
KPI Unit
-
KPI Type (Lower the Better / Upper the Better)
-
KPI Formula
-
KPI Definition
Additionally, trend charts display:
-
MTD Actual vs Target vs Previous Year
-
YTD Actual vs Target vs Previous Year
Because trends appear visually, managers easily identify performance patterns.
Click to Purchases Adhesives and Sealants KPI Dashboard in Excel
4. Actual Numbers Input Sheet – Data Entry Area

This sheet allows users to input operational data.
How It Works
-
Enter MTD and YTD actual values
-
Select starting month in cell E1
-
Dashboard updates automatically
Since the input process remains simple, users avoid complex formulas.
5. Target Sheet – Goal Management

The Target Sheet defines expected performance levels.
Users enter:
-
Monthly KPI targets
-
MTD targets
-
YTD targets
Consequently, organizations align operational activities with strategic objectives.
Click to Purchases Adhesives and Sealants KPI Dashboard in Excel
6. Previous Year Numbers Sheet – Historical Comparison
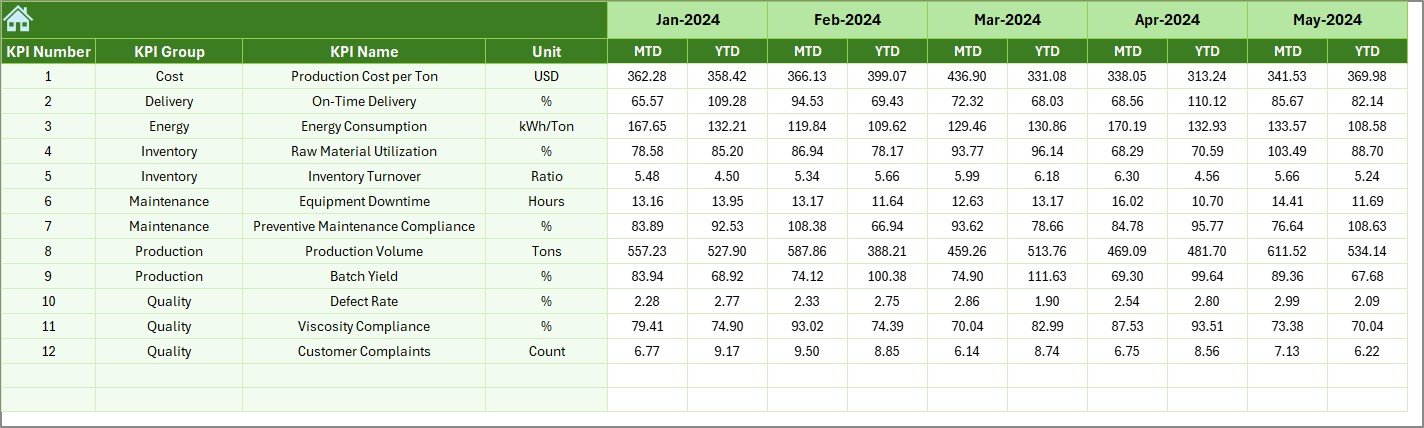
Historical analysis improves decision-making.
This sheet stores:
-
Previous year KPI data
-
Comparable monthly values
Therefore, companies evaluate growth and identify long-term trends.
7. KPI Definition Sheet – KPI Documentation Center
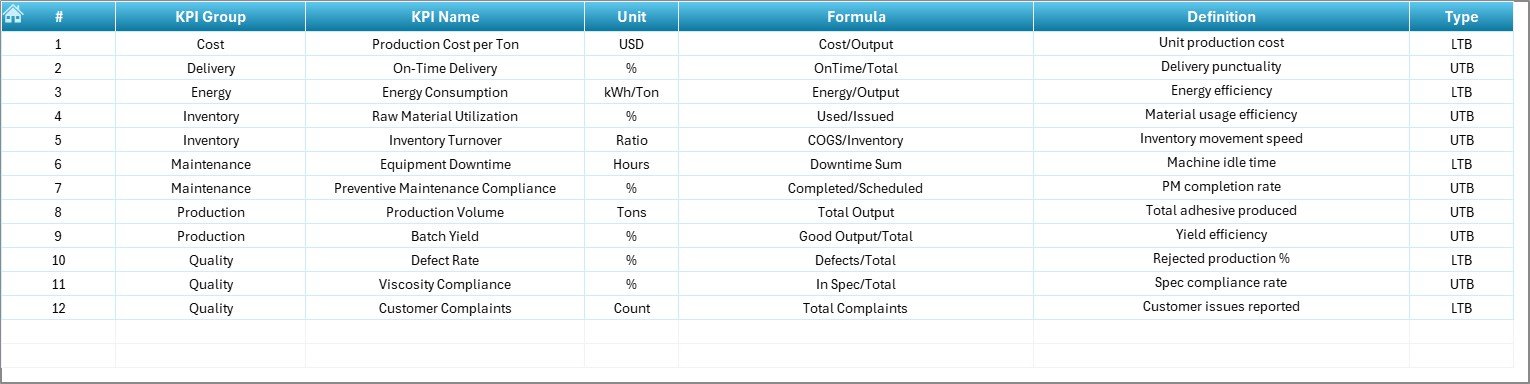
This sheet works as a KPI master database.
Information Captured
-
KPI Name
-
KPI Group
-
Measurement Unit
-
KPI Formula
-
KPI Definition
Because definitions remain standardized, teams maintain consistent reporting across departments.
Which KPIs Can Be Tracked in Adhesives and Sealants Manufacturing?
Although organizations customize KPIs based on operations, common metrics include:
Production KPIs
-
Batch production volume
-
Machine utilization rate
-
Production efficiency
-
Downtime percentage
Quality KPIs
-
Defect rate
-
Customer complaint rate
-
Product consistency index
-
Rework percentage
Supply Chain KPIs
-
Raw material availability
-
Inventory turnover
-
Delivery performance
-
Lead time
Financial KPIs
-
Cost per batch
-
Profit margin
-
Revenue growth
-
Operational cost ratio
How Does the Dashboard Improve Decision-Making?
A KPI dashboard transforms raw data into actionable insights.
First, It Centralizes Information
Managers no longer search across multiple files.
Next, It Enables Faster Analysis
Visual indicators highlight issues immediately.
Then, It Supports Data-Driven Decisions
Leaders rely on measurable results instead of assumptions.
Finally, It Encourages Continuous Improvement
Teams track progress regularly and adjust strategies.
Click to Purchases Adhesives and Sealants KPI Dashboard in Excel
Advantages of Adhesives and Sealants KPI Dashboard in Excel
Using a structured KPI dashboard provides several operational and strategic benefits.
✅ Improved Performance Visibility
Managers view all KPIs in one place, which simplifies monitoring.
✅ Faster Decision Making
Real-time comparisons enable quick corrective actions.
✅ Better Target Alignment
Teams clearly understand performance expectations.
✅ Historical Performance Tracking
Year-over-year analysis identifies improvement areas.
✅ Reduced Manual Reporting
Automation minimizes repetitive reporting tasks.
✅ Enhanced Accountability
Each department tracks measurable outcomes.
✅ Cost Efficiency
Excel-based solutions eliminate expensive software investments.
How to Implement the Adhesives and Sealants KPI Dashboard Successfully?
Implementing a KPI dashboard requires a structured approach.
Step 1: Define Business Objectives
Identify what success looks like for production, quality, and sales.
Step 2: Select Relevant KPIs
Choose measurable indicators aligned with goals.
Step 3: Gather Accurate Data
Ensure reliable input sources.
Step 4: Configure KPI Definitions
Standardize formulas and measurement units.
Step 5: Train Users
Explain navigation and data entry processes.
Step 6: Review Performance Monthly
Regular analysis drives improvement.
Click to Purchases Adhesives and Sealants KPI Dashboard in Excel
Best Practices for the Adhesives and Sealants KPI Dashboard in Excel
Organizations achieve better results when they follow proven practices.
✔ Keep KPIs Limited but Meaningful
Too many KPIs create confusion. Focus on critical metrics.
✔ Update Data Regularly
Frequent updates maintain dashboard accuracy.
✔ Use Standard Definitions
Consistency prevents reporting errors.
✔ Monitor Trends Instead of Single Values
Trend analysis reveals long-term performance.
✔ Align KPIs with Strategy
Each KPI should support business objectives.
✔ Review Variances Promptly
Investigate performance gaps immediately.
✔ Encourage Team Participation
Involve departments in KPI ownership.
Common Challenges and How to Overcome Them
Even powerful dashboards face implementation challenges.
Challenge 1: Poor Data Quality
Solution: Establish validation checks.
Challenge 2: Resistance to Change
Solution: Provide training and demonstrate benefits.
Challenge 3: Too Many Metrics
Solution: Focus on high-impact KPIs.
Challenge 4: Inconsistent Updates
Solution: Assign data responsibility.
How Does Excel Make KPI Management Easier?
Excel remains one of the most powerful tools for KPI dashboards.
Reasons Excel Works Well
-
Familiar interface
-
Flexible customization
-
Advanced formulas
-
Conditional formatting
-
Dynamic charts
-
Easy sharing
Moreover, Excel allows organizations to scale dashboards gradually without major investments.
Future of KPI Dashboards in Manufacturing
Manufacturing analytics continues to evolve rapidly. Companies increasingly integrate dashboards with:
-
ERP systems
-
IoT production data
-
Automated reporting
-
Predictive analytics
However, Excel dashboards still serve as the foundation for performance tracking because they remain accessible and adaptable.
Conclusion
The Adhesives and Sealants KPI Dashboard in Excel provides a structured, practical, and powerful solution for monitoring manufacturing performance. Instead of relying on manual reports, organizations gain centralized visibility into operational metrics.
Because the dashboard combines MTD and YTD analysis, trend visualization, KPI definitions, and automated comparisons, decision-makers understand performance instantly. Furthermore, clear visuals and conditional indicators simplify analysis for both technical and non-technical users.
Ultimately, companies that adopt KPI dashboards improve efficiency, reduce costs, and achieve better operational control. Therefore, implementing this dashboard represents a strategic step toward data-driven manufacturing excellence.
Click to Purchases Adhesives and Sealants KPI Dashboard in Excel
Frequently Asked Questions (FAQs)
1. What is a KPI dashboard in manufacturing?
A KPI dashboard is a visual reporting tool that tracks key performance indicators to monitor operational performance and support decision-making.
2. Why is KPI tracking important for adhesives and sealants companies?
KPI tracking helps companies monitor production efficiency, quality performance, and financial outcomes, which improves profitability and operational control.
3. Can beginners use this Excel dashboard?
Yes. The dashboard includes simple navigation buttons and structured input sheets, so beginners can use it easily.
4. How often should the dashboard be updated?
Organizations should update data monthly or weekly depending on operational requirements.5. What does MTD and YTD mean?
-
MTD: Month-to-Date performance
-
YTD: Year-to-Date performance
These metrics help evaluate short-term and long-term results.
6. Can companies customize KPIs?
Yes. Users can modify KPI definitions, formulas, and targets according to business needs.
7. Is Excel suitable for industrial KPI dashboards?
Absolutely. Excel provides flexibility, automation, visualization, and cost-effective performance monitoring.
Click to Purchases Adhesives and Sealants KPI Dashboard in Excel
Visit our YouTube channel to learn step-by-step video tutorials