New: NextGenTemplates Academy - video courses on Excel formulas with AI and Pivot Tables & dashboards. Early-bird: 20% off with code EARLYBIRD20 - first 20 orders only. See the courses →
  • Learn Excel (Free Course)
    • 1. Shortcut Keys
    • 2. Fill & Flash Fill
    • 3. Find & Replace
    • 4. Sort & Filter
    • 5. Formulas & Functions
    • 6. Data Validation
    • 7. Conditional Formatting
    • 8. Basic Charts
    • 9. Advanced Charts
    • 10. Pivot Tables
    • 11. Excel Dashboards
    • 12. VBA Course
    • 13. Excel Formulas with AI
  • Templates
  • Tutorials
    • Charts and Visualization
    • VBA
    • Excel Tips and Tricks
    • Excel Dashboards
    • Power Pivot & DAX
  • Power BI
  • Template Store
    • Ready to Use Templates
  • Courses
  • Academy
    • Excel + AI Mastery: 100 Formulas
    • Excel Pivot Tables & Dashboards
  • About Us
  • Contact Us

PK: An Excel Expert

Transforming Data into Decisions

Tag: Excel Reporting Tool

Dashboard Templates

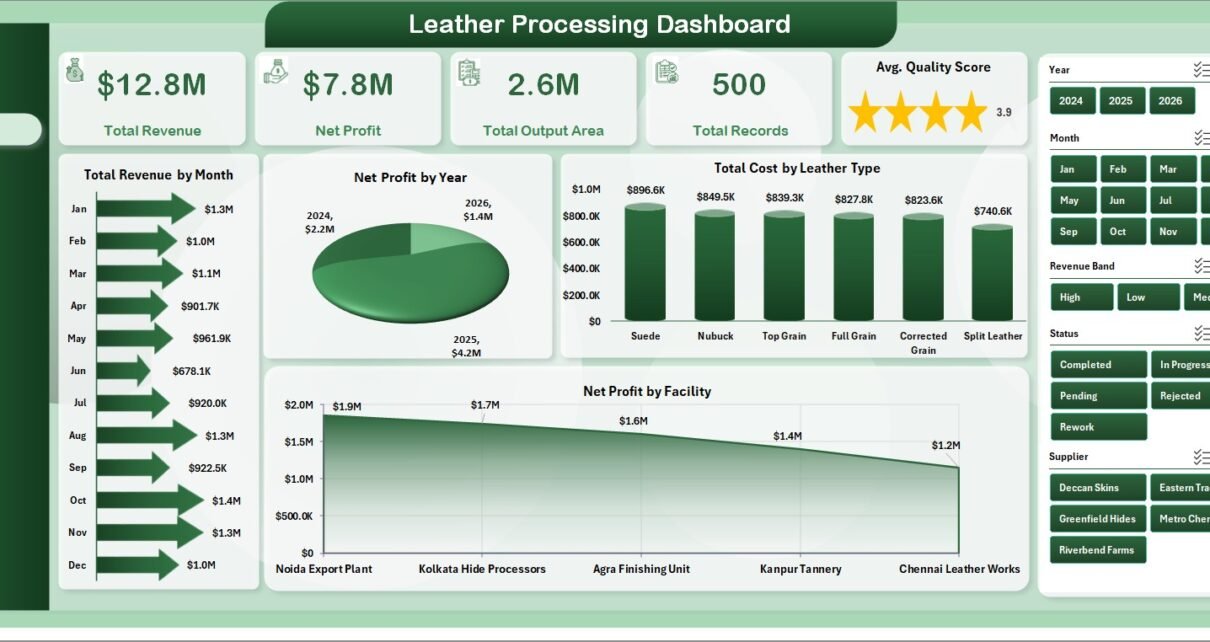
Leather Processing Dashboard in Excel

July 2, 2026July 2, 2026 PKComments Off on Leather Processing Dashboard in Excel
Leather Processing Dashboard in Excel helps leather manufacturers turn daily production, quality, costing, supplier, facility, and customer records into clear management insight. Instead of reviewing scattered sheets, this workbook brings
Read More
Dashboard

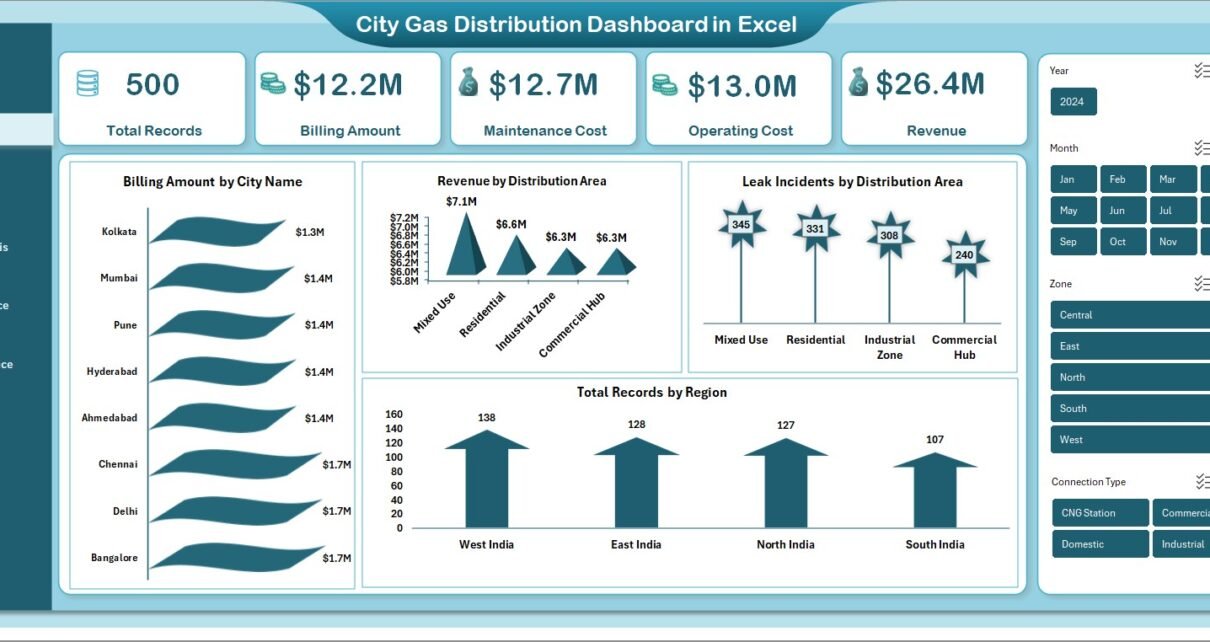
City Gas Distribution Dashboard in Excel

March 23, 2026March 23, 2026 PKComments Off on City Gas Distribution Dashboard in Excel
In today’s fast-growing urban environment, city gas distribution companies handle massive amounts of operational, financial, and safety data. However, managing this data manually becomes confusing, time-consuming, and error-prone. So, how
Read More
Dashboard

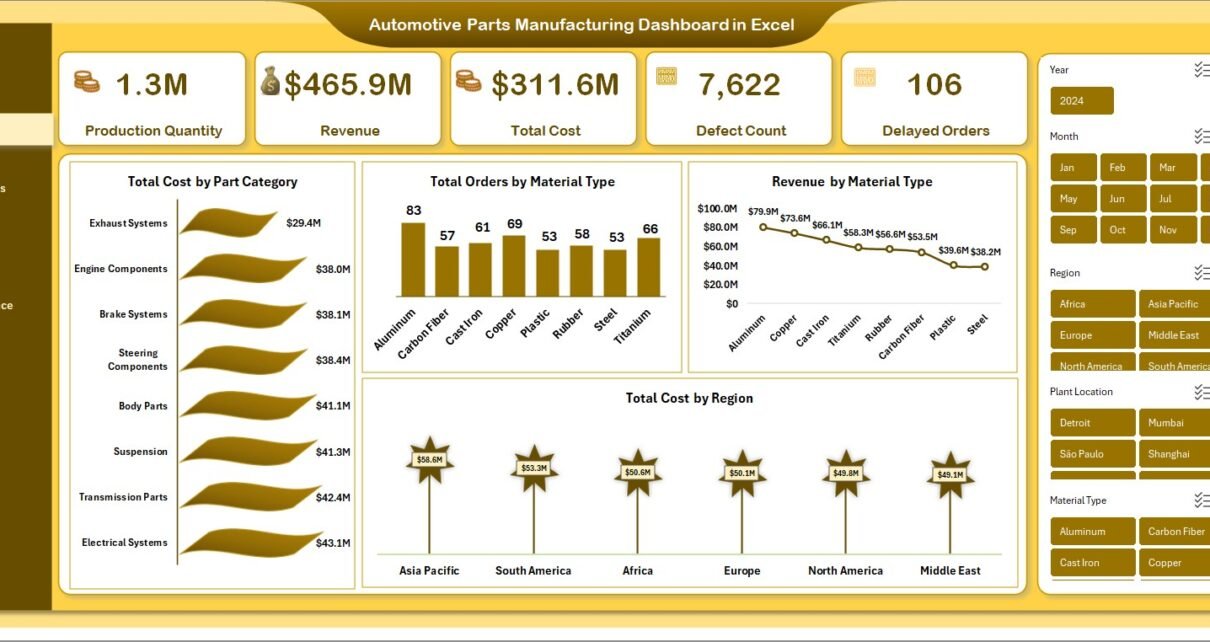
Automotive Parts Manufacturing Dashboard in Excel

March 19, 2026March 20, 2026 PKComments Off on Automotive Parts Manufacturing Dashboard in Excel
In today’s competitive manufacturing world, automotive parts companies handle huge amounts of data every day. They track production quantity, revenue, material usage, costs, defects, delayed orders, safety incidents, and monthly
Read More
Power Pivot

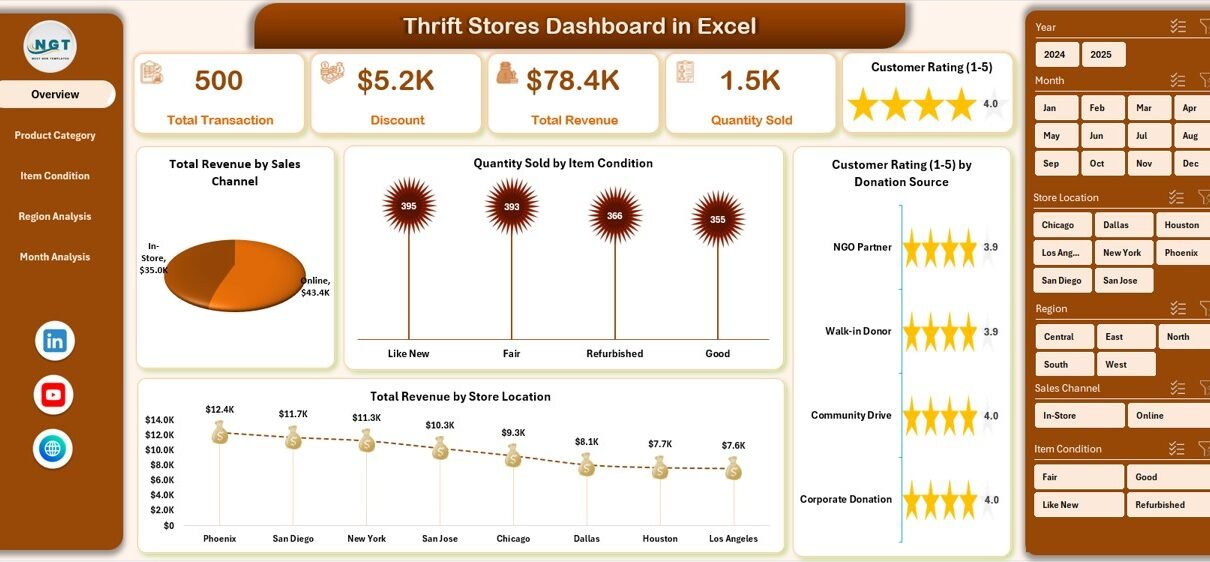
Thrift Stores Dashboard in Excel

March 2, 2026March 2, 2026 PKComments Off on Thrift Stores Dashboard in Excel
Thrift stores continue to grow rapidly across the world. Customers now prefer sustainable shopping, affordable products, and recycled fashion. As a result, thrift store owners must manage donations, pricing, inventory,
Read More
Dashboard

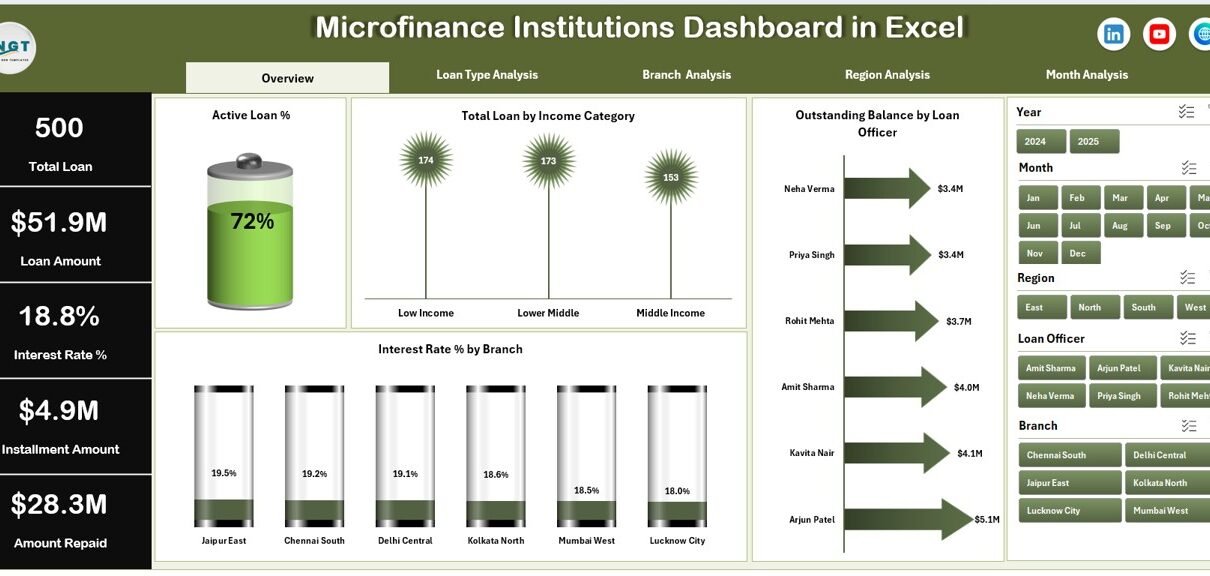
Microfinance Institutions Dashboard in Excel

February 27, 2026February 27, 2026 PKComments Off on Microfinance Institutions Dashboard in Excel
In today’s fast-changing financial ecosystem, microfinance institutions (MFIs) play a critical role in supporting small businesses, rural entrepreneurs, and financially underserved communities. However, managing thousands of small loans, monitoring repayment
Read More
Dashboard

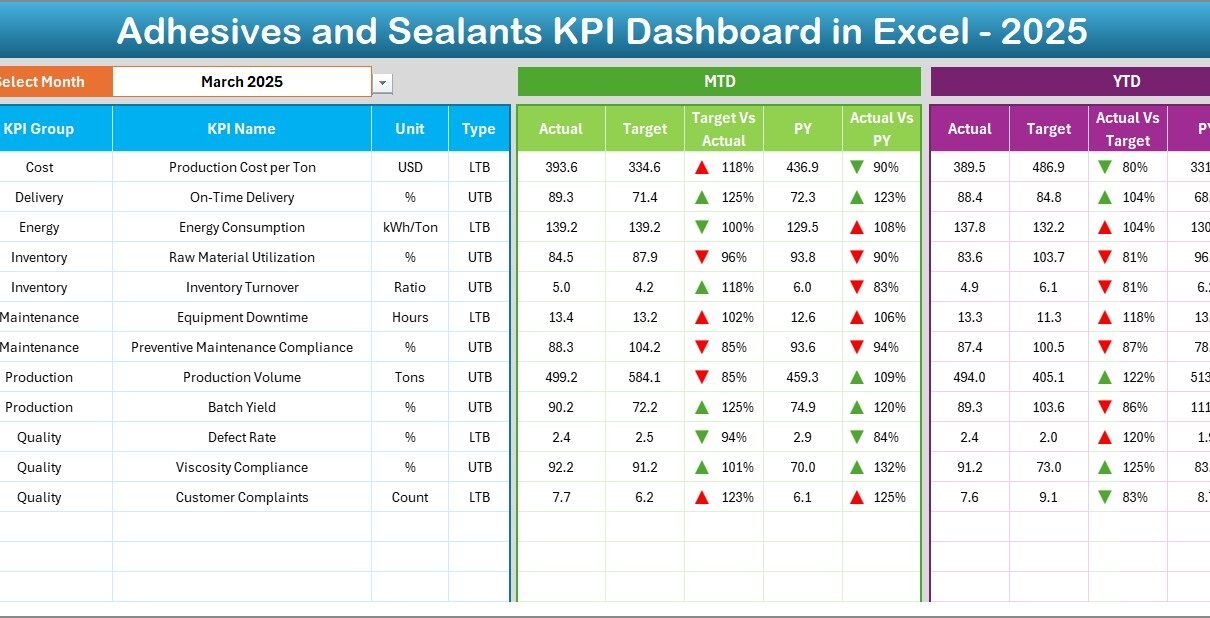
Adhesives and Sealants KPI Dashboard in Excel

February 27, 2026February 27, 2026 PKComments Off on Adhesives and Sealants KPI Dashboard in Excel
In today’s competitive manufacturing environment, companies must monitor performance continuously to remain profitable and efficient. The adhesives and sealants industry, in particular, depends heavily on production efficiency, quality consistency, raw
Read More
Dashboard

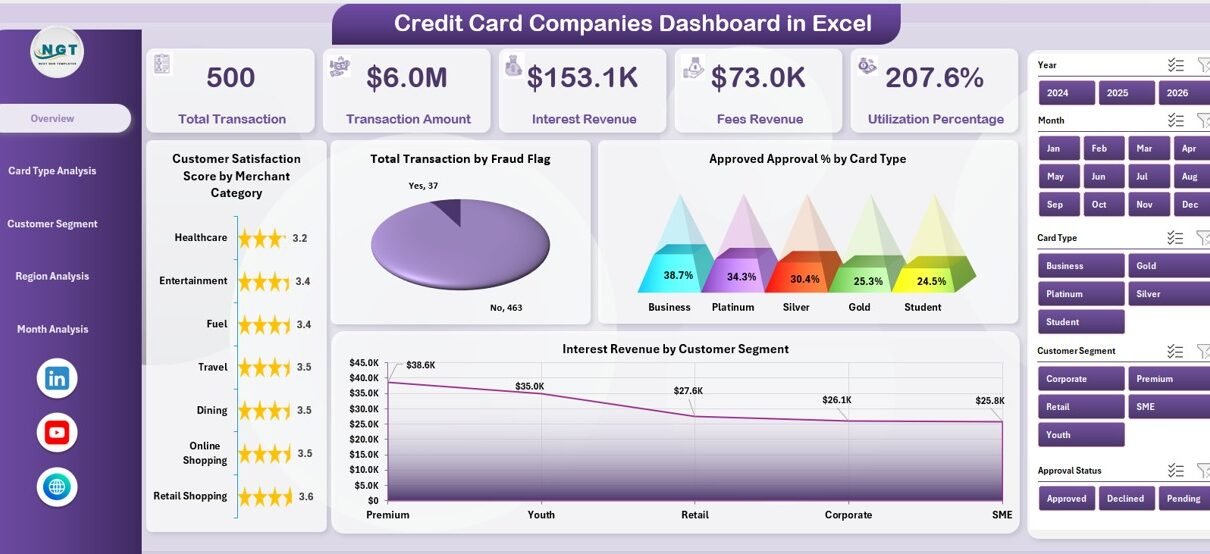
Credit Card Companies Dashboard in Excel

February 26, 2026February 26, 2026 PKComments Off on Credit Card Companies Dashboard in Excel
Credit card companies operate in a highly competitive and data-driven environment. Every day, organizations process thousands of transactions, monitor customer behavior, manage approval rates, analyze fraud risks, and track revenue
Read More
Dashboard

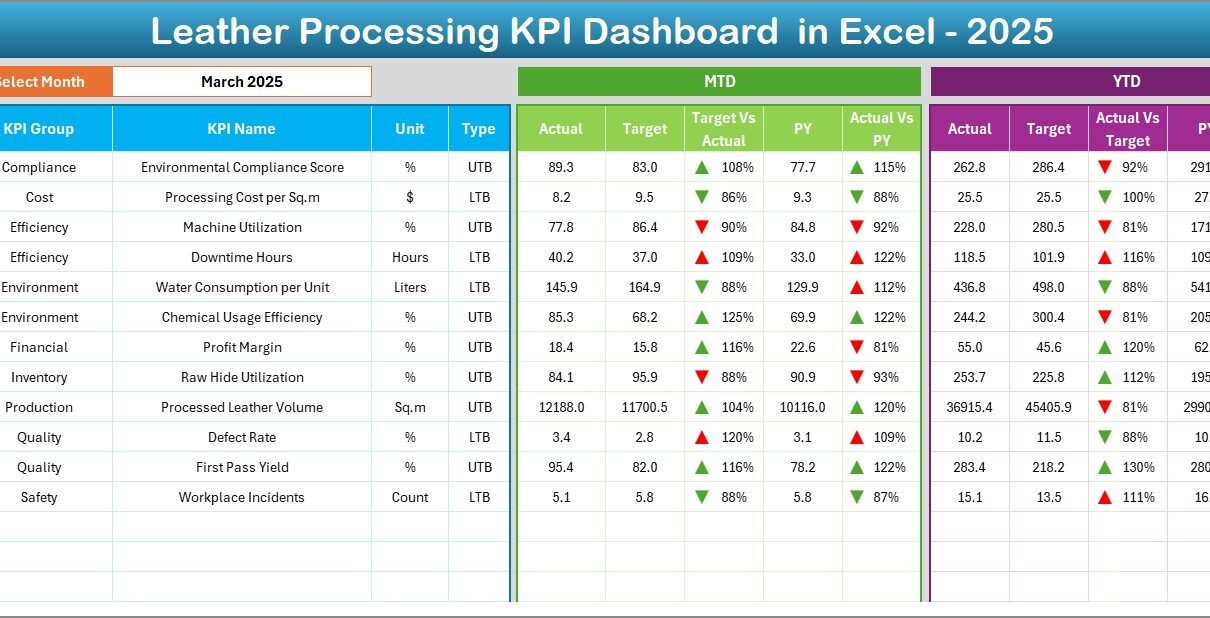
Leather Processing KPI Dashboard in Excel

February 24, 2026February 24, 2026 PKComments Off on Leather Processing KPI Dashboard in Excel
Modern leather processing industries operate in a highly competitive and quality-driven environment. Companies must manage raw material utilization, chemical processing, production efficiency, environmental compliance, and delivery timelines simultaneously. Therefore, businesses
Read More
Templates

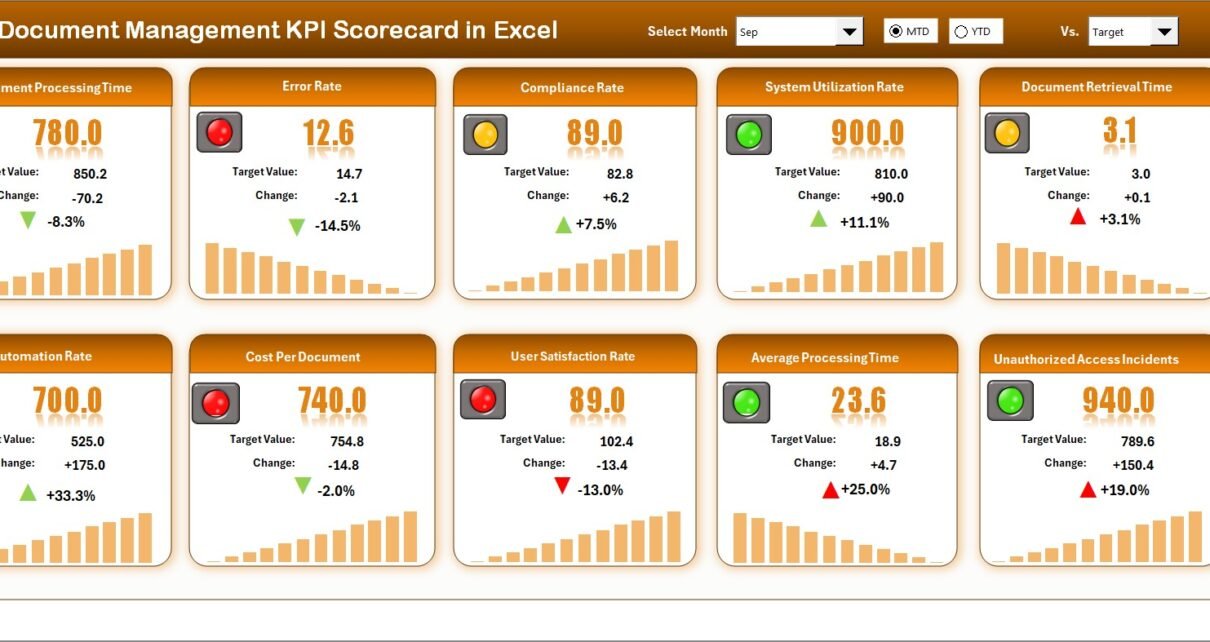
Document Management KPI Scorecard In Excel

February 17, 2026February 17, 2026 PKComments Off on Document Management KPI Scorecard In Excel
Managing documents sounds simple. However, in reality, it becomes complex very quickly. Teams create files daily. Departments share reports. Compliance rules demand accuracy. Meanwhile, managers expect fast access and zero
Read More
Dashboard

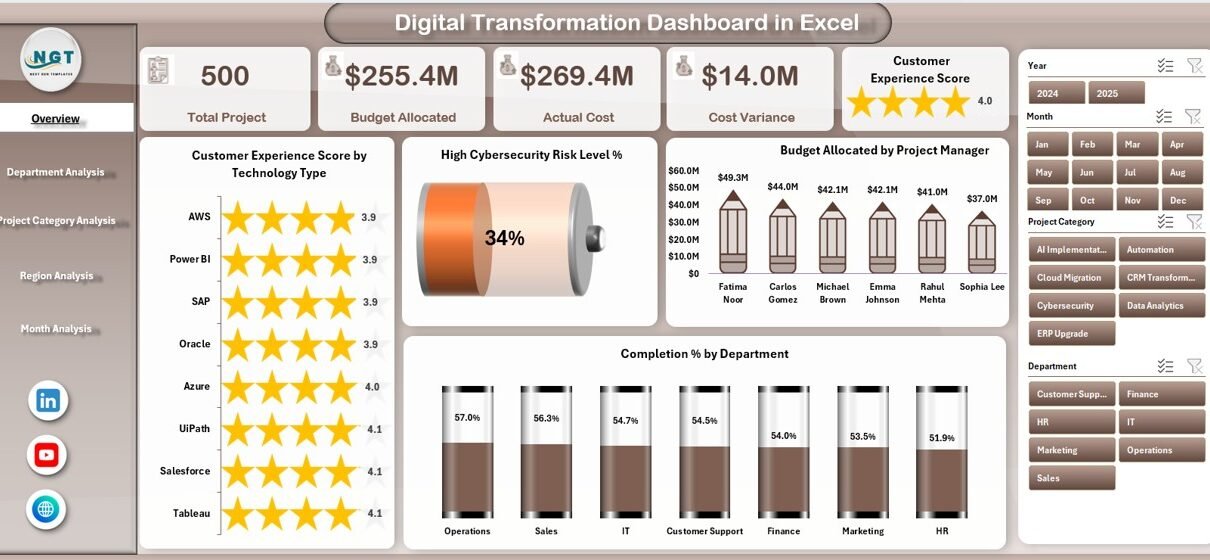
Digital Transformation Dashboard in Excel

February 11, 2026February 11, 2026 PKComments Off on Digital Transformation Dashboard in Excel
This ready-to-use dashboard gives leaders complete visibility into transformation projects. Moreover, it converts raw data into clear, interactive insights. As a result, decision-makers can track performance, control budgets, and improve
Read More

Posts pagination

1 2 Next
  • Learn Excel (Free Course)
    • 1. Shortcut Keys
    • 2. Fill & Flash Fill
    • 3. Find & Replace
    • 4. Sort & Filter
    • 5. Formulas & Functions
    • 6. Data Validation
    • 7. Conditional Formatting
    • 8. Basic Charts
    • 9. Advanced Charts
    • 10. Pivot Tables
    • 11. Excel Dashboards
    • 12. VBA Course
    • 13. Excel Formulas with AI
  • Templates
  • Tutorials
    • Charts and Visualization
    • VBA
    • Excel Tips and Tricks
    • Excel Dashboards
    • Power Pivot & DAX
  • Power BI
  • Template Store
    • Ready to Use Templates
  • Courses
  • Academy
    • Excel + AI Mastery: 100 Formulas
    • Excel Pivot Tables & Dashboards
  • About Us
  • Contact Us
Copyright © 2023 PK-AnExcelExpert.com - Privacy Policy