New: NextGenTemplates Academy - video courses on Excel formulas with AI and Pivot Tables & dashboards. Early-bird: 20% off with code EARLYBIRD20 - first 20 orders only. See the courses →
  • Learn Excel (Free Course)
    • 1. Shortcut Keys
    • 2. Fill & Flash Fill
    • 3. Find & Replace
    • 4. Sort & Filter
    • 5. Formulas & Functions
    • 6. Data Validation
    • 7. Conditional Formatting
    • 8. Basic Charts
    • 9. Advanced Charts
    • 10. Pivot Tables
    • 11. Excel Dashboards
    • 12. VBA Course
    • 13. Excel Formulas with AI
  • Templates
  • Tutorials
    • Charts and Visualization
    • VBA
    • Excel Tips and Tricks
    • Excel Dashboards
    • Power Pivot & DAX
  • Power BI
  • Template Store
    • Ready to Use Templates
  • Courses
  • Academy
    • Excel + AI Mastery: 100 Formulas
    • Excel Pivot Tables & Dashboards
  • About Us
  • Contact Us

PK: An Excel Expert

Transforming Data into Decisions

Tag: Operational Dashboard

Dashboard Power BI

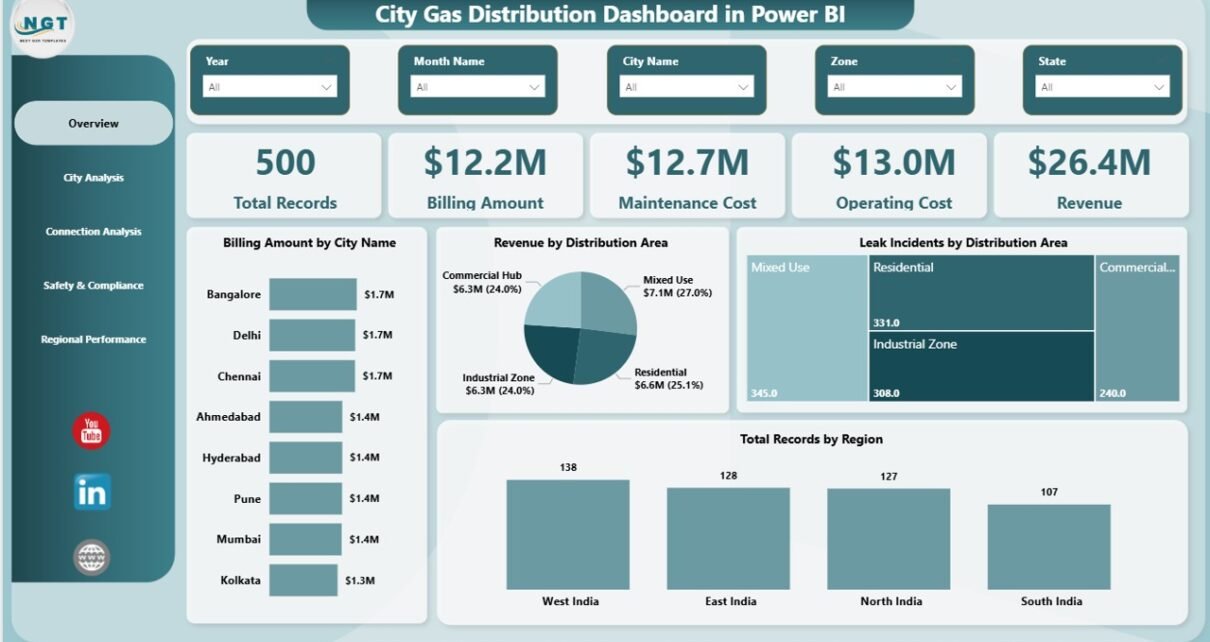
City Gas Distribution Dashboard in Power BI

March 23, 2026March 26, 2026 PKComments Off on City Gas Distribution Dashboard in Power BI
In today’s rapidly growing urban landscape, city gas distribution companies manage massive volumes of operational, financial, and safety data every single day. However, handling this data manually often leads to
Read More
Dashboard Power BI

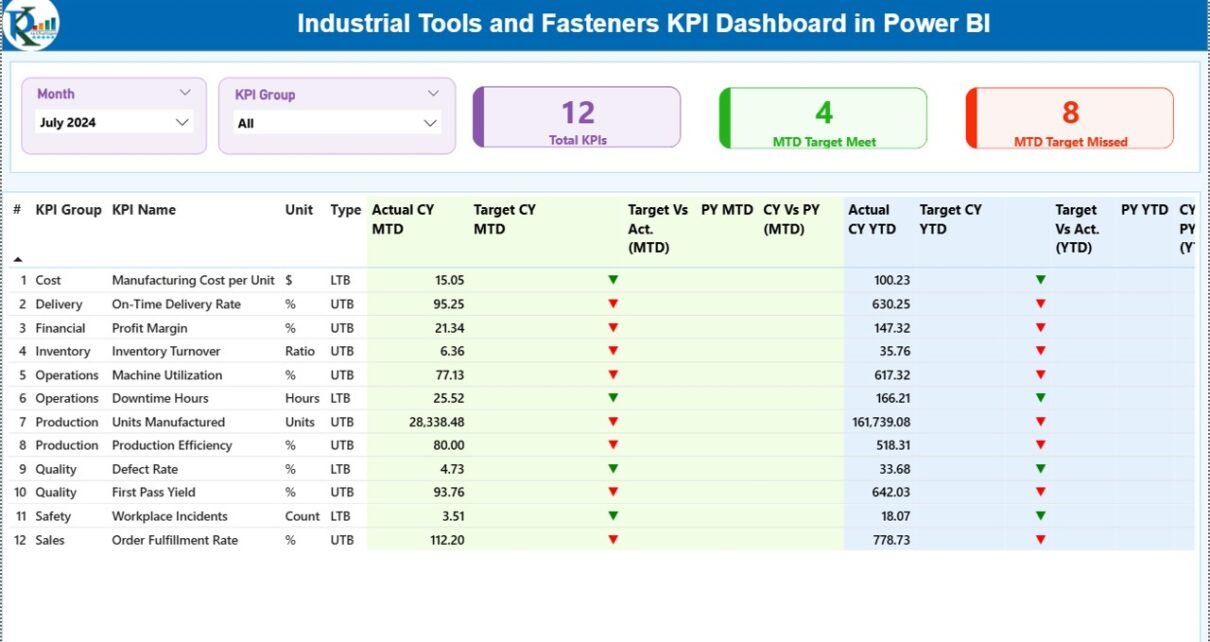
Industrial Tools and Fasteners KPI Dashboard in Power BI

February 28, 2026February 28, 2026 PKComments Off on Industrial Tools and Fasteners KPI Dashboard in Power BI
In today’s competitive manufacturing environment, industrial tools and fasteners companies must monitor performance continuously to maintain quality, control costs, and improve operational efficiency. However, many organizations still depend on scattered
Read More
Dashboard

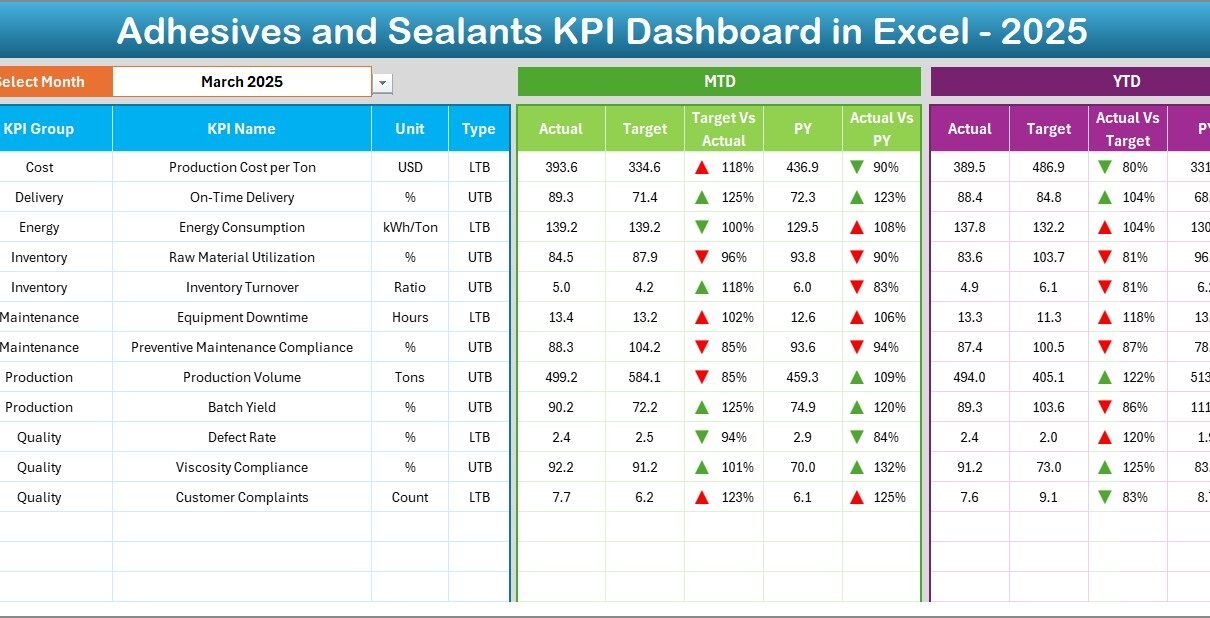
Adhesives and Sealants KPI Dashboard in Excel

February 27, 2026February 27, 2026 PKComments Off on Adhesives and Sealants KPI Dashboard in Excel
In today’s competitive manufacturing environment, companies must monitor performance continuously to remain profitable and efficient. The adhesives and sealants industry, in particular, depends heavily on production efficiency, quality consistency, raw
Read More
Dashboard Power BI

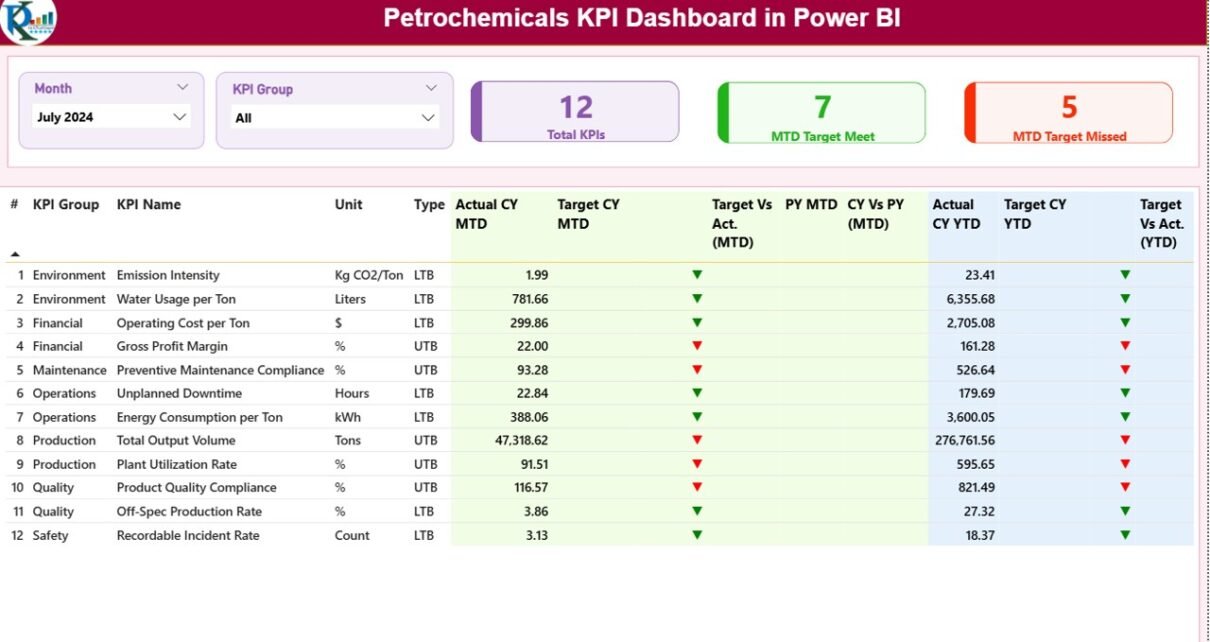
Petrochemicals KPI Dashboard in Power BI

February 26, 2026February 26, 2026 PKComments Off on Petrochemicals KPI Dashboard in Power BI
The petrochemical industry operates in a highly competitive and performance-driven environment. Companies must monitor production efficiency, operational reliability, safety compliance, cost control, and financial performance continuously. However, many organizations still
Read More
Dashboard Power BI

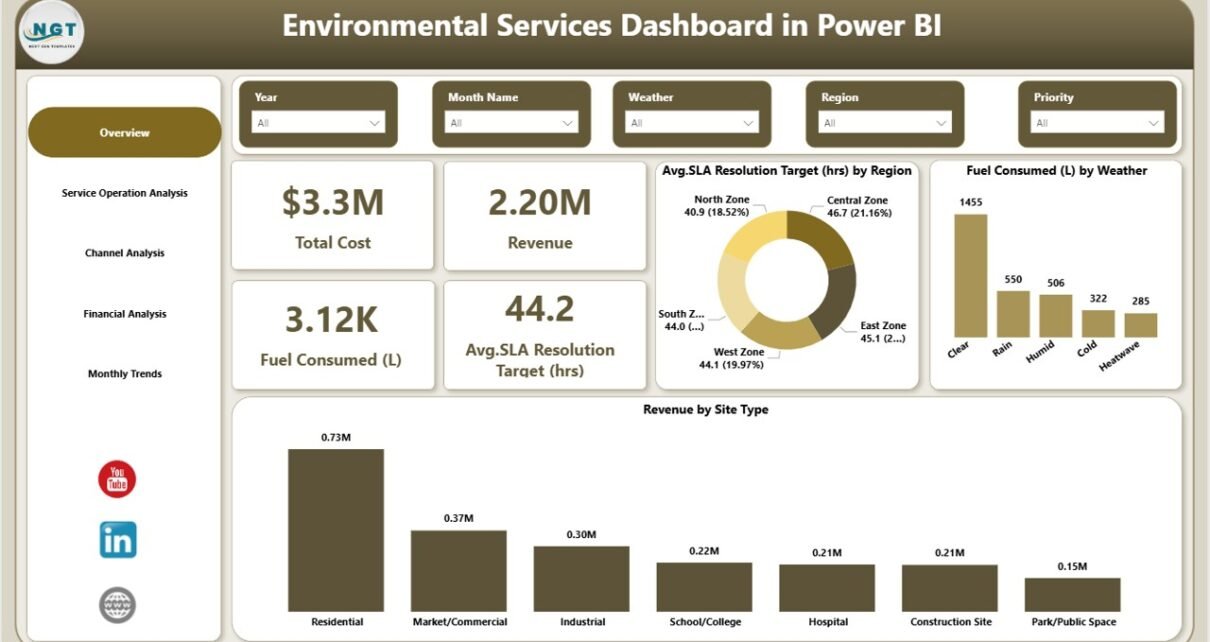
Environmental Services Dashboard in Power BI

February 25, 2026February 25, 2026 PKComments Off on Environmental Services Dashboard in Power BI
Environmental organizations today operate in a data-driven world. Companies that provide environmental services must monitor fuel consumption, emissions reduction, operational efficiency, service response time, and financial performance simultaneously. However, many
Read More
Dashboard Power BI

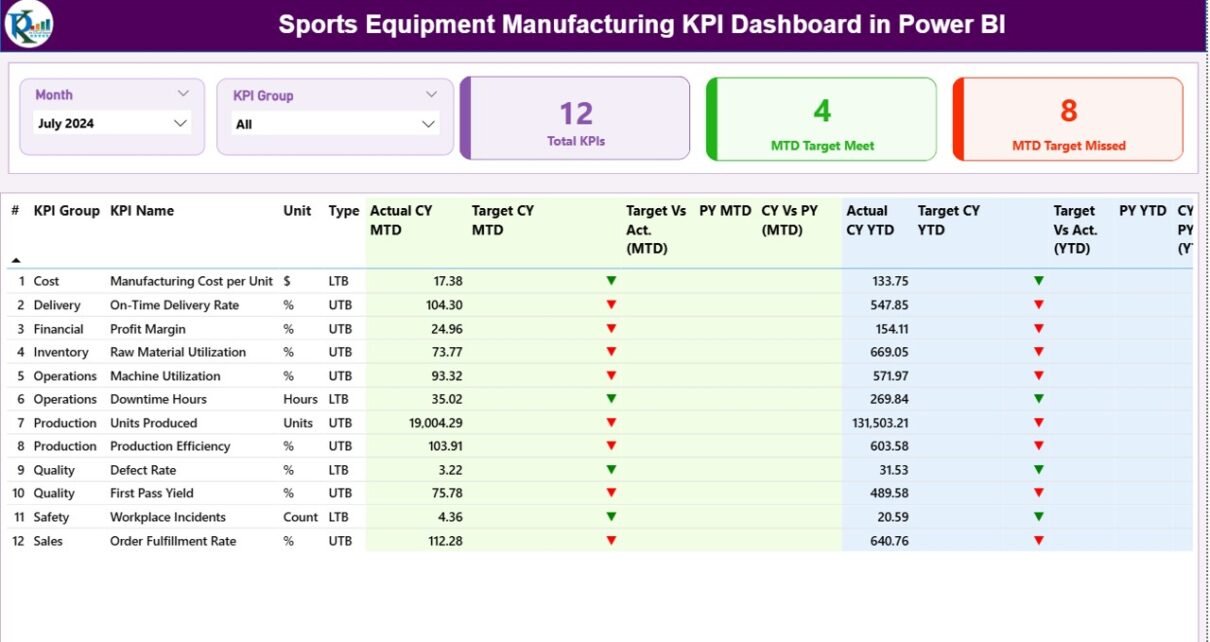
Sports Equipment Manufacturing KPI Dashboard in Power BI

February 25, 2026February 25, 2026 PKComments Off on Sports Equipment Manufacturing KPI Dashboard in Power BI
Modern sports equipment manufacturing operates in a fast-moving and highly competitive environment. Companies manufacture products such as fitness machines, cricket equipment, football gear, athletic footwear, gym accessories, and performance training
Read More
Dashboard

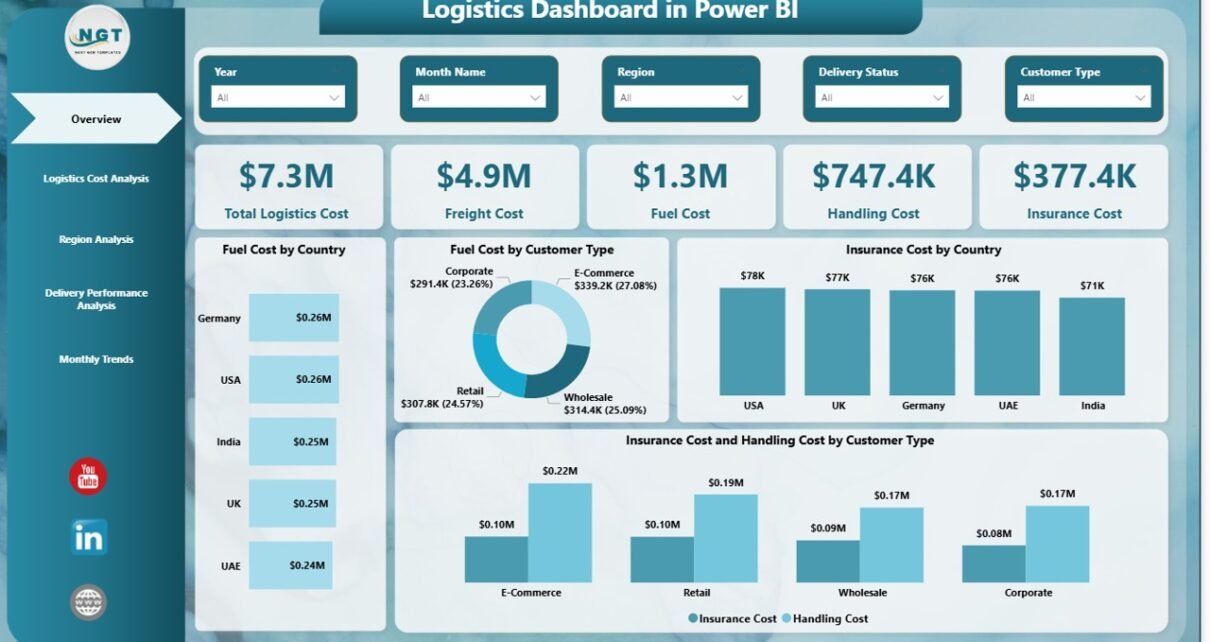
Logistics Dashboard in Power BI

February 25, 2026February 25, 2026 PKComments Off on Logistics Dashboard in Power BI
Modern supply chains generate massive volumes of operational data every single day. Companies manage shipments, warehouses, transportation costs, delivery timelines, fuel expenses, and insurance charges across multiple regions and customers.
Read More
Dashboard

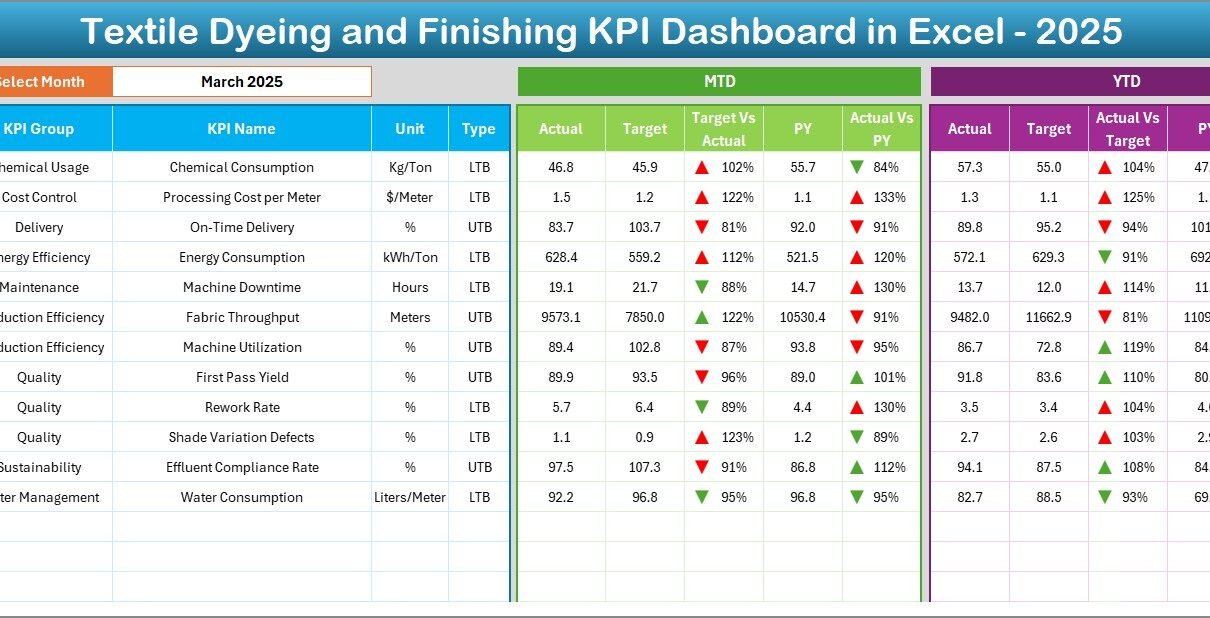
Textile Dyeing and Finishing KPI Dashboard in Excel

February 24, 2026February 24, 2026 PKComments Off on Textile Dyeing and Finishing KPI Dashboard in Excel
The textile industry operates in a highly competitive environment where efficiency, quality, cost control, and delivery timelines determine success. Especially in textile dyeing and finishing operations, even small inefficiencies can
Read More
Dashboard Power BI

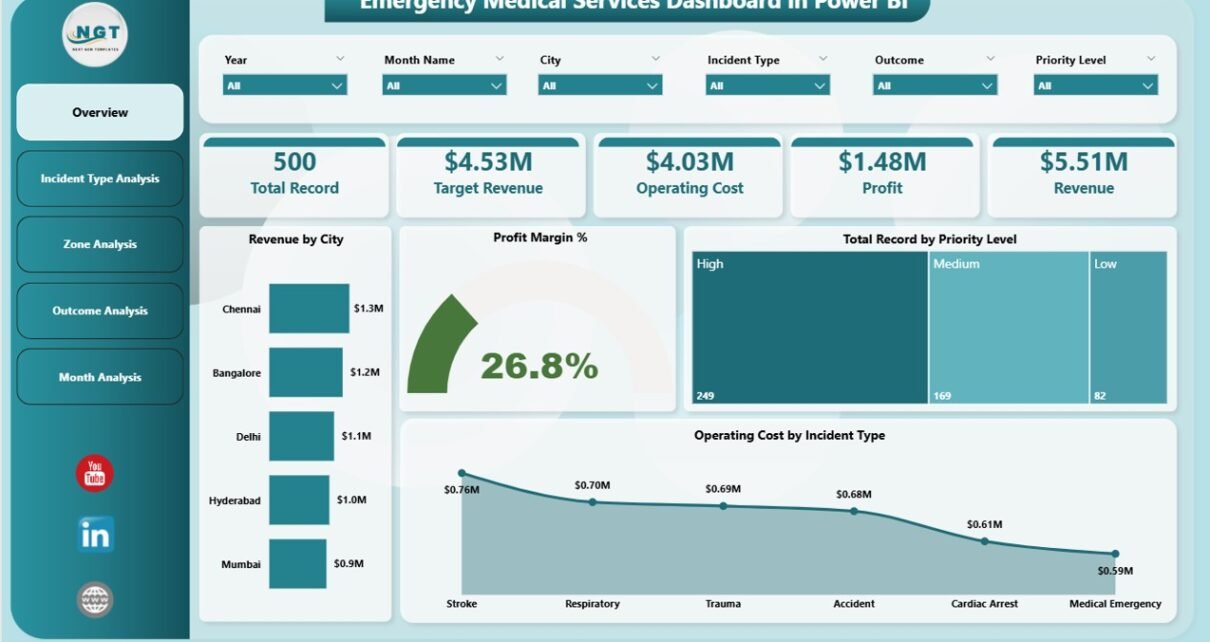
Emergency Medical Services Dashboard in Power BI

February 21, 2026February 21, 2026 PKComments Off on Emergency Medical Services Dashboard in Power BI
Emergency Medical Services (EMS) play a critical role in saving lives. Every second matters during emergencies, and therefore organizations must make fast, accurate, and data-driven decisions. However, many EMS departments
Read More
Dashboard Power BI

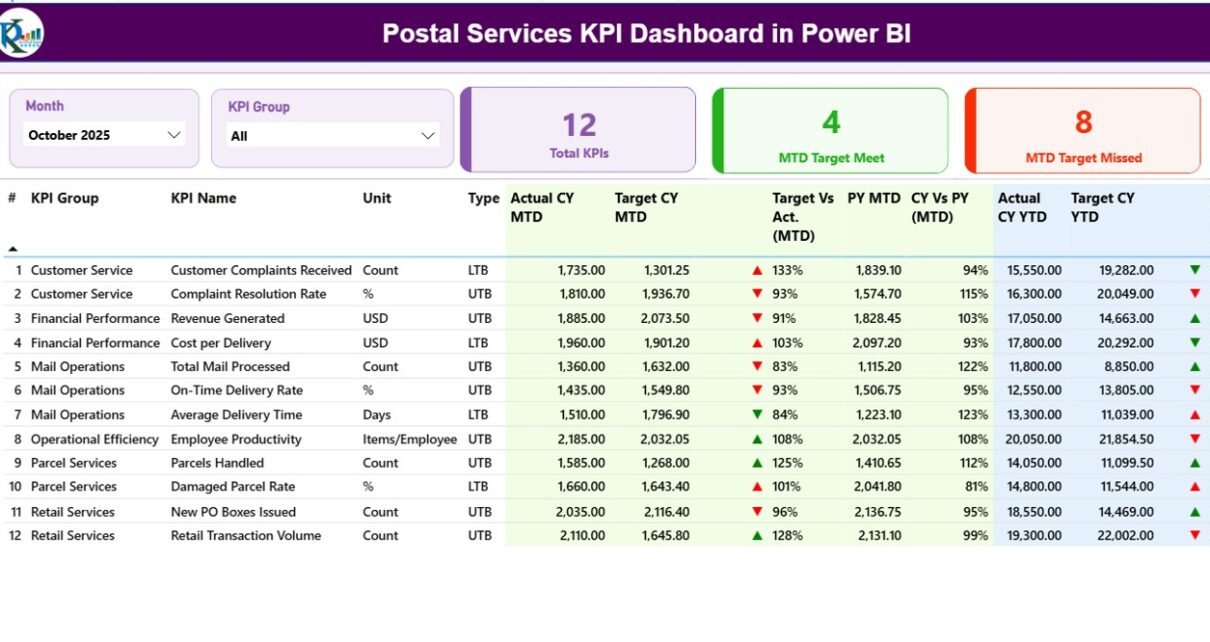
Postal Services KPI Dashboard in Power BI

February 13, 2026February 13, 2026 PKComments Off on Postal Services KPI Dashboard in Power BI
In today’s fast-moving logistics environment, postal organizations must track performance daily. Customers expect fast delivery. Managers demand accuracy. Regulators require compliance. Therefore, postal departments need clear visibility into their KPIs.
Read More

Posts pagination

1 2 Next
  • Learn Excel (Free Course)
    • 1. Shortcut Keys
    • 2. Fill & Flash Fill
    • 3. Find & Replace
    • 4. Sort & Filter
    • 5. Formulas & Functions
    • 6. Data Validation
    • 7. Conditional Formatting
    • 8. Basic Charts
    • 9. Advanced Charts
    • 10. Pivot Tables
    • 11. Excel Dashboards
    • 12. VBA Course
    • 13. Excel Formulas with AI
  • Templates
  • Tutorials
    • Charts and Visualization
    • VBA
    • Excel Tips and Tricks
    • Excel Dashboards
    • Power Pivot & DAX
  • Power BI
  • Template Store
    • Ready to Use Templates
  • Courses
  • Academy
    • Excel + AI Mastery: 100 Formulas
    • Excel Pivot Tables & Dashboards
  • About Us
  • Contact Us
Copyright © 2023 PK-AnExcelExpert.com - Privacy Policy