New: NextGenTemplates Academy - video courses on Excel formulas with AI and Pivot Tables & dashboards. Early-bird: 20% off with code EARLYBIRD20 - first 20 orders only. See the courses →
  • Learn Excel (Free Course)
    • 1. Shortcut Keys
    • 2. Fill & Flash Fill
    • 3. Find & Replace
    • 4. Sort & Filter
    • 5. Formulas & Functions
    • 6. Data Validation
    • 7. Conditional Formatting
    • 8. Basic Charts
    • 9. Advanced Charts
    • 10. Pivot Tables
    • 11. Excel Dashboards
    • 12. VBA Course
    • 13. Excel Formulas with AI
  • Templates
  • Tutorials
    • Charts and Visualization
    • VBA
    • Excel Tips and Tricks
    • Excel Dashboards
    • Power Pivot & DAX
  • Power BI
  • Template Store
    • Ready to Use Templates
  • Courses
  • Academy
    • Excel + AI Mastery: 100 Formulas
    • Excel Pivot Tables & Dashboards
  • About Us
  • Contact Us

PK: An Excel Expert

Transforming Data into Decisions

Tag: Performance Monitoring

Dashboard Templates

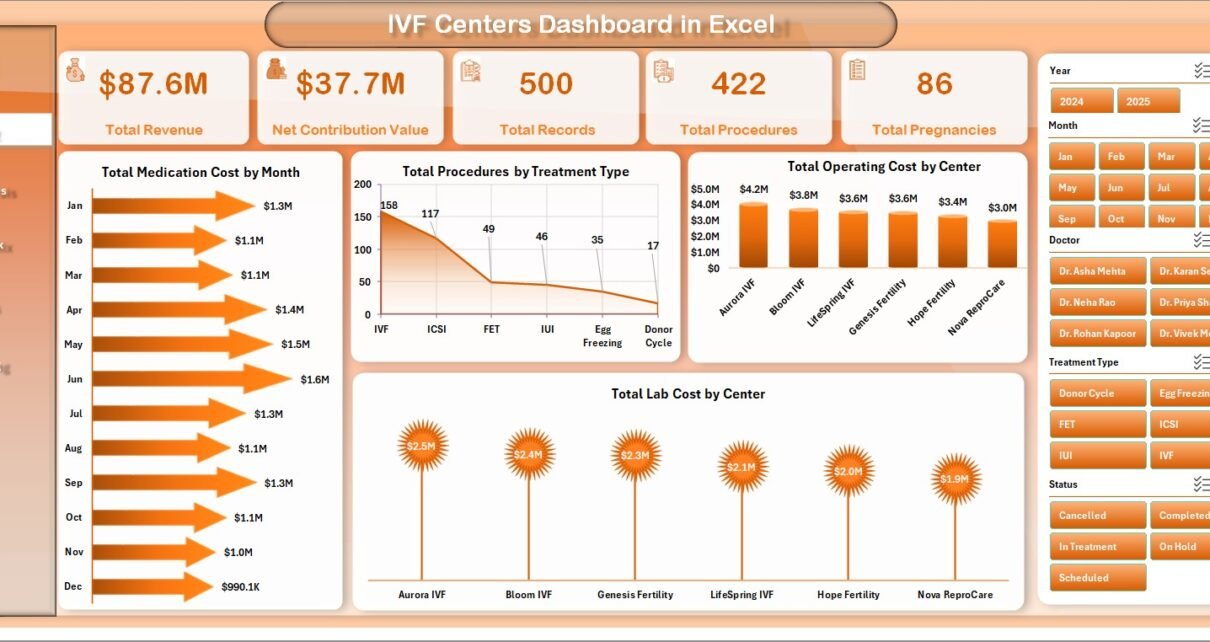
IVF Centers Dashboard in Excel

June 27, 2026June 27, 2026 PKComments Off on IVF Centers Dashboard in Excel
Introduction IVF Centers Dashboard in Excel is a ready-to-use reporting template for fertility clinics, IVF centers, healthcare analysts, and operations teams that need clean visibility into revenue, procedures, pregnancies, treatment
Read More
Templates

IVF Centers KPI Dashboard in Excel

March 21, 2026March 21, 2026 PKComments Off on IVF Centers KPI Dashboard in Excel
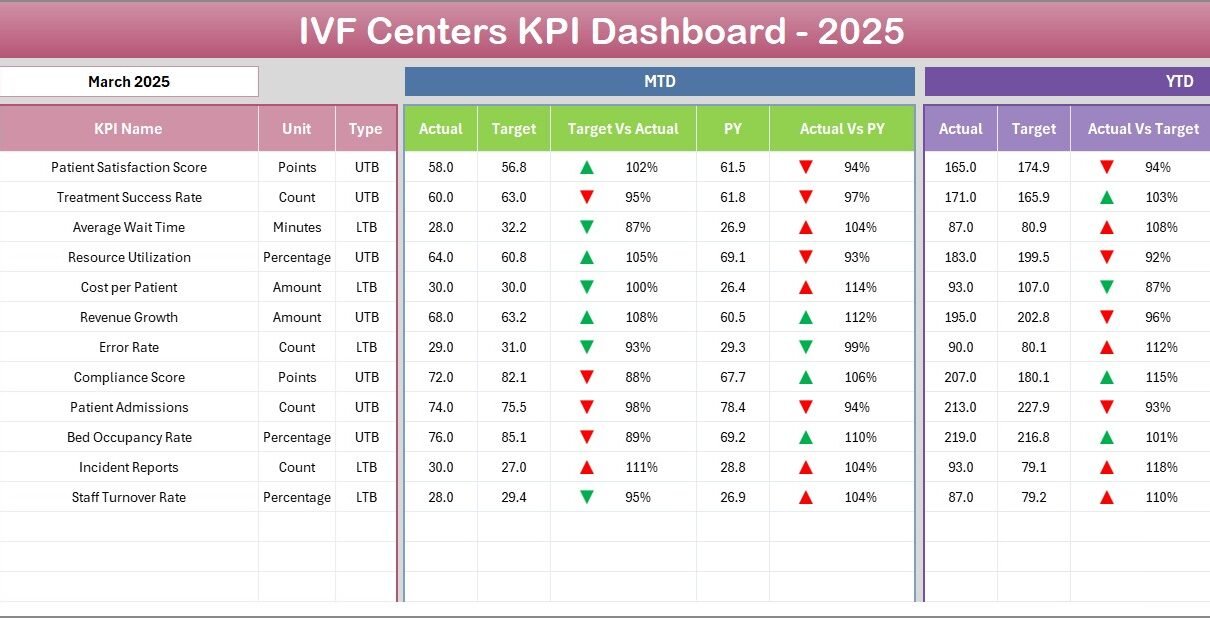
Introduction The IVF Centers KPI Dashboard is an invaluable tool designed to streamline performance tracking for IVF clinics. With this ready-to-use template, IVF centers can monitor key metrics in real-time,
Read More
Dashboard Power BI

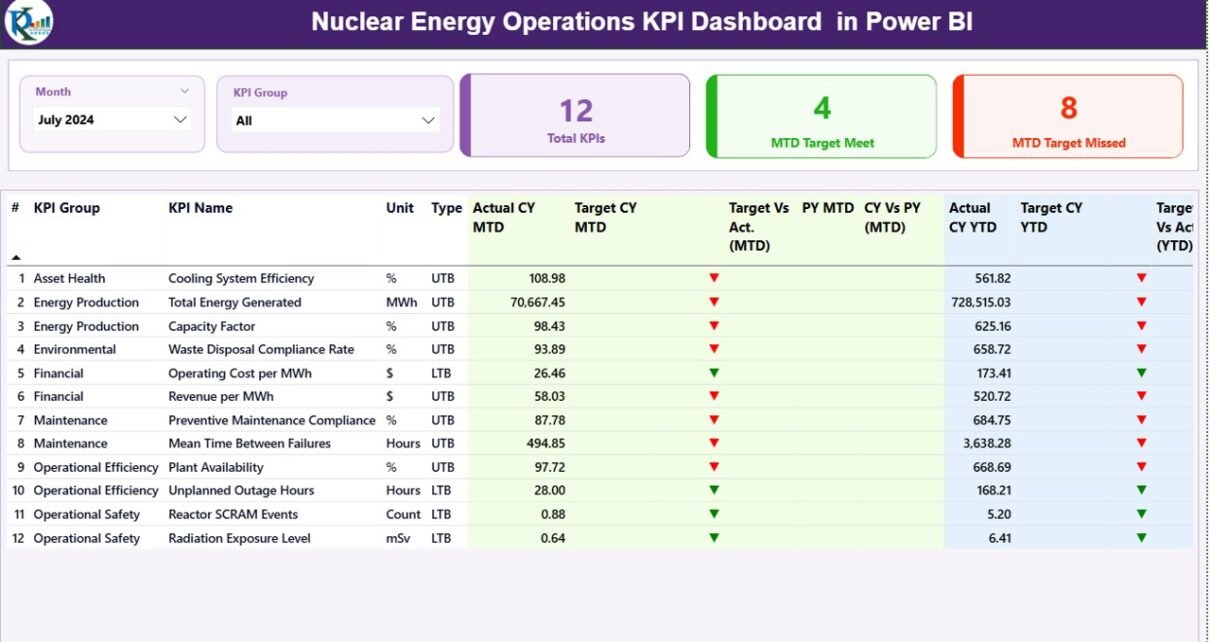
Nuclear Energy Operations KPI Dashboard in Power BI

March 3, 2026March 3, 2026 PKComments Off on Nuclear Energy Operations KPI Dashboard in Power BI
Managing nuclear energy operations requires precision, discipline, and continuous monitoring. Every decision impacts safety, regulatory compliance, plant efficiency, and financial stability. Therefore, organizations must track performance indicators in a structured
Read More
Templates

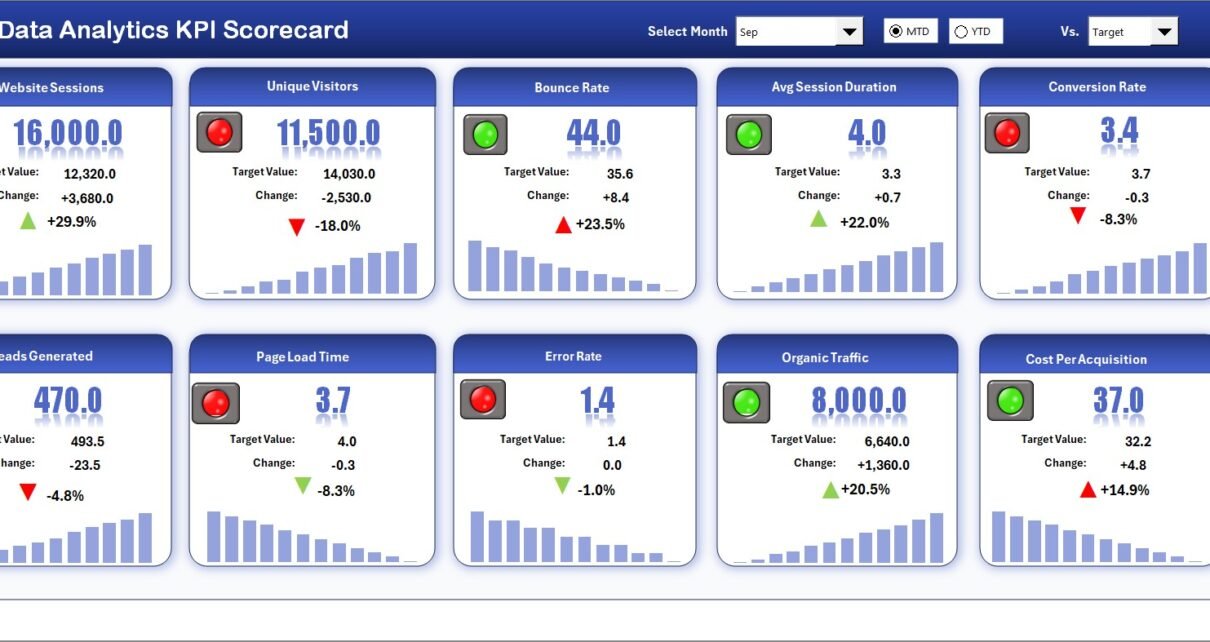
Data Analytics KPI Scorecard in Excel

February 28, 2026February 28, 2026 PKComments Off on Data Analytics KPI Scorecard in Excel
In today’s data-driven business environment, organizations rely heavily on data analytics to make smarter decisions, improve operational efficiency, and gain competitive advantages. Companies collect massive volumes of data every day.
Read More
Dashboard Power BI

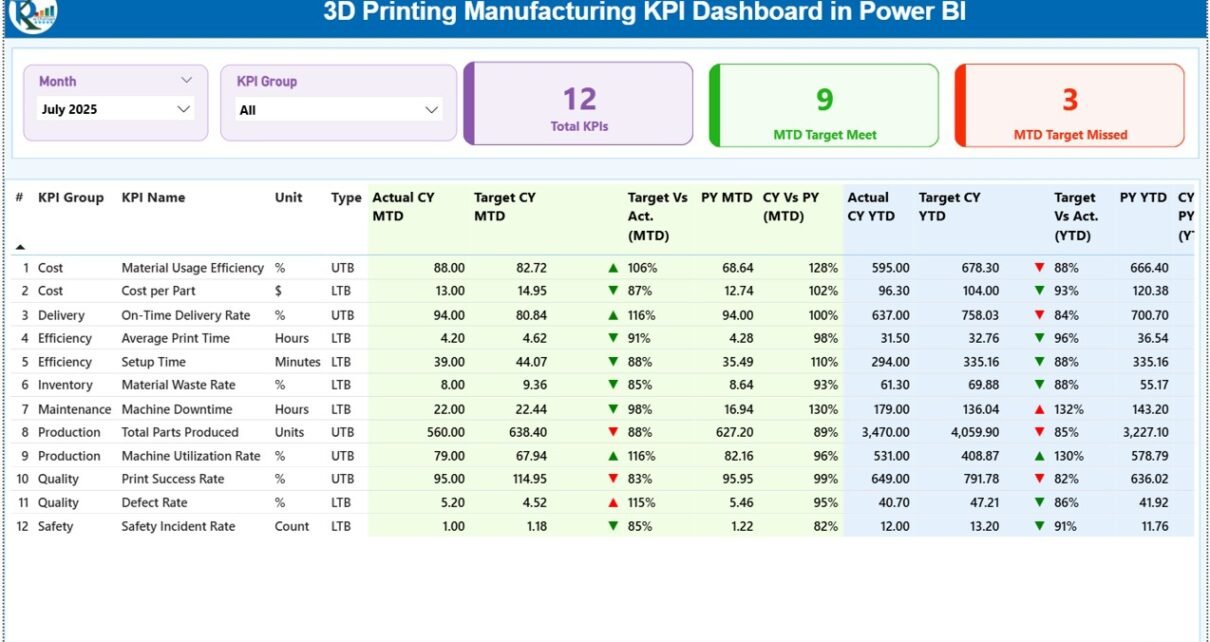
3D Printing Manufacturing KPI Dashboard in Power BI

February 28, 2026February 28, 2026 PKComments Off on 3D Printing Manufacturing KPI Dashboard in Power BI
In today’s rapidly evolving manufacturing landscape, 3D printing (additive manufacturing) has changed how companies design, prototype, and produce components. Businesses now manufacture complex parts faster, reduce material waste, and improve
Read More
Dashboard

3D Printing Manufacturing KPI Dashboard in Excel

February 28, 2026February 28, 2026 PKComments Off on 3D Printing Manufacturing KPI Dashboard in Excel
In today’s advanced manufacturing environment, 3D printing (additive manufacturing) has transformed how companies design, prototype, and produce products. Organizations now manufacture complex components faster, reduce material waste, and improve customization
Read More
Dashboard

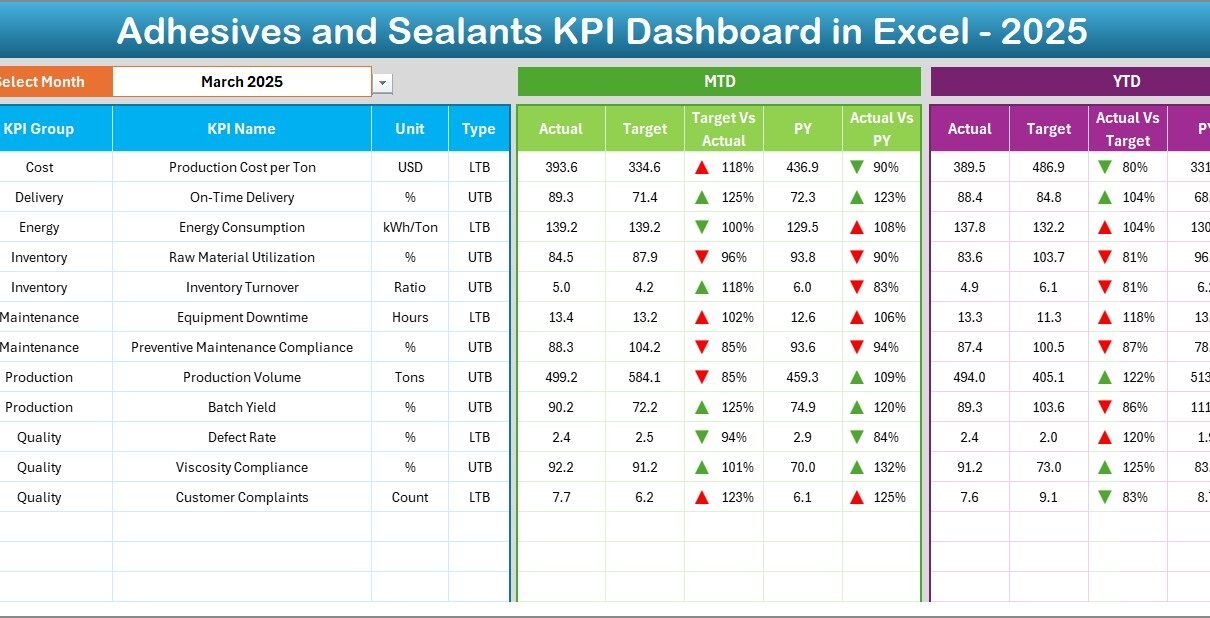
Adhesives and Sealants KPI Dashboard in Excel

February 27, 2026February 27, 2026 PKComments Off on Adhesives and Sealants KPI Dashboard in Excel
In today’s competitive manufacturing environment, companies must monitor performance continuously to remain profitable and efficient. The adhesives and sealants industry, in particular, depends heavily on production efficiency, quality consistency, raw
Read More
Dashboard Power BI

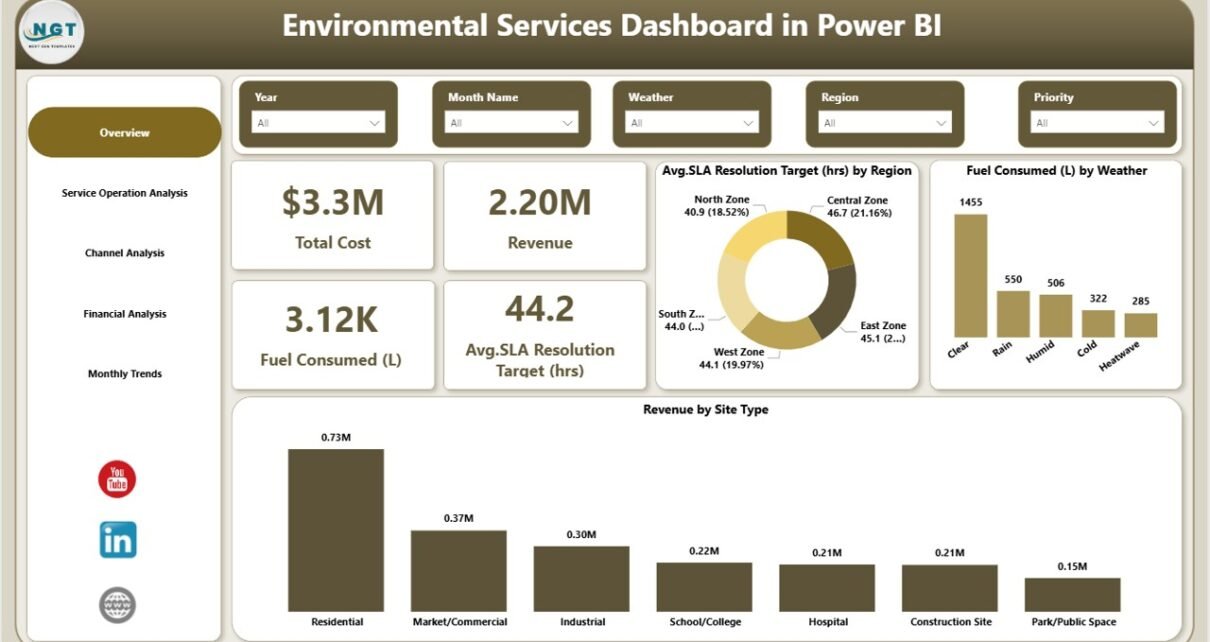
Environmental Services Dashboard in Power BI

February 25, 2026February 25, 2026 PKComments Off on Environmental Services Dashboard in Power BI
Environmental organizations today operate in a data-driven world. Companies that provide environmental services must monitor fuel consumption, emissions reduction, operational efficiency, service response time, and financial performance simultaneously. However, many
Read More
Dashboard Power BI

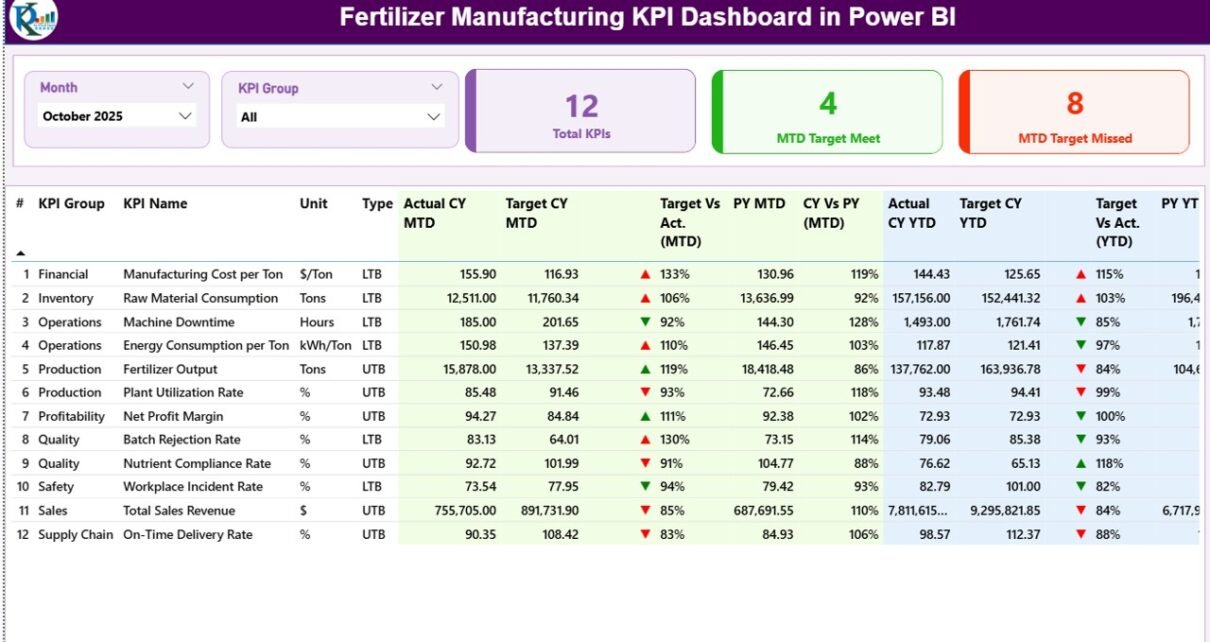
Fertilizer Manufacturing KPI Dashboard in Power BI

February 25, 2026February 25, 2026 PKComments Off on Fertilizer Manufacturing KPI Dashboard in Power BI
Modern fertilizer manufacturing companies operate in a highly competitive and performance-driven environment. Every day, plants manage production volumes, raw material consumption, quality standards, energy efficiency, and operational costs. However, many
Read More
Dashboard Power BI

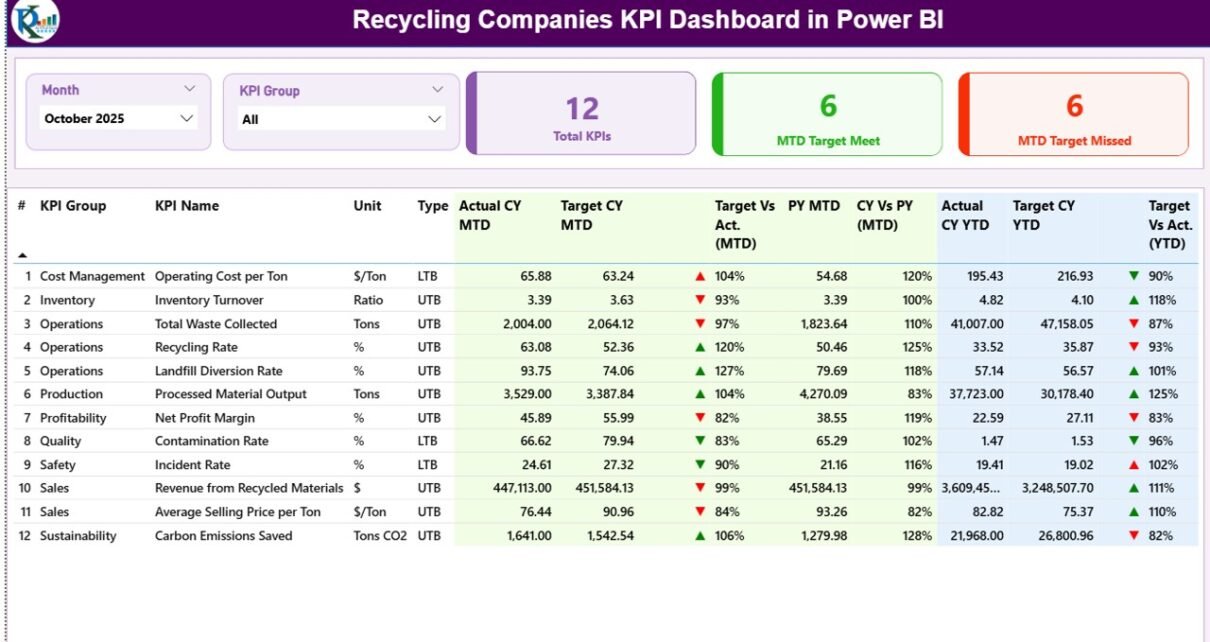
Recycling Companies KPI Dashboard in Power BI

February 21, 2026February 21, 2026 PKComments Off on Recycling Companies KPI Dashboard in Power BI
In today’s sustainability-driven world, recycling companies must track performance with accuracy and speed. However, many recycling plants still rely on scattered spreadsheets and manual reports. As a result, managers often
Read More

Posts pagination

1 2 … 5 Next
  • Learn Excel (Free Course)
    • 1. Shortcut Keys
    • 2. Fill & Flash Fill
    • 3. Find & Replace
    • 4. Sort & Filter
    • 5. Formulas & Functions
    • 6. Data Validation
    • 7. Conditional Formatting
    • 8. Basic Charts
    • 9. Advanced Charts
    • 10. Pivot Tables
    • 11. Excel Dashboards
    • 12. VBA Course
    • 13. Excel Formulas with AI
  • Templates
  • Tutorials
    • Charts and Visualization
    • VBA
    • Excel Tips and Tricks
    • Excel Dashboards
    • Power Pivot & DAX
  • Power BI
  • Template Store
    • Ready to Use Templates
  • Courses
  • Academy
    • Excel + AI Mastery: 100 Formulas
    • Excel Pivot Tables & Dashboards
  • About Us
  • Contact Us
Copyright © 2023 PK-AnExcelExpert.com - Privacy Policy