Colleges, universities, and K-12 private schools track 8–20 admissions-funnel KPIs every month — but according to EDUCAUSE research, fewer than 40% of higher-education institutions have a standardized, consistent process for tracking enrollment performance against targets. The Student Enrollment KPI Scorecard in Excel closes that gap: 4 structured worksheets, dropdown-driven MTD and YTD views, Actual vs. Target comparisons, and color-coded performance indicators — all in a single Excel file that takes under 10 minutes to set up.
Whether you run admissions at a 200-student private school or oversee enrollment management at a multi-campus university system, manually assembling monthly KPI reports from scattered spreadsheets is slow and error-prone. This ready-to-use scorecard replaces fragmented files and $500–$5,000/year enrollment-analytics SaaS subscriptions with a formula-driven, fully customizable Excel template designed specifically for admissions-funnel performance monitoring.
Click here to Purchase the Student Enrollment KPI Scorecard in Excel
Key Features of the Student Enrollment KPI Scorecard in Excel
The Student Enrollment KPI Scorecard in Excel includes 4 worksheets designed for structured admissions performance monitoring across any institution type. It tracks application conversion rate, yield rate, deposit rate, melt rate, time-to-decision, cost per enrolled student, first-year retention, and any other admissions KPIs your institution defines. Here are the main features:
- Dropdown-Driven Scorecard View — Select any month from the dropdown on the Scorecard sheet and the entire enrollment performance view refreshes instantly for MTD or YTD analysis, displaying Actual vs. Target values and color-coded status indicators for every funnel KPI.
- Per-KPI Trend Analysis — The KPI Trend sheet lets you select any single enrollment KPI from a dropdown to view its Group, Unit, Type (Lower the Better or Upper the Better), Formula, and Definition alongside MTD and YTD charts comparing Actual, Target, and Previous Year numbers across all 12 months.
- Structured Data Entry — The Input Data sheet provides a clean, organized layout for recording monthly actuals, targets, and historical data for each KPI, keeping the Student Enrollment KPI Scorecard in Excel current as admissions-cycle results flow in.
- Built-in KPI Knowledge Base — The KPI Definition sheet stores each KPI’s name, group, unit, formula, and definition so every stakeholder — from admissions counselors to deans of enrollment to accreditation reviewers — interprets each metric consistently.
- Automatic Calculations — All MTD, YTD, variance, and conditional formatting calculations are formula-driven. Replace or add data and every view updates automatically with zero manual chart rebuilds.
- No VBA or Macros — Built entirely on native Excel formulas, conditional formatting, and data validation. Compatible with Excel 2016, 2019, 2021, Microsoft 365 on Windows and Mac, and Excel Online.
Scorecard Sheets Explanation — How the Student Enrollment KPI Scorecard in Excel Is Structured
The Student Enrollment KPI Scorecard in Excel contains 4 carefully structured worksheets. Here is a detailed walkthrough of each sheet and how to use it.
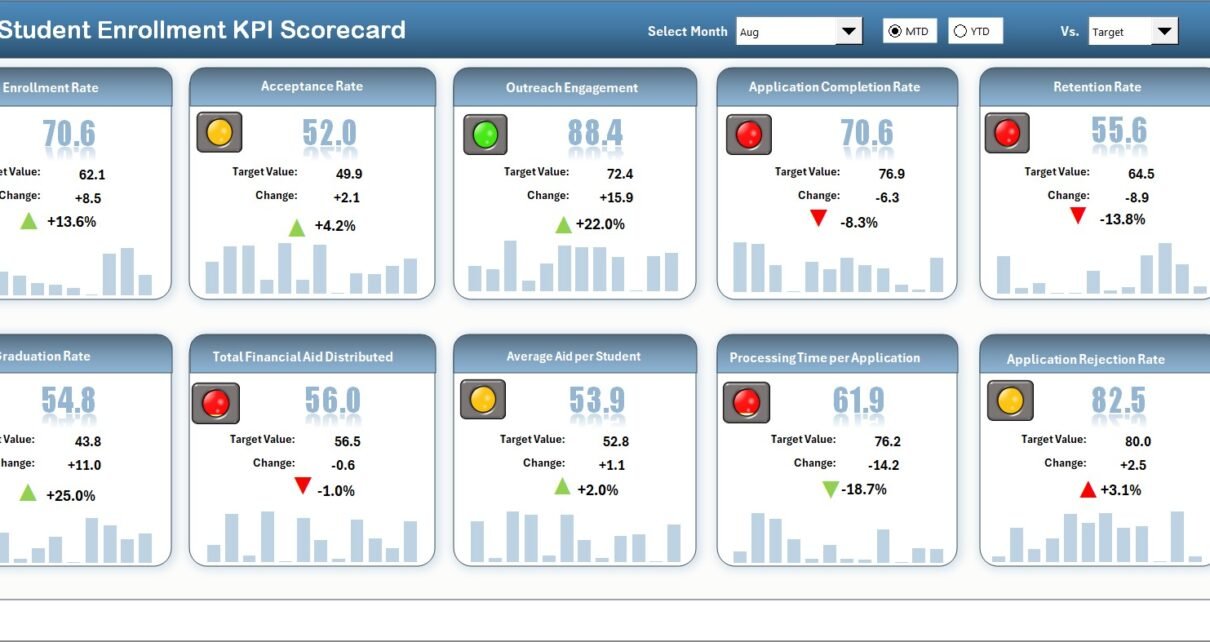
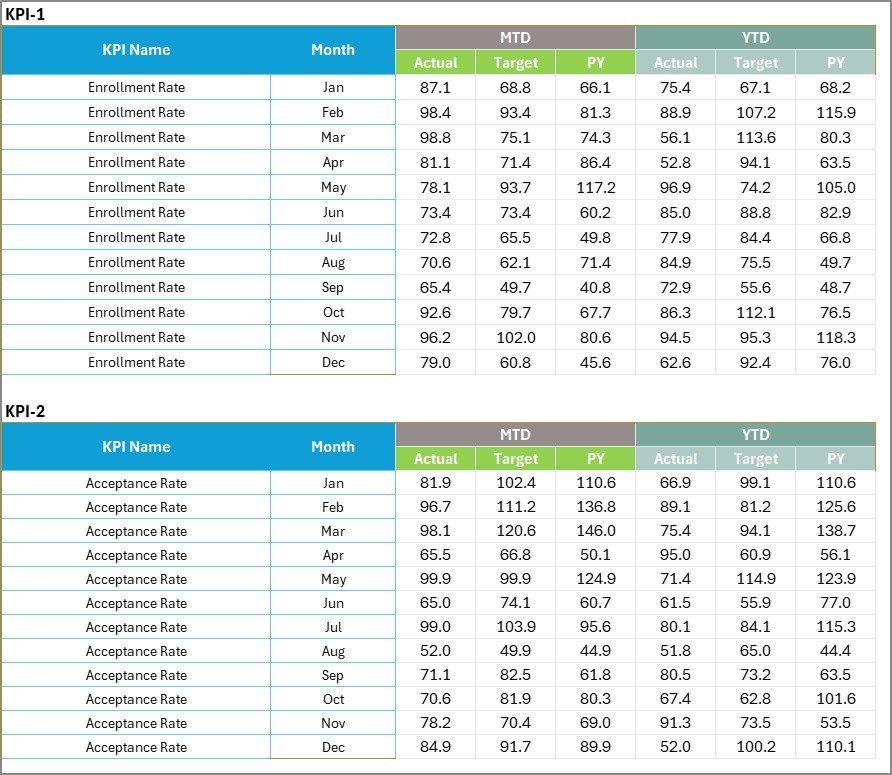
1. Scorecard Sheet
Student Enrollment KPI Scorecard in Excel — Scorecard Sheet
Click here to Purchase the Student Enrollment KPI Scorecard in Excel
The Scorecard sheet is the main interface where admissions directors and enrollment managers review every Student Enrollment KPI at a glance. Key features include:
- Dropdown Menus: Select any month plus MTD or YTD view for performance analysis. The entire scorecard refreshes instantly.
- Actual vs Target Values: Compare actual performance against monthly targets for each enrollment KPI side by side, so admissions leadership immediately sees where the funnel is exceeding or lagging.
- Visual Indicators: Color-coded conditional formatting flags every metric — green for on/above target, amber for near threshold, red for below target — without reading individual numbers.
- Comprehensive Overview: Every relevant Student Enrollment KPI in one view, with MTD and YTD comparisons. This is the go-to sheet for weekly admissions meetings and board enrollment reviews.
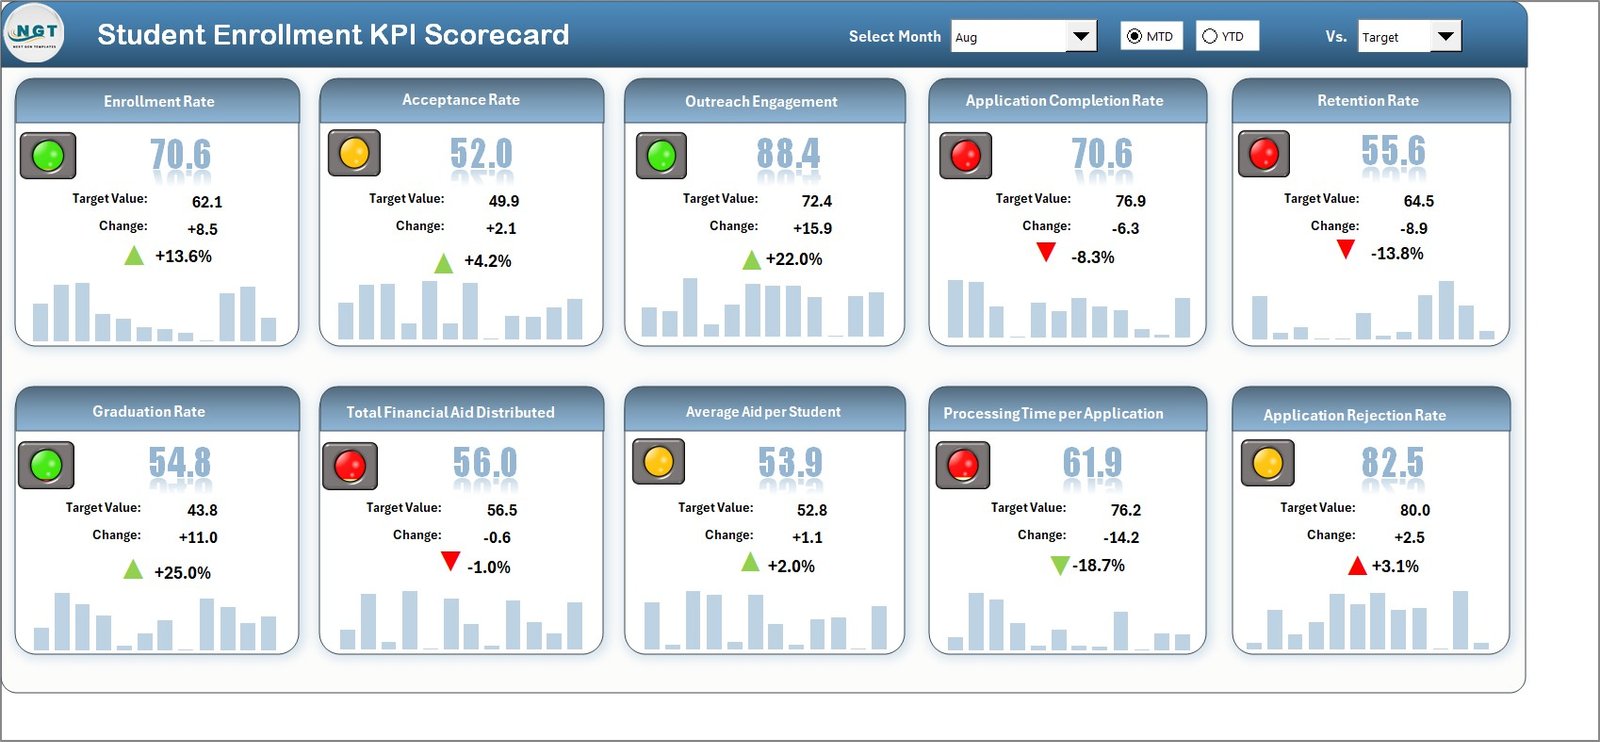
2. KPI Trend Sheet
KPI Trend Sheet
The KPI Trend sheet gives you a deep-dive view of any individual Student Enrollment KPI. Select the KPI name from the dropdown on cell C3 and the sheet displays the KPI Group, Unit, Type (Lower the Better or Upper the Better), Formula, and Definition.
Below this metadata, the sheet shows MTD and YTD trend charts plotting Actual, Target, and Previous Year numbers across all 12 months — giving admissions teams the context needed to spot seasonal application surges, year-over-year yield drops, or consistent funnel leakage before it locks in.
3. Input Data Sheet
Input Data Sheet
Click here to Purchase the Student Enrollment KPI Scorecard in Excel
The Input Data sheet is where you enter all admissions KPI data — actual values, targets, and previous-year numbers for each KPI and each month of the cycle. The flexible layout lets you update inquiries, applications, admits, deposits, melt, and matriculation figures as new results land, keeping the Scorecard and KPI Trend sheets always current with no manual chart rebuilding.
4. KPI Definition Sheet
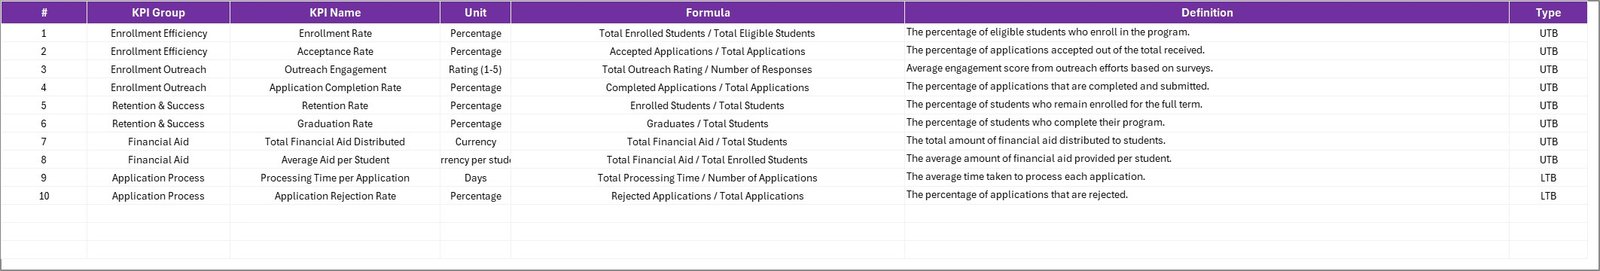
KPI Definition Sheet
On this sheet you enter the KPI Name, KPI Group, Unit, Formula, and Definition for every enrollment metric you want to track. This becomes the authoritative reference for all stakeholders — from admissions counselors and institutional research staff to external accreditation reviewers — ensuring everyone interprets each Student Enrollment KPI consistently and that definitions are documented for compliance and audit purposes.
Student Enrollment KPI Scorecard in Excel vs. Google Sheets Scorecard vs. Paid Enrollment-Analytics SaaS — Feature Comparison
| Feature | Student Enrollment KPI Scorecard in Excel | Google Sheets Scorecard | Paid SaaS (Slate Analytics / Salesforce EDA / Qualtrics XM) |
|---|---|---|---|
| Cost | $12.99 one-time | Free (DIY build, 1–3 days) | $500–$5,000+ per year |
| Platform | Excel 2016+, Microsoft 365, Mac | Google Sheets (browser) | Cloud SaaS, IT-led onboarding |
| Setup time | Under 10 minutes | 1–3 days from scratch | 4–12 weeks (SIS integration) |
| Offline access | ✅ Full offline | ❌ Internet required | ❌ Web-only |
| MTD/YTD trend charts per KPI | ✅ Built-in | ❌ Build manually | ✅ Configurable |
| KPI Definition reference | ✅ Built-in sheet | ❌ Manual setup | ✅ Built-in |
| Customizable enrollment KPIs | ✅ Unlimited | ✅ Manual setup | Limited to plan tier |
| Year-1 cost at 5 enrollment staff | $12.99 total | $0 + dev time | $2,500–$25,000+ |
| No IT integration needed | ✅ Yes | ✅ Yes | ❌ Often required |
For admissions offices that want structured KPI tracking with MTD/YTD trends and color-coded indicators without paying enterprise analytics pricing, the Student Enrollment KPI Scorecard in Excel sits in the sweet spot.
Who Should Use This Template
✅ Perfect for:
- Directors and VPs of Enrollment Management at colleges, universities, and K-12 private schools needing monthly admissions KPI tracking against targets
- Admissions managers and counselors monitoring inquiry-to-application, application-to-admit, and admit-to-deposit conversion rates
- Institutional research officers preparing MTD and YTD admissions-cycle reports for deans, provosts, and trustees
- Accreditation coordinators who need documented KPI definitions, formulas, and trend data for SACSCOC, HLC, NEASC, and similar reviews
- Higher-education consultants delivering enrollment performance scorecards to multiple institutional clients
❌ Not a fit if:
- You need live SIS feeds from Banner, PeopleSoft, or Workday Student with automatic refresh
- Your institution requires multi-user role-based access, SSO, or SOC 2 audit logging for thousands of users
- You need real-time CRM-style applicant tracking with phone, email, and SMS workflow automation
Real-World Use Cases
👉 Click here to Purchase the Student Enrollment KPI Scorecard in Excel
Anita is the Director of Admissions at a mid-size liberal arts college. She uses the Student Enrollment KPI Scorecard in Excel to track 14 funnel KPIs — including inquiry-to-application rate, yield rate, deposit melt, and time-to-decision — against monthly targets. Each Friday she shares the Scorecard sheet snapshot with her VP of Enrollment, switching to the KPI Trend sheet whenever a metric drops below target so the team can adjust outreach campaigns the same week. Monthly reporting time dropped from a full afternoon to 40 minutes.
Marcus runs institutional research at a state university system. He standardizes enrollment KPI definitions across 6 campuses using the KPI Definition sheet, then aggregates monthly Input Data sheets from each admissions office into a master file. The YTD trend charts surface which campuses consistently lag on the admit-to-enroll conversion target so the chancellor can redirect financial-aid leveraging earlier in the cycle — before end-of-cycle numbers lock in.
Priya is an enrollment consultant for online MBA programs. She delivers the Student Enrollment KPI Scorecard in Excel to 8 client schools at the start of every admissions cycle. The KPI Definition sheet’s formula and definition columns double as an accreditation-ready documentation portfolio, and the YTD trend view gives each client a board-ready visual without paying for a separate BI subscription. She pairs this scorecard with the University Department KPI Scorecard in Excel for clients who also need academic department reporting.
Advantages of the Student Enrollment KPI Scorecard in Excel
- One-time $12.99 cost — a fraction of what Slate Analytics, Salesforce EDA, or Qualtrics XM charge annually for equivalent enrollment-funnel reporting.
- Works offline — essential for admissions staff on managed institutional laptops where internet access or cloud tools may be restricted by IT policy.
- No technical training needed — anyone with basic Excel skills can start tracking enrollment KPIs within minutes of opening the file.
- Fully customizable — add, remove, or rename any KPI to match your institution’s specific funnel definitions without breaking formulas or charts.
- Shareable across teams — save to OneDrive or SharePoint for shared access across admissions staff and institutional research at no per-user cost.
- Accreditation-ready documentation — the KPI Definition sheet provides a permanent, auditable record of how each enrollment metric is defined, grouped, and calculated.
Opportunities for Improvement
A few honest limitations worth knowing before you buy:
- The template does not include automated data import from Student Information Systems (Banner, PeopleSoft, Workday Student) — data entry is manual. Teams needing live SIS feeds should consider a Power BI or Tableau solution instead.
- No built-in multi-campus consolidation view — each campus uses its own file. A system office wanting a cross-campus rollup would need a separate summary workbook.
- The scorecard tracks monthly data. Weekly or daily KPI tracking would require structural modifications to the Input Data and Definition sheets.
- Real-time collaboration during simultaneous data entry works best via OneDrive co-authoring rather than a shared network drive.
Best Practices
- Define KPIs before entering data — Complete the KPI Definition sheet first so metric names, formulas, and units are agreed upon by all admissions stakeholders before any data is entered.
- Update data by the 5th of each month — Consistent monthly data entry ensures accurate MTD and YTD comparisons throughout the admissions cycle.
- Use the KPI Trend sheet in weekly admissions meetings — Walk through trend charts with full historical context — far more persuasive than a static table of numbers.
- Save monthly snapshots — Archive a dated copy of the file each month (e.g., Student-Enrollment-Scorecard-2026-05.xlsx) for year-end review and accreditation audit trails.
- Align KPI types correctly — Accurately mark each KPI as LTB (Lower the Better, e.g., melt rate, time-to-decision) or UTB (Upper the Better, e.g., yield rate, retention) so the conditional formatting flags performance correctly.
- Refer to Microsoft Excel Support for guidance on advanced conditional formatting and dropdown list customization.
Explore Relevant Templates
If you found the Student Enrollment KPI Scorecard in Excel useful, these related templates from our Excel KPI Dashboard collection are worth a look:
- University Department KPI Scorecard in Excel — sister scorecard for tracking academic department-level KPIs across colleges and universities.
- Vocational Training KPI Scorecard in Excel — same 4-worksheet pattern adapted for vocational and trade-school programs.
- Online Education KPI Scorecard in Excel — variant for fully online programs covering enrollment, engagement, and completion KPIs.
- Continuing Education Programs KPI Dashboard in Excel — full multi-page dashboard upgrade for continuing-education and lifelong-learning programs.
- Education KPI Scorecard in Google Sheets — browser-based Google Sheets version of the same scorecard logic.
Also read: Scholarship Program KPI Scorecard in Excel and School Admin Dashboard in Excel.
Frequently Asked Questions
👉 Click here to Purchase the Student Enrollment KPI Scorecard in Excel
What enrollment KPIs does the Student Enrollment KPI Scorecard in Excel track?
The Student Enrollment KPI Scorecard in Excel tracks any admissions-funnel KPI you define — common examples include inquiry volume, application volume, application conversion rate, admit rate, yield rate, deposit rate, melt rate, time-to-decision, cost per enrolled student, first-year retention, and diversity composition. All metrics are fully customizable from the KPI Definition sheet with no formula editing required.
How long does setup take for the Student Enrollment KPI Scorecard in Excel?
Setup takes under 10 minutes. Open the file, enter your KPI definitions on the KPI Definition sheet, add monthly Actual and Target values on the Input Data sheet, and the Scorecard and KPI Trend sheets update automatically. The file ships with sample data so you can see every feature working before entering your institution’s actual figures.
Does the Student Enrollment KPI Scorecard in Excel use VBA or macros?
No. The Student Enrollment KPI Scorecard in Excel is built entirely on native Excel formulas, conditional formatting, dropdowns, and data validation. There are no VBA scripts, macros, or external add-ins required, so the file opens cleanly on managed admissions-office laptops where macros are blocked by IT policy.
Can I add custom student enrollment KPIs?
Yes. The KPI Definition sheet accepts unlimited custom enrollment KPIs. Add the KPI name, group, unit, formula, and definition, and specify LTB or UTB type. The Scorecard and KPI Trend sheets automatically incorporate every new metric you define without any structural change to the workbook.
How does this compare to paid enrollment-analytics platforms?
The Student Enrollment KPI Scorecard in Excel costs $12.99 one-time. Platforms like Slate Analytics, Salesforce EDA, and Qualtrics XM run $500–$5,000+ per year, require IT onboarding, and often demand Student Information System integration. For admissions teams that need structured MTD/YTD KPI tracking with trend charts and no IT dependency, this scorecard delivers core analytical value at under 1% of the annual SaaS cost.
Which Excel versions are compatible?
The Student Enrollment KPI Scorecard in Excel works with Microsoft Excel 2016, 2019, 2021, and Microsoft 365 on both Windows and Mac. It also opens in Excel Online for read-only review. All formulas, dropdowns, conditional formatting, and trend charts are fully compatible across these versions.
Can I share the scorecard with my whole admissions team?
Yes. Save the file to OneDrive or SharePoint and your entire admissions office, institutional research staff, and senior leadership can access and co-edit simultaneously at no extra cost. There are no per-user fees or seat limits.
About the Author
Built by PK — Microsoft Certified Professional with 15+ years of Excel, Google Sheets, and Power BI experience. Founder of NextGenTemplates, reaching 300K+ subscribers across YouTube channels. Every template is hand-built and tested before release.
Conclusion
The Student Enrollment KPI Scorecard in Excel gives admissions offices a structured, affordable, and easy-to-use system for tracking funnel KPIs monthly — with dropdown-driven Scorecard views, per-KPI trend charts, Actual vs. Target comparisons, and a built-in KPI Definition reference. Four organized worksheets, automatic calculations, color-coded indicators, and no VBA or subscription fees.
👉 Click here to Purchase the Student Enrollment KPI Scorecard in Excel
✅ Instant download · One-time payment · No subscription
Last updated: May 2026
Visit our YouTube channel for step-by-step video tutorials: Youtube.com/@PK-AnExcelExpert