Managing a school’s administrative data — tracking student enrollment, monitoring fee collection rates, analyzing attendance patterns, and reviewing academic performance — typically requires either a full school ERP costing thousands of dollars per year or hours of manual Excel work. The School Admin Dashboard in Excel solves this with a 5-page, 16-chart interactive dashboard that consolidates every critical KPI into one workbook. Setup takes under 10 minutes, and every chart refreshes automatically with a single click after you update the data.
According to Microsoft’s pivot table documentation, Excel’s native pivot engine can process hundreds of thousands of rows efficiently — which is exactly what powers this dashboard. Whether you manage a 200-student private school or a 2,000-student campus, this School Admin Dashboard in Excel gives your administration team a board-ready reporting tool without any recurring subscription costs.
🛒 Click here to Purchase School Admin Dashboard in Excel
Key Features of School Admin Dashboard in Excel
The School Admin Dashboard in Excel is built around three design principles: fast data entry, automatic refresh, and slicer-driven filtering. Here is what you get:
- 5 Interactive Pages — Overview, Academic Performance, Attendance Tracker, Fee Collection, and Class Analysis. Each page is a standalone view with its own charts and slicers.
- 16 Pre-Built Pivot Charts — All charts are connected to the Support Sheet’s pivot tables. Adding new data and pressing Refresh All updates every single chart simultaneously.
- 5 High-Level KPI Cards — Total Students, Total Fees Billed, Total Fees Collected, Net Outstanding Fees, and Avg. Discipline Rating are displayed as prominent summary cards on the Overview page.
- Slicer-Based Filtering — Multiple slicers on the Overview page let you filter the entire dashboard by section, stream, grade level, status, or month without touching a single formula.
- Single Data Entry Point — All data goes into one Data Sheet tab. The Support Sheet’s pivot tables read from there and push updates to all 5 dashboard pages automatically.
- Excel-Native, No Add-ins — The School Admin Dashboard in Excel uses only standard pivot tables, slicers, and charts — compatible with Excel 2016, 2019, 2021, and Microsoft 365 on both Windows and Mac.
Dashboard Pages Explanation
1. Overview Page
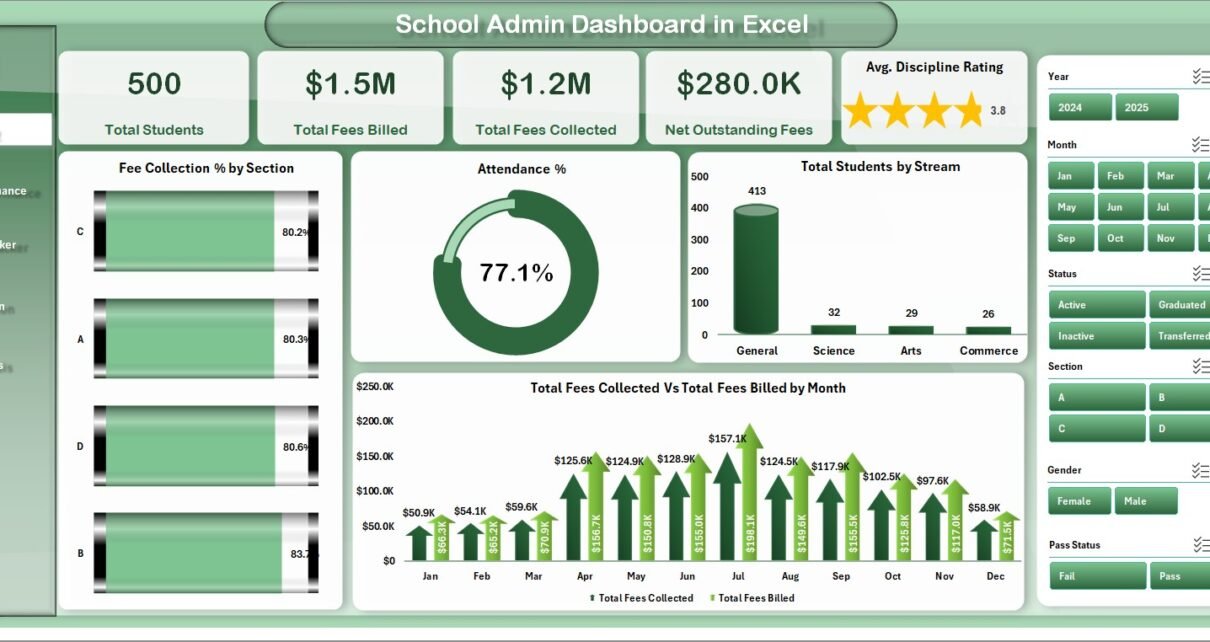
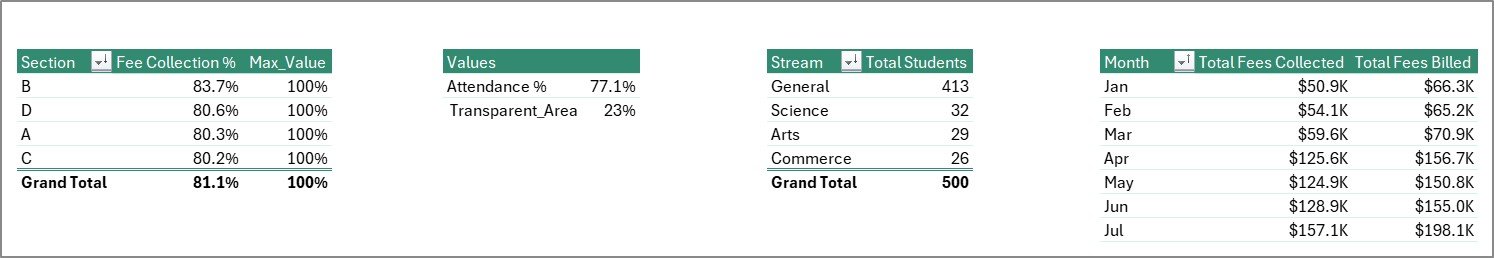
The Overview page is the command center of the School Admin Dashboard in Excel. It displays 5 KPI cards at the top — Total Students, Total Fees Billed, Total Fees Collected, Net Outstanding Fees, and Avg. Discipline Rating — giving principals and finance officers an instant summary of school health. Below the cards, 4 charts provide analysis: Fee Collection % by Section, Attendance %, Total Students by Stream, and Total Fees Collected vs Total Fees Billed by Month. Multiple slicers at the top let you filter the entire page by applying any combination of section, stream, grade, status, and month in seconds.
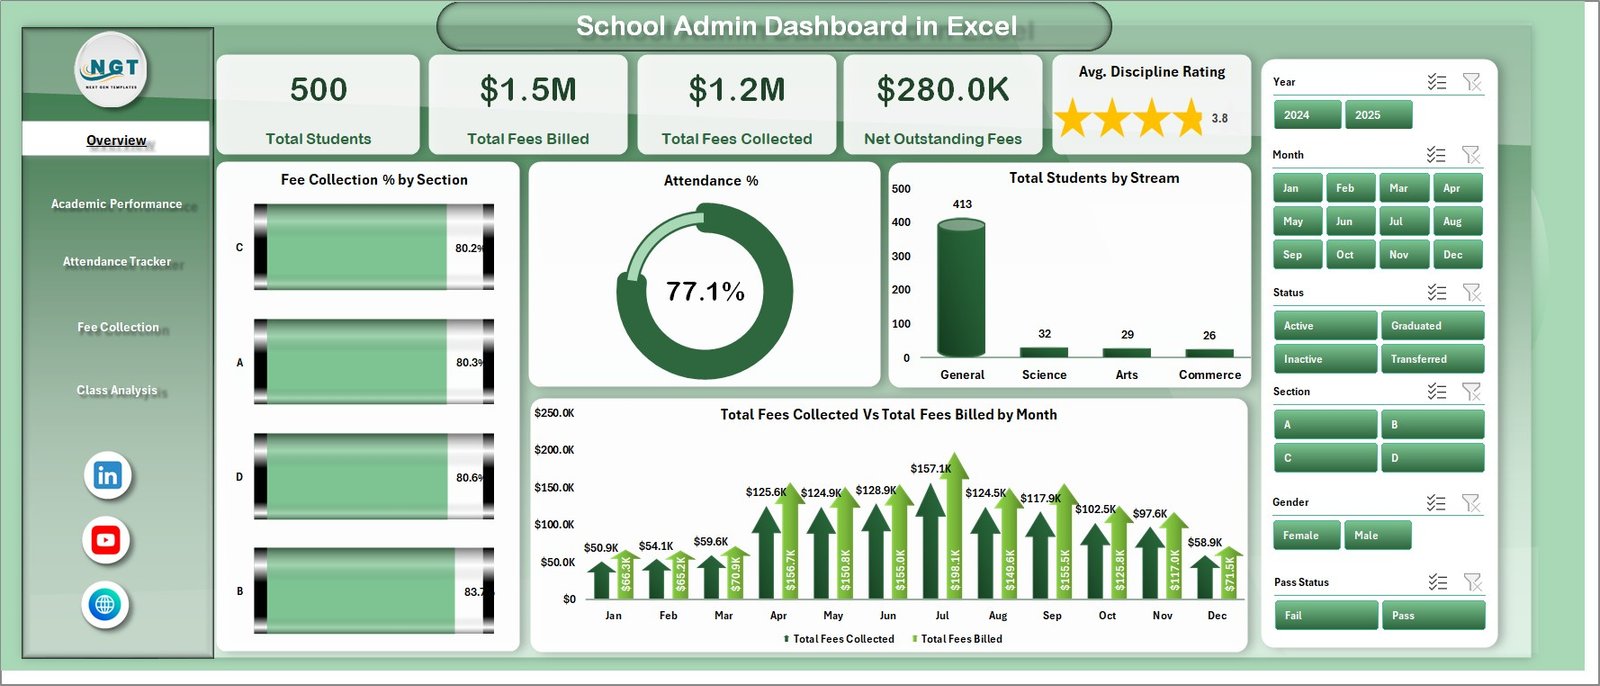
School Admin Dashboard in Excel — Overview Page
2. Academic Performance Page
The Academic Performance page focuses on student outcomes. It contains 4 charts: Total Fees Billed by Grade Level, Avg. Marks % by Stream, Total Students by Performance Grade, and Avg. Marks % by Section. Academic coordinators can use this page to identify which streams are producing the strongest results, which grade levels have the highest concentration of underperforming students, and how different sections compare on average marks percentage. This view is especially valuable ahead of parent-teacher meetings or annual board reviews.
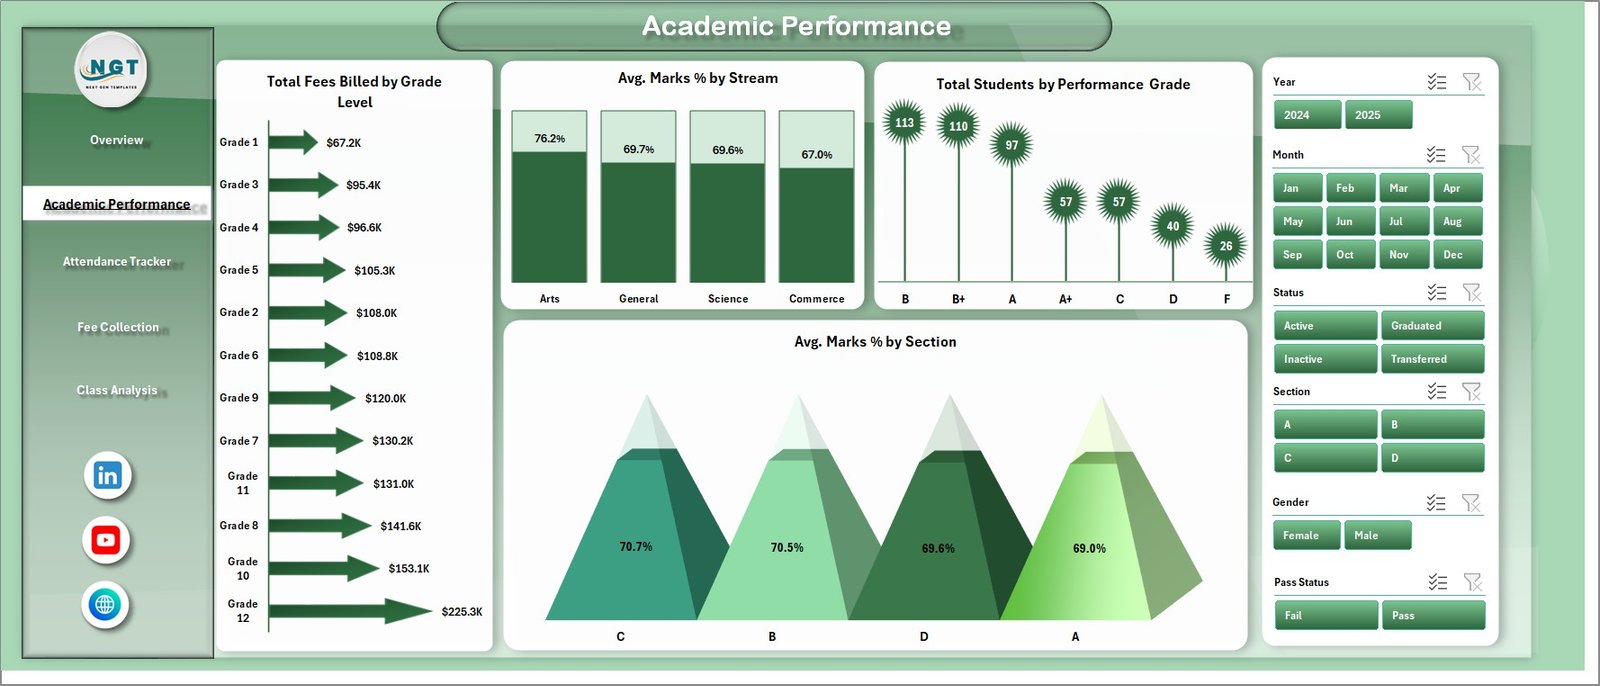
School Admin Dashboard in Excel — Academic Performance Page
3. Attendance Tracker Page
The Attendance Tracker page breaks down attendance patterns across 4 dimensions: Total Students by Grade Level, Total Attendance Days vs Total Possible Days by Gender, Attendance % by Section, and Attendance % by Month. School administrators can identify which grade levels have the highest absenteeism, whether attendance differs significantly by gender, and which months show attendance dips — useful for correlating attendance trends with academic performance dips on the previous page.
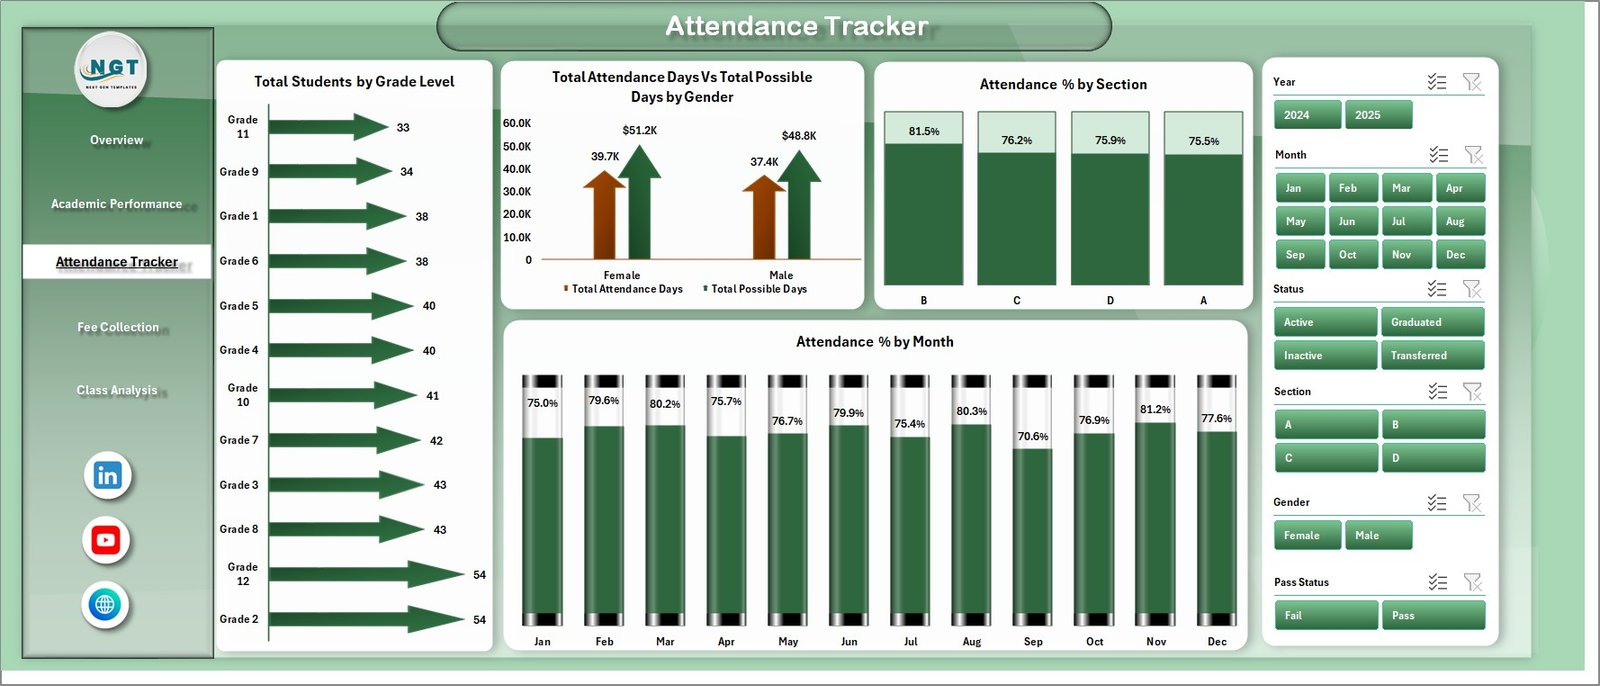
School Admin Dashboard in Excel — Attendance Tracker Page
4. Fee Collection Page
The Fee Collection page is the financial monitoring hub of the School Admin Dashboard in Excel. It includes 4 charts: Total Fees Billed vs Total Fees Collected by Grade Level, Fee Collection % vs Net Outstanding Fees by Status, Net Outstanding Fees by Stream, and Total Fees Collected by Month. Finance officers can instantly see which grade levels have the worst fee recovery rates, how outstanding fees break down by payment status, and which streams carry the highest unpaid balances. The monthly trend chart helps spot seasonal collection patterns for proactive outreach.
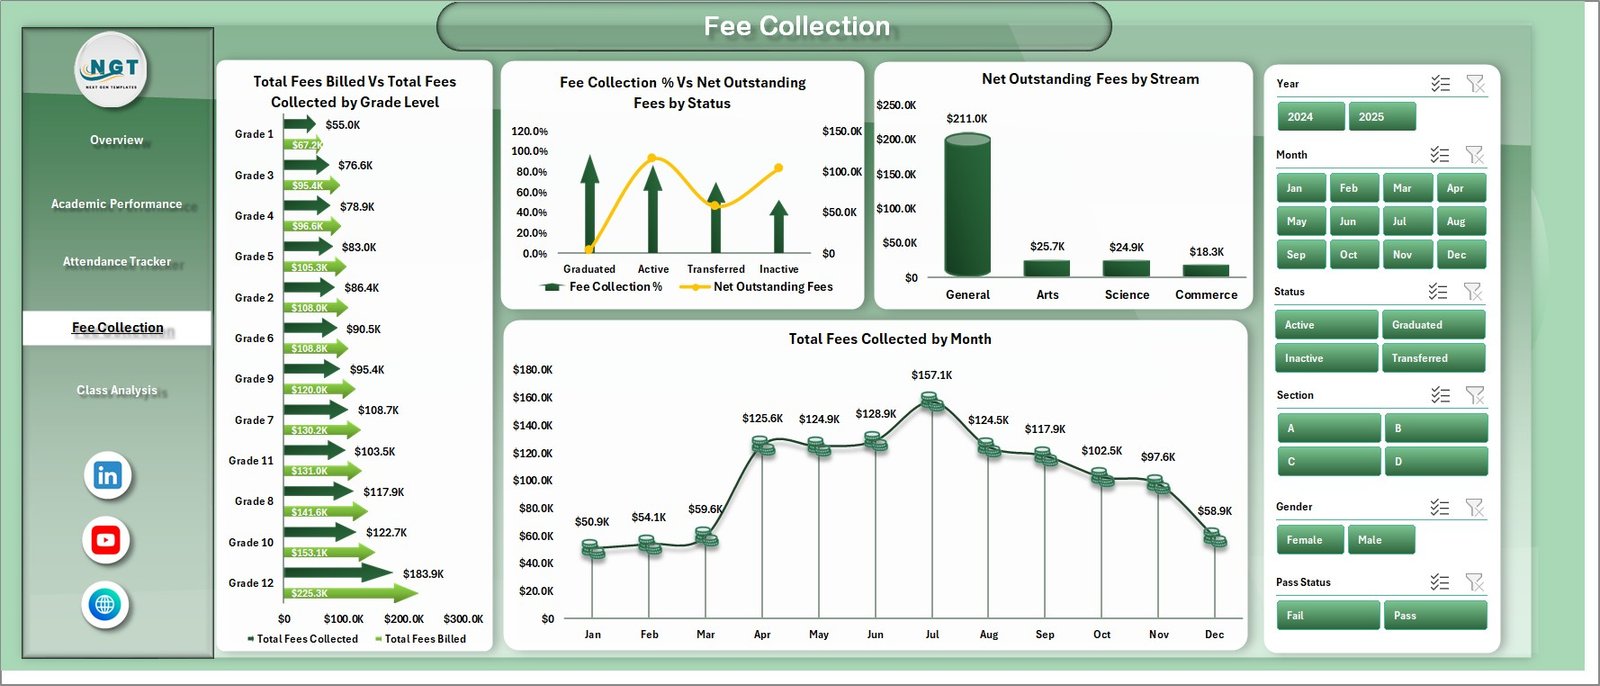
School Admin Dashboard in Excel — Fee Collection Page
5. Class Analysis Page
The Class Analysis page provides section-level insight with 3 charts: Total Students by Status, Total Fees Collected by Section, and Fee Collection % by Month. This page helps section teachers and department heads see how their specific section is performing on enrollment and fee contribution, and how their fee collection percentage has trended month by month.
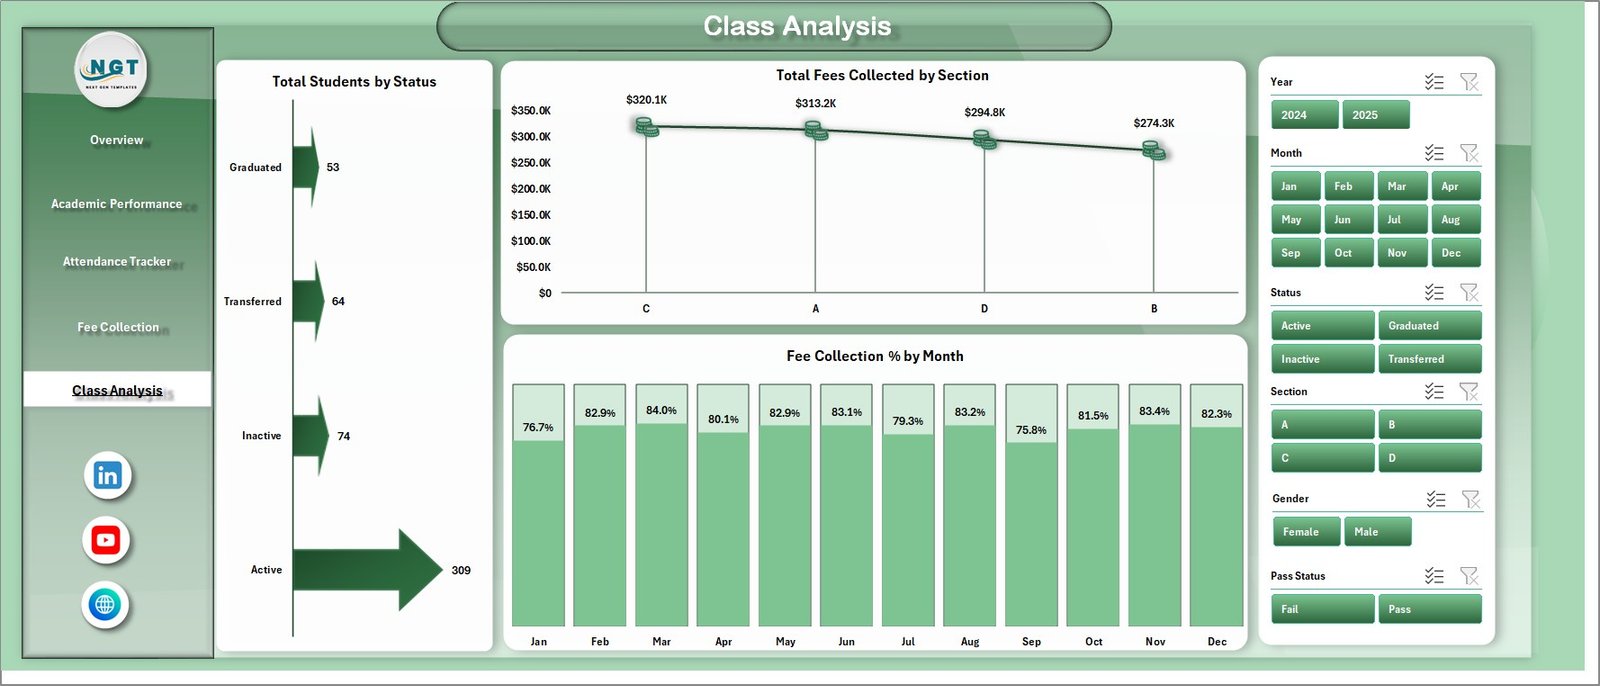
School Admin Dashboard in Excel — Class Analysis Page
6. Data Sheet Tab
The Data Sheet is where all student records are entered. It is structured with consistent column headers for student ID, name, section, stream, grade level, attendance data, marks, fee amounts, and discipline ratings. Maintaining this sheet in the provided format ensures all pivot tables and charts update correctly when you click Refresh All.
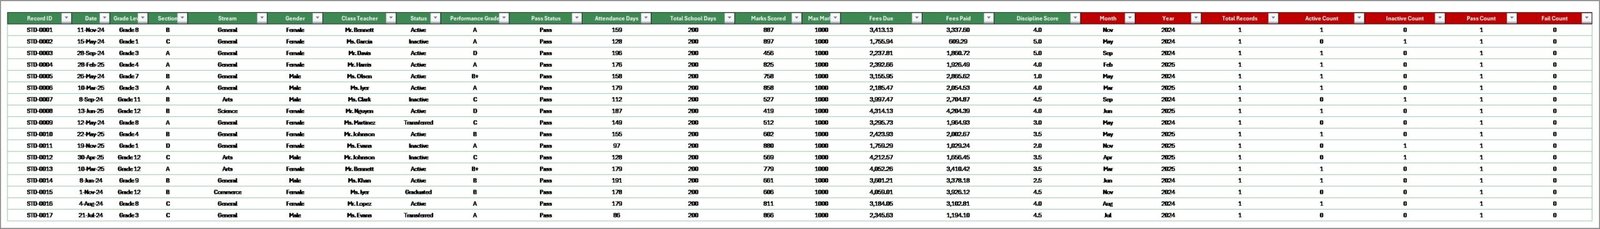
School Admin Dashboard in Excel — Data Sheet Tab
7. Support Sheet Tab
The Support Sheet contains all the pivot tables that power the 16 charts across 5 dashboard pages. After updating data in the Data Sheet, go to the Data tab in the Excel ribbon and click Refresh All — every pivot table refreshes and all charts update automatically. You can keep this sheet hidden during day-to-day use.
School Admin Dashboard in Excel — Support Sheet Tab
School Admin Dashboard in Excel vs. Google Sheets vs. School ERP — Feature Comparison
| Feature | School Admin Dashboard in Excel | Google Sheets Equivalent | School ERP (Fedena / Classter) |
|---|---|---|---|
| Cost | $17.99 one-time | Free (manual build) | $3–10 / student / year |
| Platform | Microsoft Excel | Google Sheets (cloud) | Web-based SaaS |
| Setup time | Under 10 minutes | 4–8 hours (build from scratch) | 1–3 days (IT setup) |
| Works offline | ✅ Fully offline | ❌ Needs internet | ❌ Cloud-only |
| Slicer-based filtering | ✅ Built-in | Limited | ✅ (module-dependent) |
| Customizable fields | ✅ Fully editable | ✅ Manual | ⚠️ Limited by vendor |
| No per-user fees | ✅ One file, unlimited users | ✅ | ❌ Per-student pricing |
| Year-1 cost (500 students) | $17.99 | $0 (DIY hours cost more) | $1,500–$5,000+ |
For school administrators who want a complete operational dashboard without paying per-student ERP fees, the School Admin Dashboard in Excel sits in the sweet spot.
Who Should Use This Template
Perfect for:
- School principals and vice-principals managing 200–2,000 student institutions
- School finance officers tracking fee collection rates and outstanding balances
- Academic coordinators monitoring student attendance and grade-level performance
- School operations teams presenting monthly reports to trustees or governing bodies
- Small to mid-size private schools without an ERP system
Not a fit if:
- You need real-time multi-user concurrent editing (consider Google Sheets instead)
- You need direct integration with a student information system (SIS)
- You need automated fee payment collection — this is a reporting and analytics tool
Real-World Use Cases
Maria runs administration at a 450-student K-12 private school. Each month she enters student records, attendance data, and fee payments into the Data Sheet, clicks Refresh All, and walks into the board meeting with a five-page Excel report — without hiring a data analyst or subscribing to a $4,000/year school ERP. The Fee Collection page specifically helped her reduce outstanding balances by identifying low-recovery sections and timing follow-up calls with parents before end-of-month.
Rajesh coordinates academics at a coaching institute with 6 streams and 12 sections. He uses the Academic Performance page to compare Avg. Marks % by Stream each semester, spots which sections need intervention, and correlates attendance dips (from the Attendance Tracker page) with mark drops to support students before final exams.
🛒 Click here to Purchase School Admin Dashboard in Excel
Advantages of School Admin Dashboard in Excel
- Centralizes 5 critical school administration metrics in one workbook, eliminating the need to maintain separate spreadsheets for fees, attendance, and academic performance
- Slicer-driven filtering requires no formula knowledge — non-technical staff can use it immediately
- Pivot table engine handles 500+ student records without performance issues
- One-time cost of $17.99 saves thousands compared to school ERP annual fees
- Works offline — no internet dependency for schools in low-connectivity areas
Opportunities for Improvement
- Does not support real-time multi-user collaboration — best suited for a single data manager who updates the file periodically
- Pivot table slicer styles may look slightly different on Excel for Mac versus Windows
- For schools with 5,000+ records, very large datasets may require periodic pivot cache clearing to keep the file size manageable
- Does not connect to school databases or SIS systems — data must be manually exported and pasted into the Data Sheet
Best Practices
- Update the Data Sheet at least monthly to keep the dashboard current for board and parent meetings
- Use a consistent column format in the Data Sheet — do not insert new columns without updating the pivot table ranges
- Hide the Support Sheet after setup to prevent accidental edits to pivot tables
- Save a backup copy at the end of each term before refreshing with new data
- Review the Fee Collection page before month-end to identify sections needing follow-up on outstanding fees
Explore Relevant Templates
If you manage other education formats, explore these related templates:
- Music School Dashboard in Excel — Track enrollment, instructor hours, and revenue for music academies
- Exam Boards KPI Dashboard in Excel — Monitor candidate counts, pass rates, and performance by subject
- Virtual Classrooms KPI Dashboard in Excel — Track engagement, attendance, and completion for online courses
- Vocational Training KPI Scorecard in Excel — MTD/YTD training performance tracking for vocational institutes
Also check out the full Music School Dashboard in Excel blog post and the Virtual Classrooms KPI Dashboard blog post for step-by-step walkthroughs of related templates.
Frequently Asked Questions
What KPIs does the School Admin Dashboard in Excel track?
The School Admin Dashboard in Excel tracks 5 high-level KPIs: Total Students, Total Fees Billed, Total Fees Collected, Net Outstanding Fees, and Avg. Discipline Rating on the Overview page. Supporting analysis across 4 additional pages covers academic marks, attendance rates, fee recovery, and class-level enrollment.
How many charts are included in the School Admin Dashboard in Excel?
The School Admin Dashboard in Excel includes 16 pre-built charts distributed across 5 pages — 4 charts each on the Overview, Academic Performance, Attendance Tracker, and Fee Collection pages, plus 3 charts on the Class Analysis page. All are pivot-driven and update automatically on refresh.
How long does setup take?
Setup takes under 10 minutes. Open the file in Microsoft Excel, replace the sample records in the Data Sheet tab with your actual school data using the same column structure, then click Data → Refresh All. All 16 charts and KPI cards update immediately.
How does this compare to Fedena or Classter school ERP?
The School Admin Dashboard in Excel costs $17.99 as a one-time purchase. Fedena and Classter charge $3–10 per student per year, which translates to $1,500–$5,000+ annually for a 500-student school. This dashboard covers the core reporting needs without IT setup, per-user fees, or cloud dependencies.
Can I add custom fields or sections to the dashboard?
Yes. Because the School Admin Dashboard in Excel is built on standard Excel pivot tables, you can add new columns to the Data Sheet and extend the pivot table ranges. All new data will flow into the charts after a refresh. The file is fully unlocked for customization.
Is this suitable for large schools with 1,000+ students?
Yes. The School Admin Dashboard in Excel is designed to handle 500–2,000+ student records. Excel’s pivot table engine processes this range efficiently, and the slicer-based filtering keeps navigation fast even with large datasets.
About the Author
Built by PK — Microsoft Certified Professional with 15+ years of Excel, Google Sheets, and Power BI experience. Founder of NextGenTemplates, reaching 300K+ subscribers across YouTube channels. Every template is hand-built and tested before release.
👉 Follow for more tutorials: Youtube.com/@PK-AnExcelExpert
Conclusion
The School Admin Dashboard in Excel is a ready-to-use, pivot-powered reporting tool that gives school administrators a complete operational view across enrollment, fees, attendance, academic performance, and class-level analysis — all in one Excel workbook for a one-time cost of $17.99.
🛒 Click here to Purchase School Admin Dashboard in Excel
✅ Instant download · One-time payment · No subscription