Managing a school means juggling hundreds of data points simultaneously — student enrollment, academic performance, attendance records, fee collection, and class-level discipline. Without a clear visual layer, important signals get buried in spreadsheets. The School Admin Dashboard in Power BI is a ready-to-use .pbix template that organizes all of that into 5 interactive report pages, 5 KPI cards, and 16 pre-built visuals. Setup takes under 10 minutes.
According to Microsoft’s Power BI documentation, Power BI Desktop is free to download and use — making it an accessible choice for schools and educational institutions of any size. This template is built entirely on Power BI Desktop, so there are no licensing costs to get started.
🌍 Join 8,400+ teams in 40+ countries using NextGenTemplates to replace costly SaaS tools with one-time-purchase Power BI, Excel, and Google Sheets dashboards.
🛝 Click here to Purchase the School Admin Dashboard in Power BI
✅ Instant download · One-time payment · No subscription · No per-user fees · Lifetime access
Key Features of School Admin Dashboard in Power BI
The School Admin Dashboard in Power BI delivers a complete administrative overview in a single .pbix file. Here are the five standout features that make it effective for school leaders and support staff:
5-Page Interactive Report Structure — The dashboard covers Overview, Academic Performance, Attendance Tracker, Fee Collection, and Class Analysis. Each page is purpose-built for a specific administrative role, so principals, finance officers, and academic coordinators can all find what they need without digging through irrelevant data.
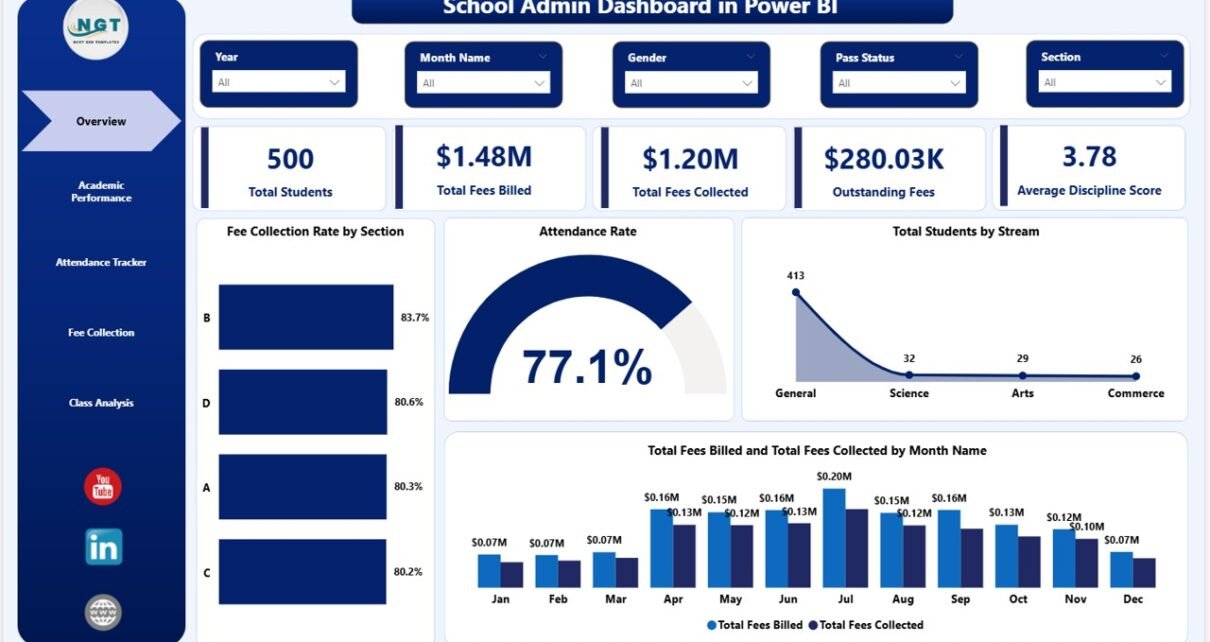
5 KPI Cards on Overview Page — The Overview page leads with five high-level metrics: Total Students, Total Fees Billed, Total Fees Collected, Outstanding Fees, and Average Discipline Score. These numbers update automatically every time slicers are changed or data is refreshed, ensuring the leadership team always sees the most current figures.
Multi-Slicer Filtering Across All Pages — Multiple slicers let users filter reports by section, stream, grade level, month, or student status in one click. The School Admin Dashboard in Power BI responds instantly — no formulas, no pivot table configuration, no manual recalculation required.
Fee Intelligence with Status Breakdown — The Fee Collection page tracks Total Fees Collected by Month, Outstanding Fees by Stream, and Fee Collection Rate by Status. Bursars and finance officers can immediately see which streams carry the highest overdue balances and which collection periods underperformed targets.
Attendance and Academic Data on Dedicated Pages — Rather than cramming all data onto one page, this dashboard dedicates separate report pages to attendance trends (by month, grade, and section) and academic performance (marks percentage by stream and section, performance grade distribution). This separation makes it easier to share targeted pages with specific department heads.
Dashboard Pages Explanation
Here is a detailed walkthrough of all 5 pages in the School Admin Dashboard in Power BI:
Page 1: Overview — The main control center. KPI cards at the top display Total Students, Total Fees Billed, Total Fees Collected, Outstanding Fees, and Average Discipline Score at a glance. Below the cards, four charts provide context: Fee Collection Rate by Section, Attendance Rate, Total Students by Stream, and Total Fees Billed vs Collected by Month Name. Multiple slicers across the top let administrators filter the entire page instantly by any dimension.
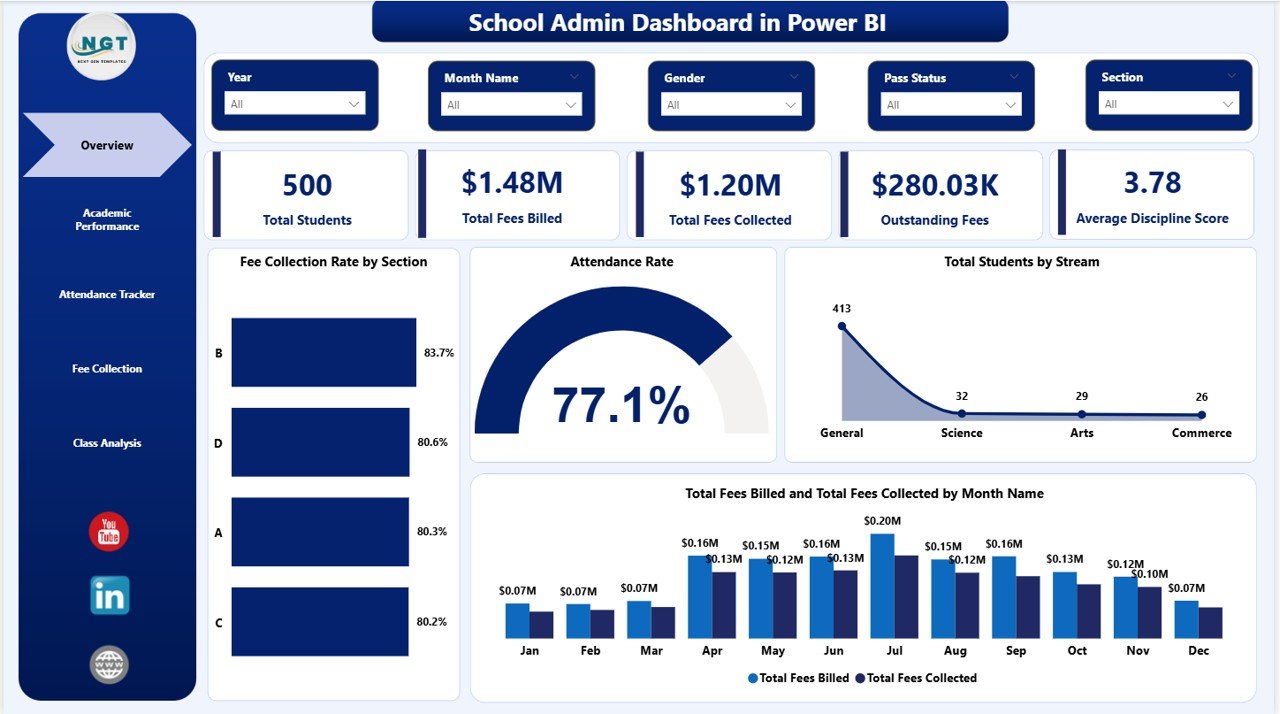
School Admin Dashboard in Power BI – Overview Page
Page 2: Academic Performance — This page breaks down academic results across three charts: Total Students by Performance Grade (showing how many students fall into each grade band), Average Marks Percentage by Stream (comparing science, arts, commerce, and other streams), and Average Marks Percentage by Section (identifying which classroom sections are outperforming or lagging). Academic coordinators use this page to make evidence-based decisions about targeted support programs.
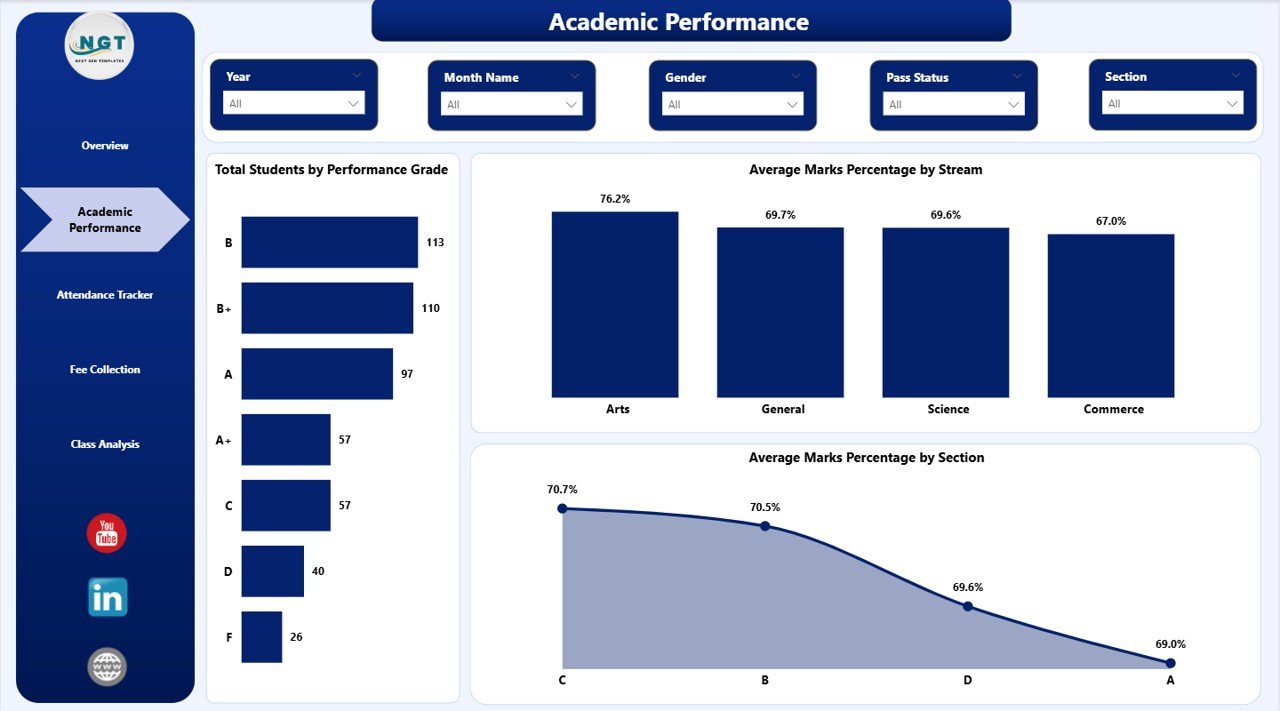
School Admin Dashboard in Power BI – Academic Performance Page
Page 3: Attendance Tracker — Attendance is tracked across three views: Attendance Rate by Month Name (showing monthly trends for the full academic year), Total Students by Grade Level (a headcount breakdown by year or grade), and Attendance Rate by Section (identifying chronic absenteeism patterns at the class level). Attendance data is critical for intervention timing and parent communication.
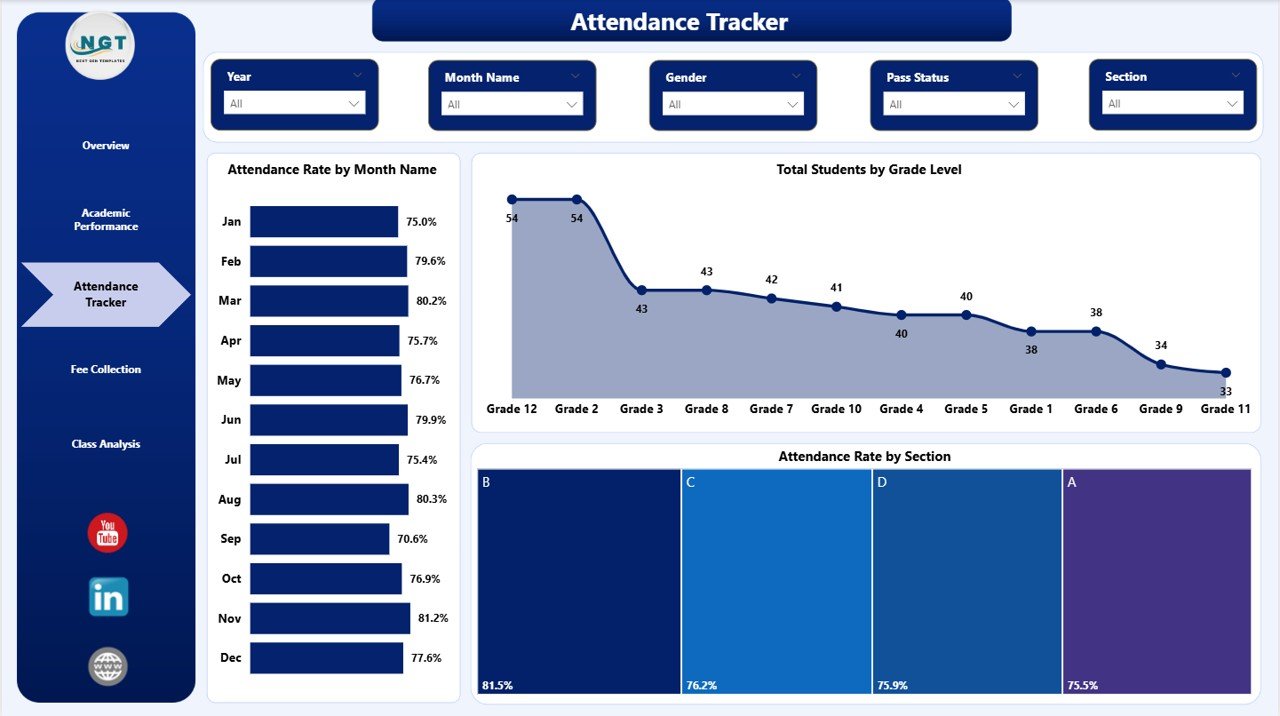
School Admin Dashboard in Power BI – Attendance Tracker Page
Page 4: Fee Collection — The finance-focused page displays three key visuals: Total Fees Collected by Month Name (showing revenue inflow over the year), Outstanding Fees by Stream (revealing which academic streams have the highest unpaid balances), and Fee Collection Rate by Status (breaking down full-pay, partial-pay, and non-pay student categories). This is the page bursars open in weekly finance meetings.
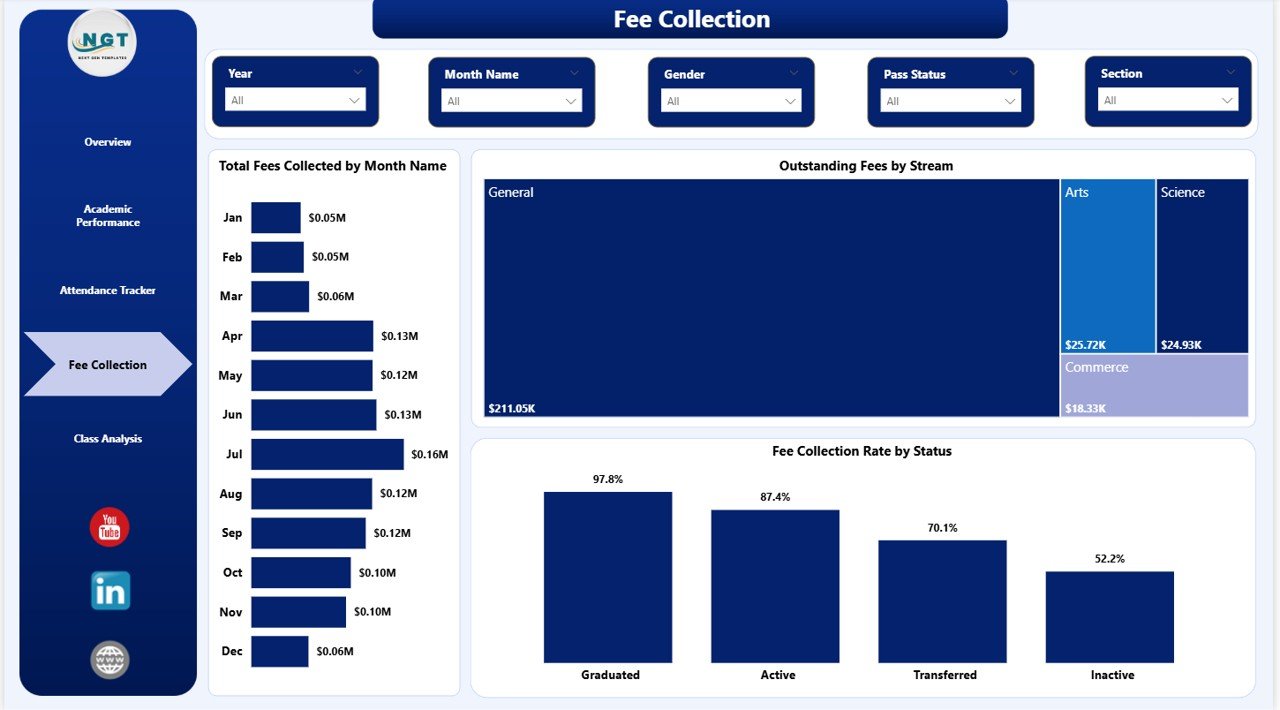
School Admin Dashboard in Power BI – Fee Collection Page
Page 5: Class Analysis — A class-level operational view with Total Students by Status (enrolled, withdrawn, suspended), Fee Collection Rate by Month Name (tracking class-level payment behavior over time), and Total Fees Collected by Section (comparing which sections contribute most to overall revenue). Class teachers and department heads use this page during their monthly reviews.
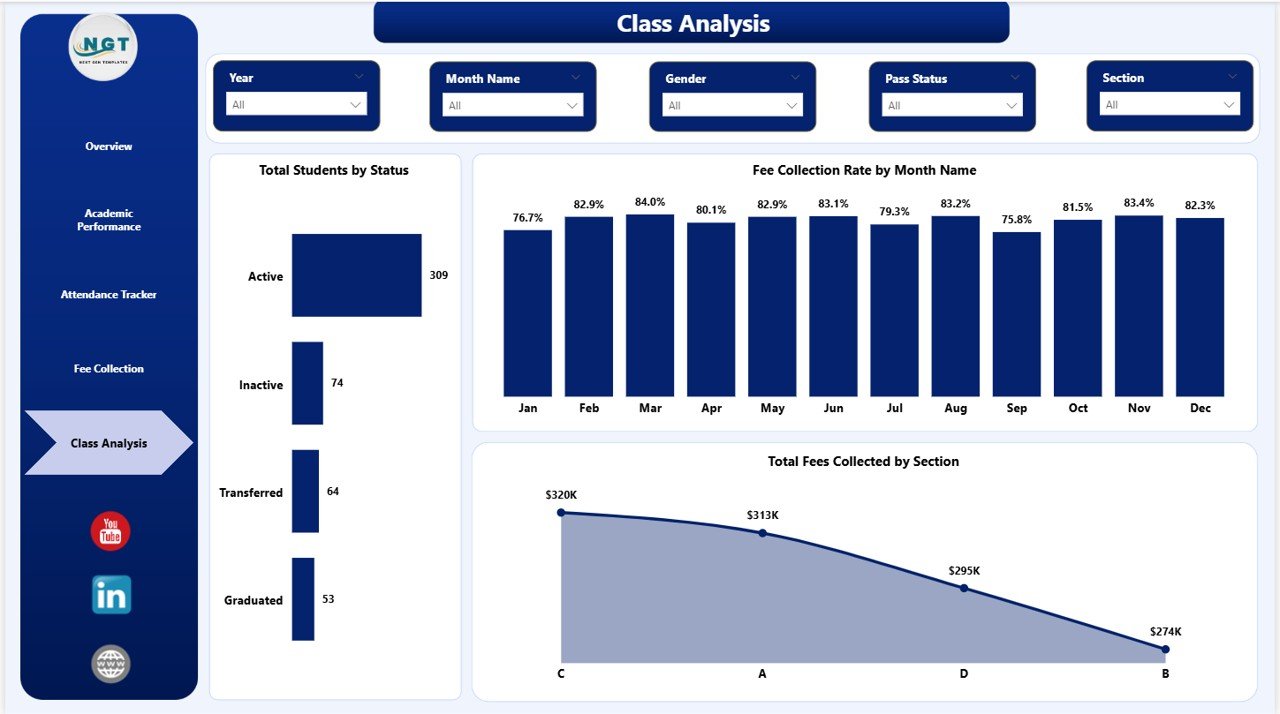
School Admin Dashboard in Power BI – Class Analysis Page
School Admin Dashboard in Power BI vs. Tableau vs. School ERP — Feature Comparison
| Feature | School Admin Dashboard in Power BI | Tableau for Education | School ERP (Fedena / Classe365) |
|---|---|---|---|
| Cost | $17.99 one-time | $70/user/month | $200–500/month |
| Platform | Power BI Desktop (free) | Tableau Desktop license required | Web-based SaaS |
| Setup time | Under 10 minutes | Days + team training | Weeks of onboarding |
| Student performance tracking | ✅ Built-in | Requires custom development | ✅ Built-in (at full ERP cost) |
| Fee collection analysis | ✅ Dedicated page | Requires custom development | ✅ Built-in |
| Offline capability | ✅ Fully offline | ❌ Cloud-dependent | ❌ Cloud-only |
| Customizable fields | ✅ Fully editable .pbix | ✅ Yes | Limited without developer access |
| Year-1 cost for 1 admin | $17.99 | $840+ | $2,400+ |
For school administrators who want clear, actionable data on students, attendance, and fees without paying thousands for an ERP system, the School Admin Dashboard in Power BI sits in the sweet spot.
Who Should Use This Template
✅ Perfect for:
- School principals and administrators managing 200–2,000 student cohorts
- Finance officers and bursars tracking fee collection and recovery rates
- Academic coordinators monitoring grade and section performance
- IT and data officers producing monthly or termly leadership reports
- Private schools, coaching institutes, and tutoring centers that need data visibility without ERP costs
❌ Not a fit if:
- Your school requires real-time live database sync (this template is driven by static data files)
- You need full student information system (SIS) functionality beyond analytics
- Your team doesn’t have access to Power BI Desktop (free from Microsoft at powerbi.microsoft.com)
Real-World Use Cases
Priya heads administration at a 600-student private school in Pune. Each month she uses the School Admin Dashboard in Power BI to prepare board presentations covering enrollment trends, section-level attendance rates, and fee collection summaries. Reports that previously required 3 hours of Excel work now take 15 minutes — paste the updated data, click Refresh, and the board pack is ready.
James manages finance for a chain of 4 tutoring centers across Mumbai. He uses the Fee Collection page to compare outstanding balances by stream and identify which centers have the highest overdue accounts before the end of each billing cycle. Catching this early has reduced his overdue recovery workload by roughly a quarter compared to his previous spreadsheet process.
Maria coordinates academics at a secondary school in Manila. She opens the Academic Performance page every term to compare average marks percentage across streams and sections, then flags underperforming cohorts for support programs 6 weeks before end-of-year exams — giving teachers time to intervene meaningfully rather than reactively.
🛝 Click here to Purchase the School Admin Dashboard in Power BI
Advantages of School Admin Dashboard in Power BI
Cost efficiency — At $17.99 one-time, this dashboard delivers the reporting capability of tools that cost hundreds of dollars per month. For a school managing its budget carefully, that’s a meaningful difference over a 3-year horizon.
Instant deployment — No server setup, no user accounts, no onboarding. Download the .pbix file, open Power BI Desktop, replace sample data, and the dashboard is live. This is critical for schools that can’t afford weeks of IT implementation time.
Platform independence — Power BI Desktop is a free Microsoft product available on Windows. Schools that already use Microsoft 365 have everything they need to run this dashboard at no additional cost.
Fully editable — The .pbix file is fully unlocked. Administrators can rename sections, add new KPIs, modify color themes, or extend the data model to match their school’s specific reporting structure.
Opportunities for Improvement
Like all file-based dashboards, the School Admin Dashboard in Power BI requires manual data updates — there is no automatic live connection to a student management system. Schools that require real-time sync with a live SIS database would need to build a custom data connector in Power BI. Additionally, sharing the report with stakeholders who don’t have Power BI Desktop requires either exporting to PDF or publishing to Power BI Service, which needs a paid Microsoft 365 subscription for web-based sharing.
Best Practices
Keep a master data file in a consistent folder path so Refresh always works without re-mapping the data source. Refresh the report at least weekly during term time so KPI cards and trend charts reflect current reality. Use the slicer panels as a pre-meeting filter — set the slicers to the specific stream, section, or month being discussed before the meeting so visuals are already focused when the session starts. Export specific pages as PDFs for parents, governors, or external inspectors who don’t need the full interactive report.
Explore Relevant Templates
🔹 School Admin Dashboard in Excel — The same 5-page administrative structure built on Microsoft Excel with pivot tables and slicers. Ideal for schools that don’t use Power BI.
🔹 Driving School Dashboard in Power BI — Purpose-built analytics for driving academies covering student enrollment, instructor utilization, and test pass rates.
🔹 Music School Dashboard in Power BI — Track enrollment, recitals, and fee collection for music schools and performing arts academies.
🔹 Tutoring Business Dashboard in Power BI — Designed for tutoring centers monitoring student progress, session completion, and revenue by subject.
💡 Browse the full collection of Power BI Dashboard Templates on NextGenTemplates.
Frequently Asked Questions
What KPIs does the School Admin Dashboard in Power BI track?
The School Admin Dashboard in Power BI tracks 5 KPIs on the Overview page: Total Students, Total Fees Billed, Total Fees Collected, Outstanding Fees, and Average Discipline Score. All five metrics update automatically when slicers are changed or the data source is refreshed.
Do I need a paid Power BI license to use this template?
No. The School Admin Dashboard in Power BI runs entirely in Power BI Desktop, which is a free download from Microsoft. A paid Power BI Service or Microsoft 365 license is only required if you want to publish the report for browser-based sharing with stakeholders.
Can I customize the sections and grade levels to match my school?
Yes. The School Admin Dashboard in Power BI is a fully editable .pbix file. You can rename sections, add or remove grade levels, change stream labels, and modify any visual in Power BI Desktop. No advanced Power BI certification is required for basic customization.
How does this compare to school ERP software in terms of cost?
The School Admin Dashboard in Power BI is a $17.99 one-time purchase compared to $200–500 per month for full school ERP platforms like Fedena or Classe365. It covers the analytics and reporting needs for student management, attendance, and fee collection without requiring ERP onboarding, user licensing, or recurring subscription costs.
How long does setup take?
Setup takes under 10 minutes. Download and open the .pbix file in Power BI Desktop, replace the sample data rows with your school’s records in the source file, and click Refresh. All 5 report pages and KPI cards update instantly — no formulas to write, no macros to configure.
Is there an Excel version of this dashboard?
Yes. The School Admin Dashboard in Excel covers the same 5 analysis pages using pivot tables and slicers in Microsoft Excel. It’s a good option for school staff who are more comfortable with Excel than Power BI.
Can I share the dashboard with teachers or governors who don’t have Power BI?
Yes. Export any page as a PDF directly from Power BI Desktop using File → Export → PDF. For interactive web-based sharing, you’ll need a Power BI Service workspace, which requires a Microsoft 365 Business or Pro license. For most internal sharing purposes, PDF export is sufficient.
About the Author
Built by PK — Microsoft Certified Professional with 15+ years of Excel, Google Sheets, and Power BI experience. Founder of NextGenTemplates, reaching 300K+ subscribers across YouTube channels. Every template is hand-built and tested before release.
Conclusion
The School Admin Dashboard in Power BI gives school administrators, finance officers, and academic coordinators a single, organized view of their institution’s most important operational metrics. Five dedicated report pages, 5 KPI cards, and 16 pre-built visuals make it easy to track students, attendance, fees, and academic performance — all in a tool that costs less than a textbook.
🛝 Click here to Purchase the School Admin Dashboard in Power BI
✅ Instant download · One-time payment · No subscription
For step-by-step video tutorials, visit Youtube.com/@PK-AnExcelExpert