The Influencer Campaign Dashboard in Excel tracks 5 high-level KPIs, 20+ charts, and 7 sheet tabs of data across 5 interactive pages — Overview, Platform Analysis, Niche Insights, Influencer Performance, and Trend Analysis. Setup takes under 10 minutes: replace the sample data, click Refresh All on the Data ribbon, and every chart, slicer, and pivot updates automatically. The whole workbook runs on native Excel pivot tables, so there are no macros, no add-ins, and no monthly fees.
If you run influencer marketing in 2026, you already know the pain: you have campaign data scattered across creator dashboards, agency reports, UTM links, and three different spreadsheets. This Influencer Campaign Dashboard in Excel consolidates everything into one workbook so you can see total revenue, conversions, engagement, and ROI per influencer, per platform, and per niche — without paying $200+ per month for tools like Aspire, GRIN, or Modash.
🌍 Join 8,400+ teams across 40+ countries already using NextGenTemplates to replace expensive SaaS with one-time-purchase Excel, Google Sheets, and Power BI templates. ✅ Instant download · One-time payment · No subscription · Lifetime access.
📊 Click here to Purchase the Influencer Campaign Dashboard in Excel
Key Features of the Influencer Campaign Dashboard in Excel
This dashboard is built around five core KPI cards — Total Campaigns, Total Revenue, Total Conversions, Total Impressions, and Total Influencer Fee — that anchor every analysis page. Slicers at the top of each page let you filter by platform, region, tier, niche, and content type without writing a single formula.
- Five KPI cards at the top of the Overview page summarize total campaigns, revenue, conversions, impressions, and influencer fees in real time, recalculating instantly when slicer filters are applied.
- Five interactive dashboard pages — Overview, Platform Analysis, Niche Insights, Influencer Performance, and Trend Analysis — each with its own slicer set so you can drill from total spend down to a single creator.
- 20+ pre-built charts covering engagement %, ROI %, average CPC, total likes vs. clicks, revenue by month, and revenue vs. conversions by platform — every chart auto-refreshes from the support sheet pivots.
- Influencer tier benchmarking compares nano, micro, mid, macro, and mega creators by ROI, average revenue per campaign, and engagement rate so you know where each marketing dollar earns the highest return.
- Niche and region insights reveal which verticals (beauty, fitness, finance, gaming, etc.) and which geographies generate the highest revenue and conversion volume from your influencer spend.
- Auto-refreshing pivot architecture on a hidden Support Sheet means you only update one Data Sheet, click Refresh All, and the entire workbook recalculates — no broken formulas, no manual chart updates.
Dashboard Pages Explanation
The Influencer Campaign Dashboard in Excel ships with seven sheet tabs — five interactive analysis pages plus a Data Sheet and a Support Sheet (which can be hidden in production use). Below is a page-by-page walkthrough.
📊 Click here to Purchase the Influencer Campaign Dashboard in Excel
1. Overview Page
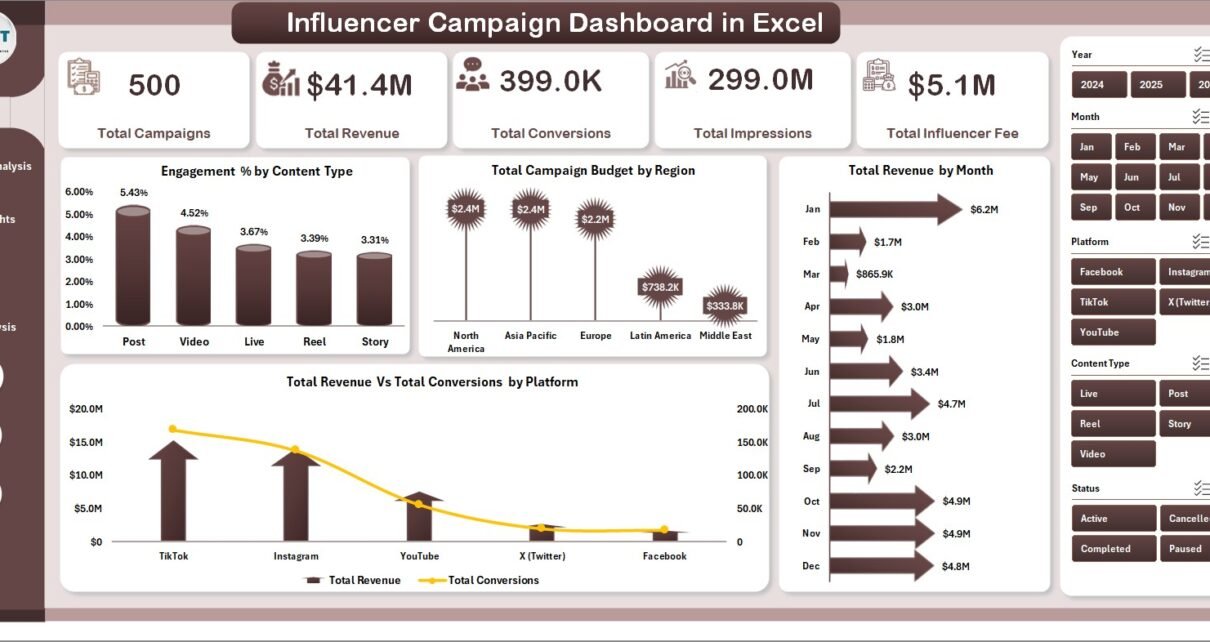
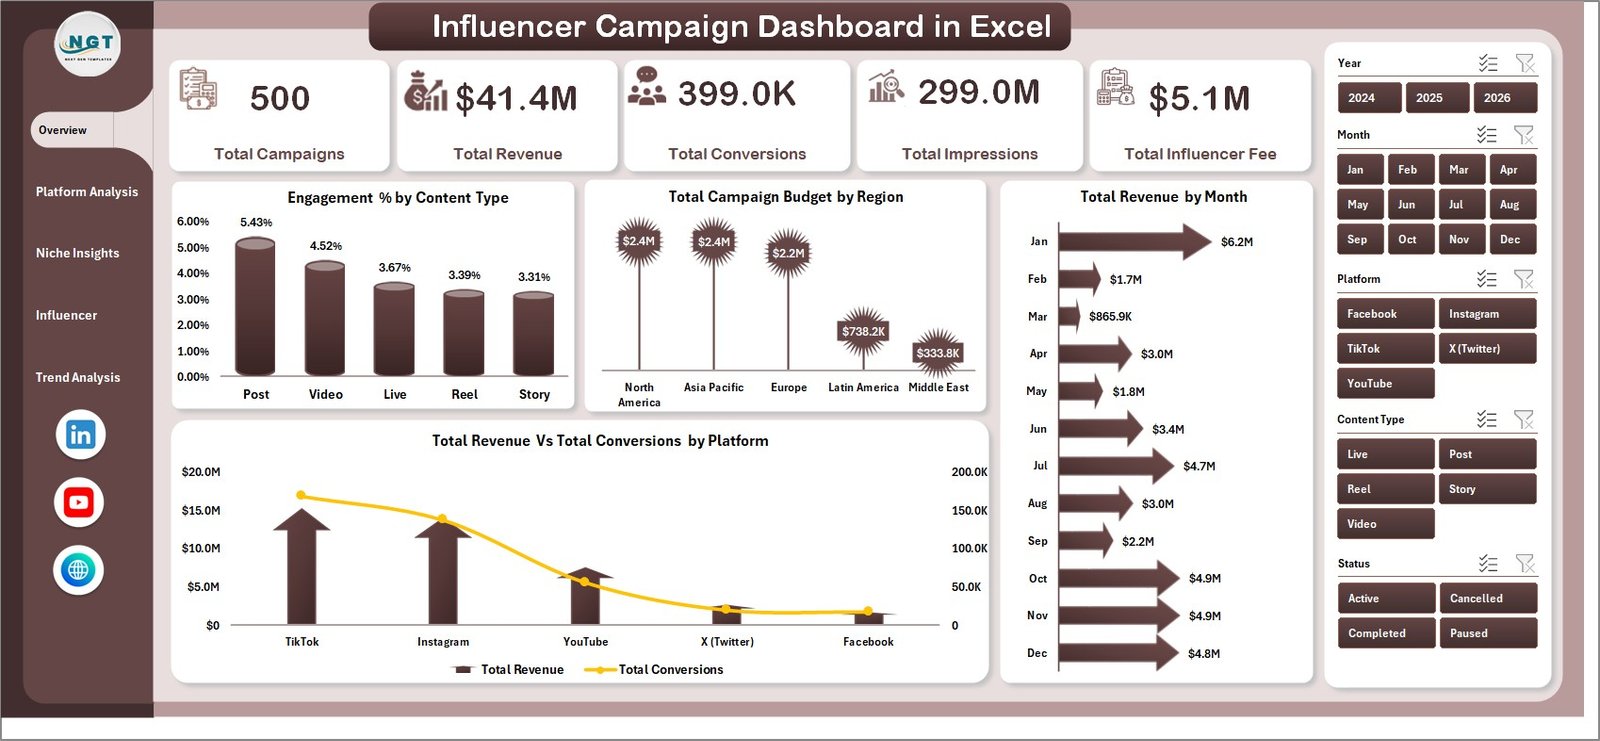
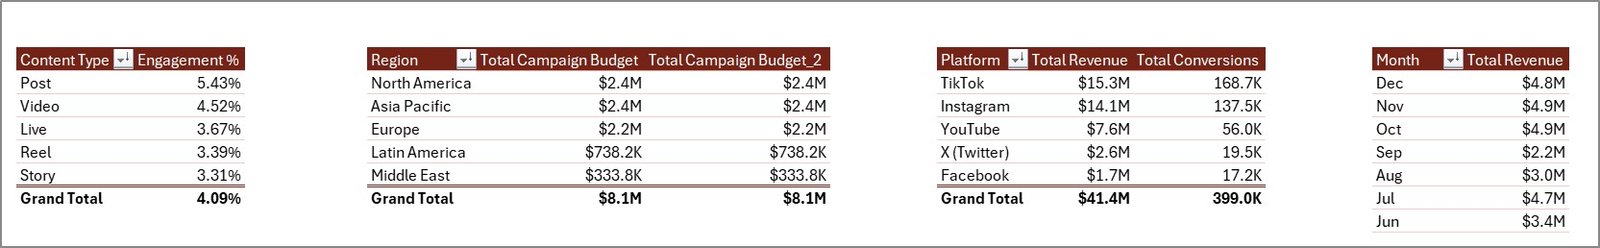
The Overview page is the executive summary. Five KPI cards at the top — Total Campaigns, Total Revenue, Total Conversions, Total Impressions, and Total Influencer Fee — give leadership the bottom line in five seconds. Below the cards, four charts break the data down for analysis:
- Engagement % by Content Type — a quick look at which formats (Reels, Stories, posts, videos) drive the highest engagement.
- Total Campaign Budget by Region — shows where your spend is concentrated geographically.
- Total Revenue by Month — reveals seasonality and the impact of recent campaigns.
- Total Revenue vs. Total Conversions by Platform — a dual-axis comparison that exposes high-revenue, low-conversion platforms (where AOV is high) versus high-conversion, low-revenue ones.
Multiple slicers above the charts let you filter the entire page by platform, region, tier, niche, or content type with a single click.
Influencer Campaign Dashboard in Excel
2. Platform Analysis
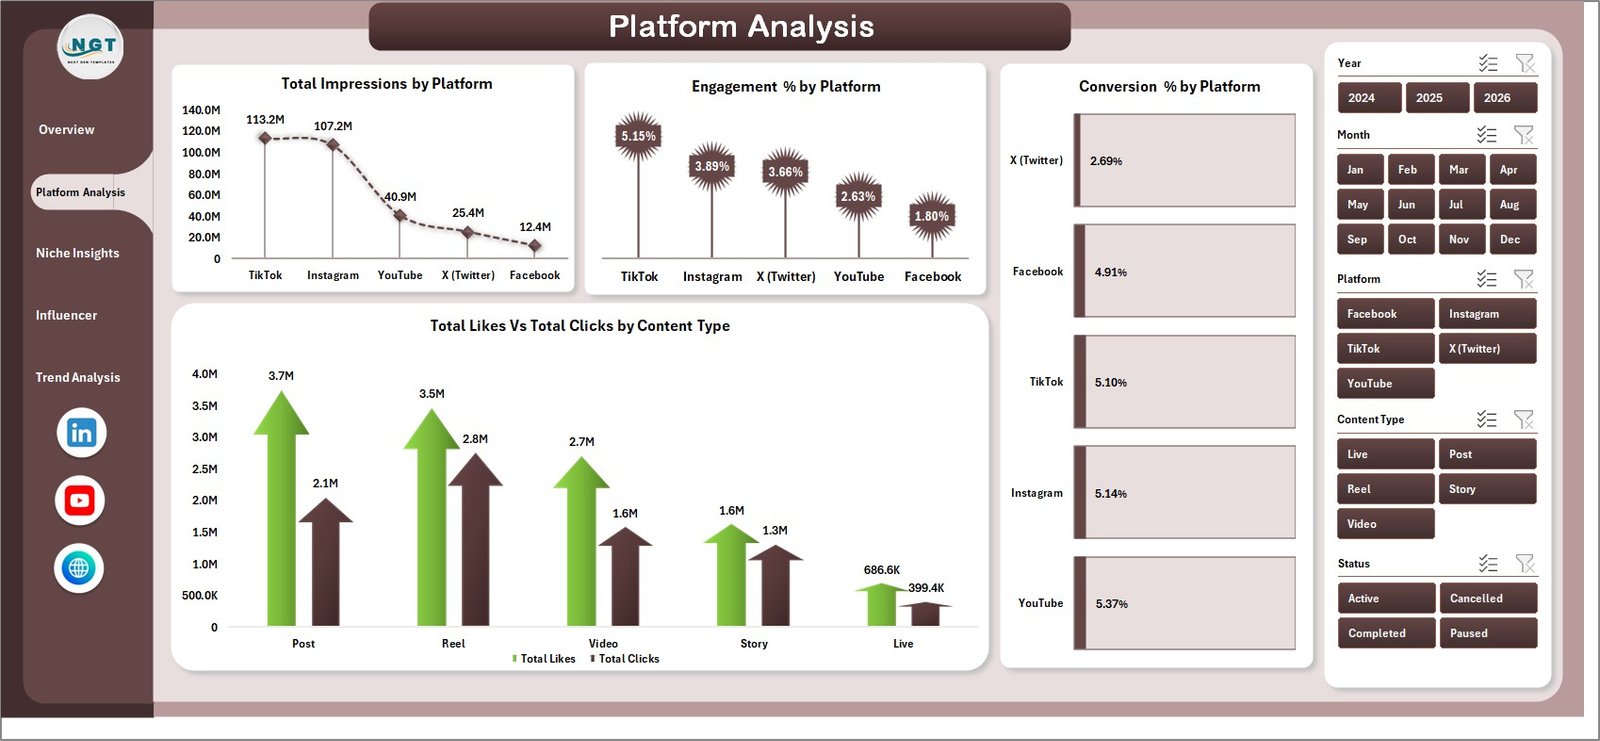
The Platform Analysis page focuses on which channels (Instagram, TikTok, YouTube, X, etc.) actually deliver. The four charts include Total Impressions by Platform, Engagement % by Platform, Conversion % by Platform, and Total Likes vs. Total Clicks by Content Type. Pair this page with your media plan to spot platforms with high reach but weak conversion — a classic sign you’re paying for vanity metrics.
Platform Analysis
3. Niche Insights
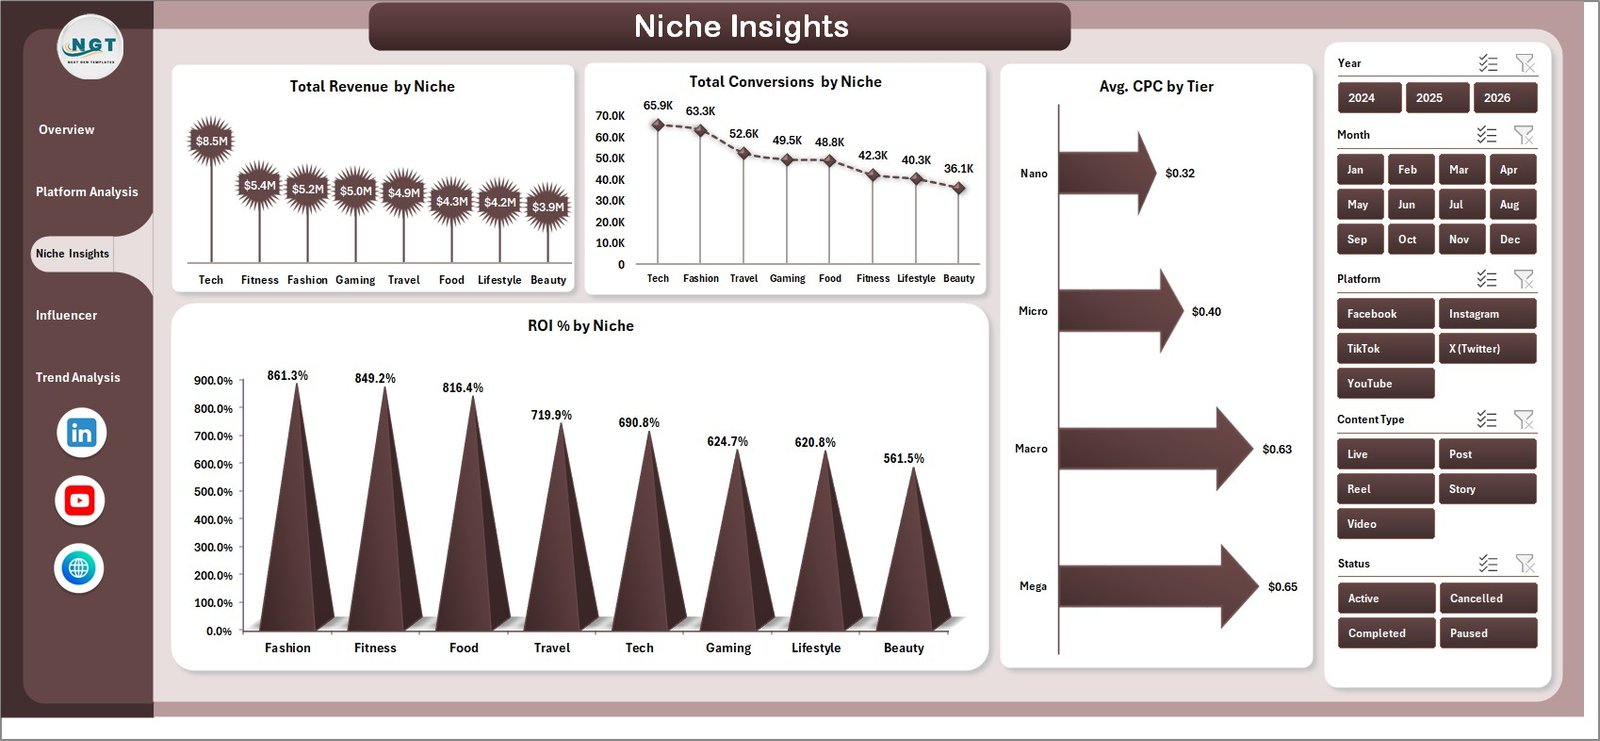
This page answers “which verticals are paying off?” Charts include Total Revenue by Niche, Total Conversions by Niche, Average CPC by Tier, and ROI % by Niche. Use it before approving the next quarter’s creator brief — if your highest-ROI niche is fitness but you’re investing 60% of budget in beauty, the data will show it instantly.
Niche Insights
4. Influencer Performance
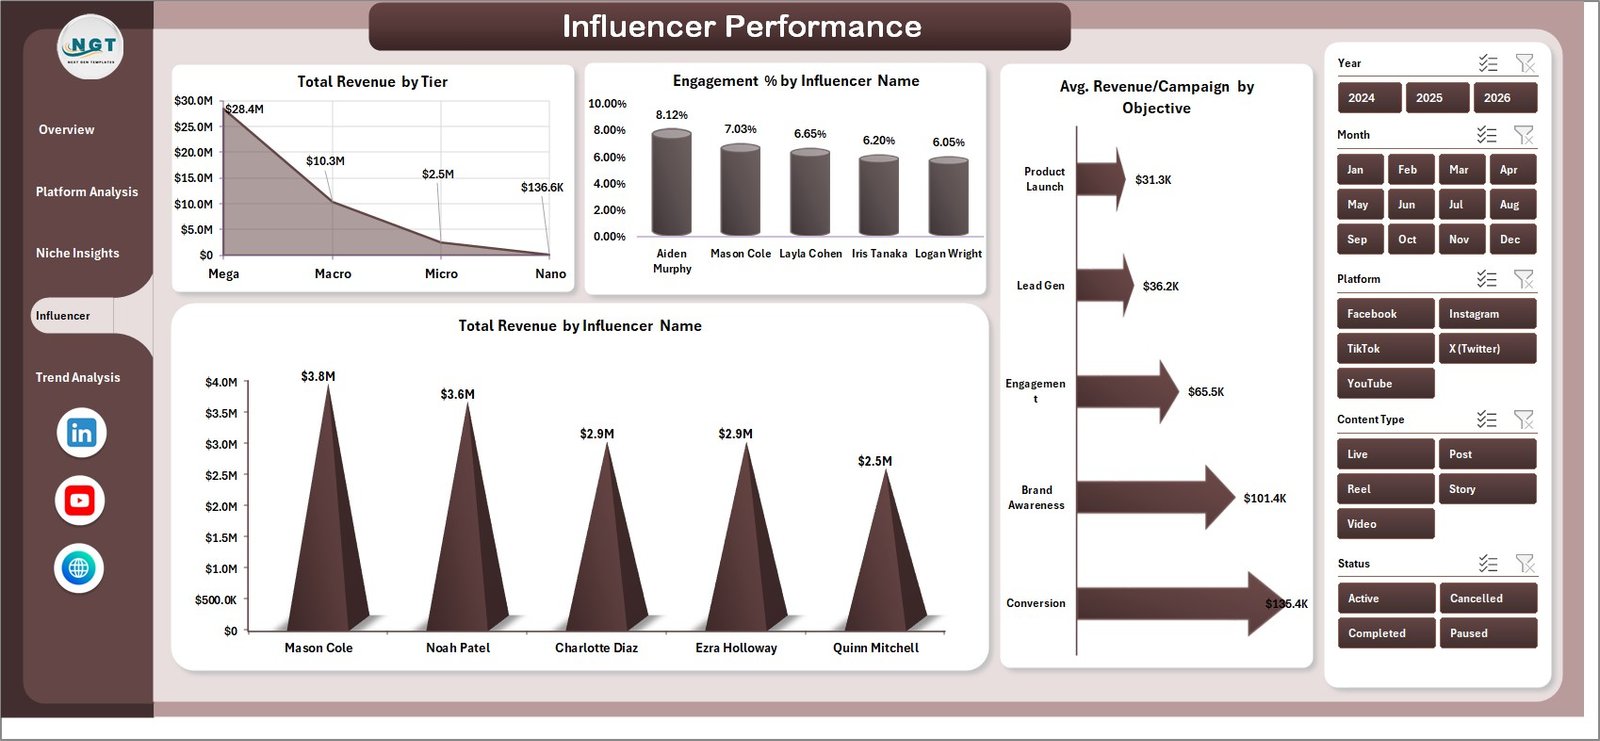
The Influencer Performance page is where you decide who to renew and who to drop. Charts include Total Revenue by Tier, Engagement % by Influencer Name, Average Revenue per Campaign by Objective, and Total Revenue by Influencer Name. The tier breakdown is especially useful: many brands assume mega-influencers drive the most revenue, but the data often reveals micro-creators win on a per-dollar basis.
Influencer Performance
5. Trend Analysis
Trend Analysis covers the time dimension — the answer to “is influencer marketing working better this quarter than last?” Charts include Total Impressions by Region, Total Revenue by Status, Total Campaigns by Month, and Total Influencer Fee by Month. Use this page in monthly business reviews to spot upward or downward trends before they become surprises.
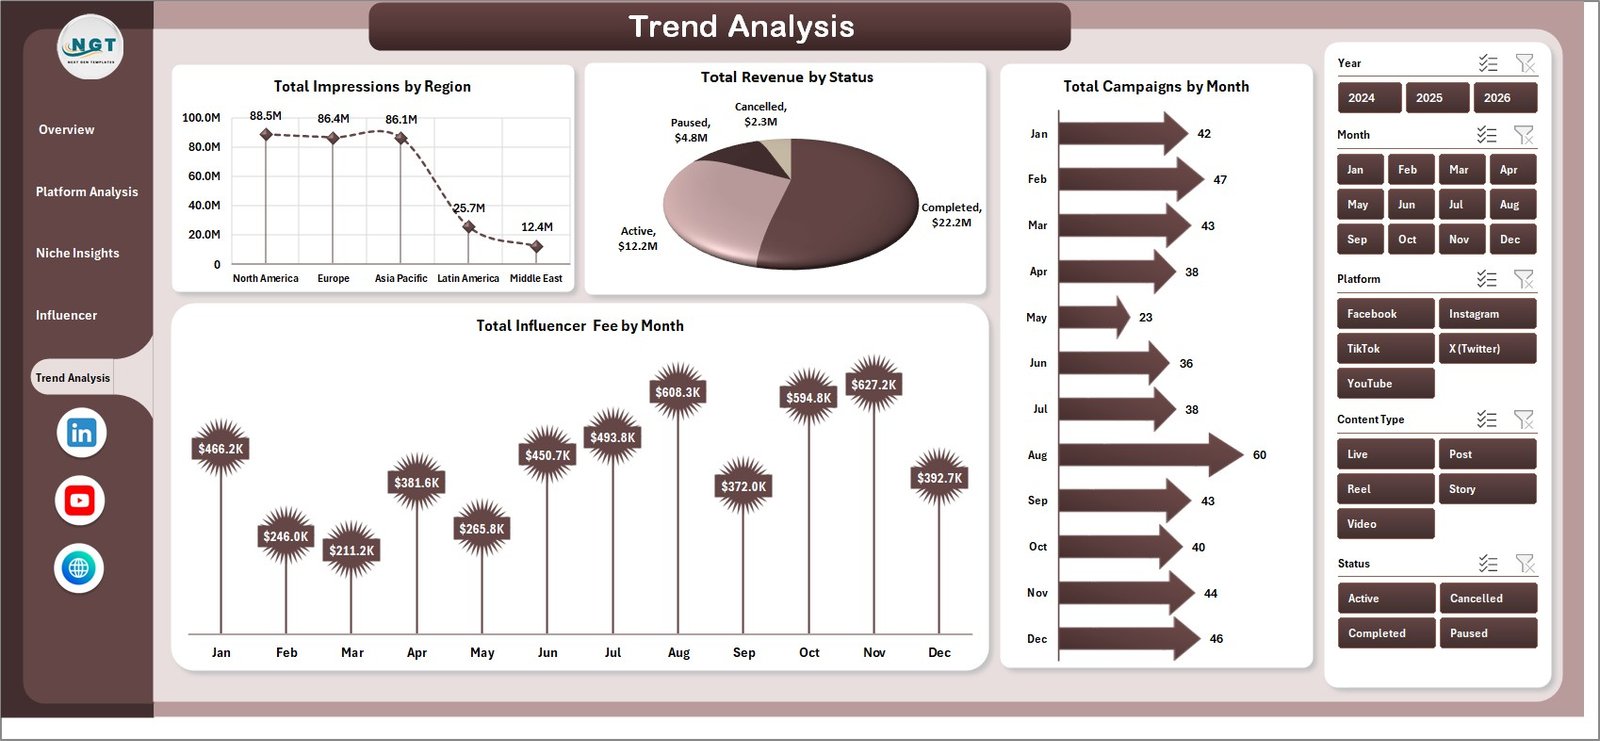
Trend Analysis
6. Data Sheet
The Data Sheet is the single source of truth for the entire workbook. Each row is one influencer campaign with columns for date, platform, niche, tier, region, content type, objective, status, impressions, engagements, clicks, conversions, revenue, and influencer fee. Add new campaigns to the bottom of the table in the same column format, click Refresh All, and every chart updates.
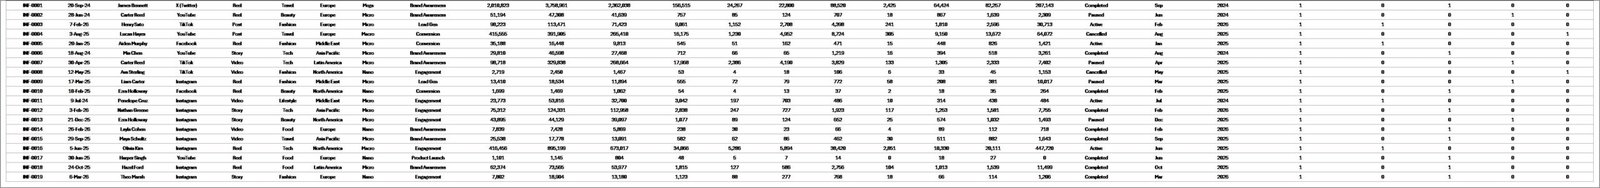
Data Sheet tab
7. Support Sheet
The Support Sheet contains all the pivot tables that feed the dashboard charts. After updating the Data Sheet, go to the Data tab on the Excel ribbon and click Refresh All — every pivot recalculates and every linked chart updates automatically. You can hide the Support Sheet in production so end users only see the analysis pages.
Support sheet tab
Influencer Campaign Dashboard in Excel vs. Google Sheets vs. Paid SaaS — Feature Comparison
| Feature | Influencer Campaign Dashboard in Excel | Google Sheets equivalent | Aspire / GRIN / Modash |
|---|---|---|---|
| Cost | $17.99 one-time | $9-12 one-time | $200-1000+ / month |
| Platform | Excel 2016+ (Win/Mac) | Google Sheets (browser) | Cloud SaaS |
| Setup time | Under 10 minutes | Under 10 minutes | 1-3 weeks (CSM-led) |
| Works offline | ✅ Yes | ❌ No (browser) | ❌ No (cloud-only) |
| Customizable charts & KPIs | ✅ Full control | ✅ Full control | ⚠️ Limited to vendor templates |
| Slicer-based filtering | ✅ Native Excel slicers | ⚠️ Filter views only | ✅ Built-in filters |
| Pivot-driven auto-refresh | ✅ One-click Refresh All | ⚠️ Manual pivot refresh | ✅ Automatic |
| Year-1 cost at 5 users | $17.99 (one-time) | $9-12 (one-time) | $2,400-12,000+ / year |
| Lifetime access | ✅ Yes | ✅ Yes | ❌ Subscription only |
For brand and agency teams that want enterprise-grade campaign analytics without the enterprise price tag, the Influencer Campaign Dashboard in Excel sits in the sweet spot.
Who Should Use This Template
Perfect for:
- In-house brand marketers running 5-200 influencer campaigns per quarter who need a single ROI view.
- Agency account managers reporting back to clients and need a clean Excel deliverable.
- DTC and e-commerce teams that already track UTMs and conversions in Excel and want one workbook to tie spend to revenue.
- Solo founders and consultants priced out of $200+/month influencer marketing platforms.
- Marketing analysts who prefer the flexibility of pivot tables over locked SaaS dashboards.
Not a fit if:
- You need automatic creator discovery, outreach, or contract signing — those are SaaS-only features.
- Your team has zero Excel experience and won’t touch a pivot table or slicer.
- You require real-time API integrations with TikTok, Instagram, or YouTube data feeds (this is a manual-data dashboard).
Real-World Use Cases
Mia runs influencer marketing at a 40-person beauty DTC brand. Every Friday she pulls campaign data from her Aspire export and the Shopify revenue feed, drops it into the Data Sheet, hits Refresh All, and presents the Overview page in the Monday standup. The leadership team can see total revenue and ROI per platform without logging into anything.
Daniel manages a boutique influencer agency with eight brand clients. He duplicates the Influencer Campaign Dashboard in Excel for each client, plugs in their campaign data, and ships a monthly PDF report. What used to take half a day in PowerPoint now takes 45 minutes — and clients prefer the live Excel file because they can drill into any platform or niche themselves.
Priya is a solo SaaS founder running her first 10 creator partnerships. She can’t justify $300/month for a SaaS tool, so she bought the dashboard for $17.99, logs each campaign manually, and uses the Influencer Performance page to decide who to renew at the 90-day mark.
Advantages of the Influencer Campaign Dashboard in Excel
- Saves $2,400-$12,000 per year compared to enterprise influencer marketing platforms while delivering the same core analytics.
- Owns your data permanently — the file lives on your machine, so cancelling a vendor contract never wipes your historical analytics.
- Works without an internet connection, ideal for board meetings, flight prep, or working from low-connectivity locations.
- Familiar interface — anyone who can use Excel can use this dashboard within minutes; no onboarding session required.
- Fully editable design means you can rebrand colors, swap logos, rename KPIs, and add new charts without vendor approval.
Opportunities for Improvement
Honest limitations matter. The dashboard does not auto-pull data from social platforms — you need to export campaign data from TikTok, Instagram, or your influencer-relations tool and paste it into the Data Sheet. There is no native creator discovery, outreach automation, or contract management — those workflows still belong in dedicated tools or a CRM. And while the file is editable, building entirely new chart types beyond what’s included requires intermediate Excel skill (pivot tables, slicers, chart formatting).
Best Practices
- Standardize how you log tier (nano, micro, mid, macro, mega) and niche (beauty, fitness, finance, gaming, etc.) in the Data Sheet — inconsistent labels break the slicer filters.
- Always log influencer fee separately from total campaign spend so the ROI % calculations stay accurate.
- Refresh the workbook before every leadership meeting — a stale dashboard is worse than no dashboard.
- Hide the Support Sheet in production but never delete it; it’s the engine that drives every chart.
- Save monthly snapshots of the file (Influencer-Dashboard-2026-05.xlsx) so you can compare year-over-year performance without rebuilding history.
Explore Relevant Templates
- Influencer Campaign Dashboard in Google Sheets — the same dashboard ported to Google Sheets for cloud-first teams.
- Political Campaign Dashboard in Excel — same pivot/slicer architecture for campaign-finance and voter-outreach analytics.
- Multi-Platform Social Media Calendar in Excel — the planning companion to the analytics workbook.
- Public Relations (PR) Report in Excel — monthly PR-coverage reporting that pairs well with influencer analytics.
- Fundraising Campaign KPI Dashboard in Google Sheets — same campaign-tracking structure for nonprofit fundraising.
Browse the full Excel Dashboard Templates library for more.
Frequently Asked Questions
What KPIs does the Influencer Campaign Dashboard in Excel track?
The Influencer Campaign Dashboard in Excel tracks five primary KPIs — Total Campaigns, Total Revenue, Total Conversions, Total Impressions, and Total Influencer Fee — plus engagement %, ROI %, average CPC, and revenue per campaign across 20+ charts.
Which Excel versions are compatible with this dashboard?
The Influencer Campaign Dashboard in Excel works in Excel for Microsoft 365, Excel 2021, Excel 2019, and Excel 2016 on both Windows and Mac. It uses native pivot tables and slicers, so no add-ins or macros are required.
How long does setup take?
Setup takes under 10 minutes. Open the file, paste your campaign data into the Data Sheet using the existing column headers, click Refresh All on the Data tab, and every chart, KPI card, and slicer updates automatically across all five dashboard pages.
How does this compare to Aspire, GRIN, or Modash?
Aspire, GRIN, and Modash cost $200-1000+ per month and add creator discovery and outreach. The Influencer Campaign Dashboard in Excel is a one-time $17.99 purchase focused purely on campaign analytics — the same KPI and ROI views, with no recurring cost.
Can I add my own charts and KPIs?
Yes. The Influencer Campaign Dashboard in Excel is fully editable. Add new pivot tables on the Support Sheet, build additional charts on any analysis page, rename KPI cards, and swap brand colors. The pivot-driven architecture handles new metric columns without breaking existing charts.
Does it pull data automatically from Instagram or TikTok?
No — the Influencer Campaign Dashboard in Excel is a manual-data workbook. You export campaign data from your platforms or influencer tool and paste it into the Data Sheet. This keeps the file lightweight, offline-capable, and free of API dependencies.
Can multiple team members use the same file?
Yes. Save the Influencer Campaign Dashboard in Excel to OneDrive, SharePoint, or Google Drive (in Excel format) and your team can co-author it. For real-time multi-user editing in a browser, see the Google Sheets edition of this template.
About the Author
Built by PK — Microsoft Certified Professional with 15+ years of Excel, Google Sheets, and Power BI experience. Founder of NextGenTemplates, reaching 300K+ subscribers across YouTube channels (@PK-AnExcelExpert, @NextGenTemplates). Every template is hand-built and tested before release.
Conclusion
If you’re spending hours every month stitching influencer-campaign data together from creator dashboards, agency reports, and one-off spreadsheets, the Influencer Campaign Dashboard in Excel can collapse that work into a single workbook with five interactive pages, 20+ charts, and pivot-driven auto-refresh. It costs less than one hour of agency time and replaces tools that charge $200+ per month.
📊 Click here to Purchase the Influencer Campaign Dashboard in Excel
✅ Instant download · One-time payment · No subscription · Lifetime access
🎥 Visit Youtube.com/@PK-AnExcelExpert for step-by-step Excel dashboard tutorials.