Educational NGOs Dashboard in Power BI is built for education-focused nonprofits, donor-funded learning programs, regional coordinators, and finance teams that need clear visibility into budgets, donations, funds utilized, students enrolled, completed students, program status, and regional performance. NGO reporting often becomes scattered across spreadsheets, donor files, and monthly summaries. This Power BI template brings the most important signals into 5 interactive report pages with high-level KPI cards, slicers, and ready visuals for leadership review, donor updates, and operational planning.
You can get the template from Educational NGOs Dashboard in Power BI. For official guidance on building and using Power BI reports, see Microsoft Learn – Get started with Power BI Desktop.
Key Features of Educational NGOs Dashboard in Power BI
- 5 Power BI report pages: Overview, Funding Analysis, Student Outcomes, Program Analysis, and Regional Insights.
- High-level KPI cards: Total Students Enrolled, Total Donations, Total Programs, Total Budget, and Total Funds Utilized.
- Interactive slicers: Filter the report quickly by dimensions such as month, region, program type, funding source, and status.
- Funding analytics: Compare budgets, donations, utilization, funding source, program type, and monthly donation movement.
- Student outcome tracking: Review enrollments, completed students, completion rates, and regional student performance.
- Program delivery analysis: Monitor program status, budget utilization rate, and completion rate by program type.
- Regional comparison: Analyze funds utilized, students enrolled, budget, and donations by region.
- Editable .pbix file: Modify report pages, colors, visuals, fields, and data source settings in Power BI Desktop.
Dashboard Pages Explanation
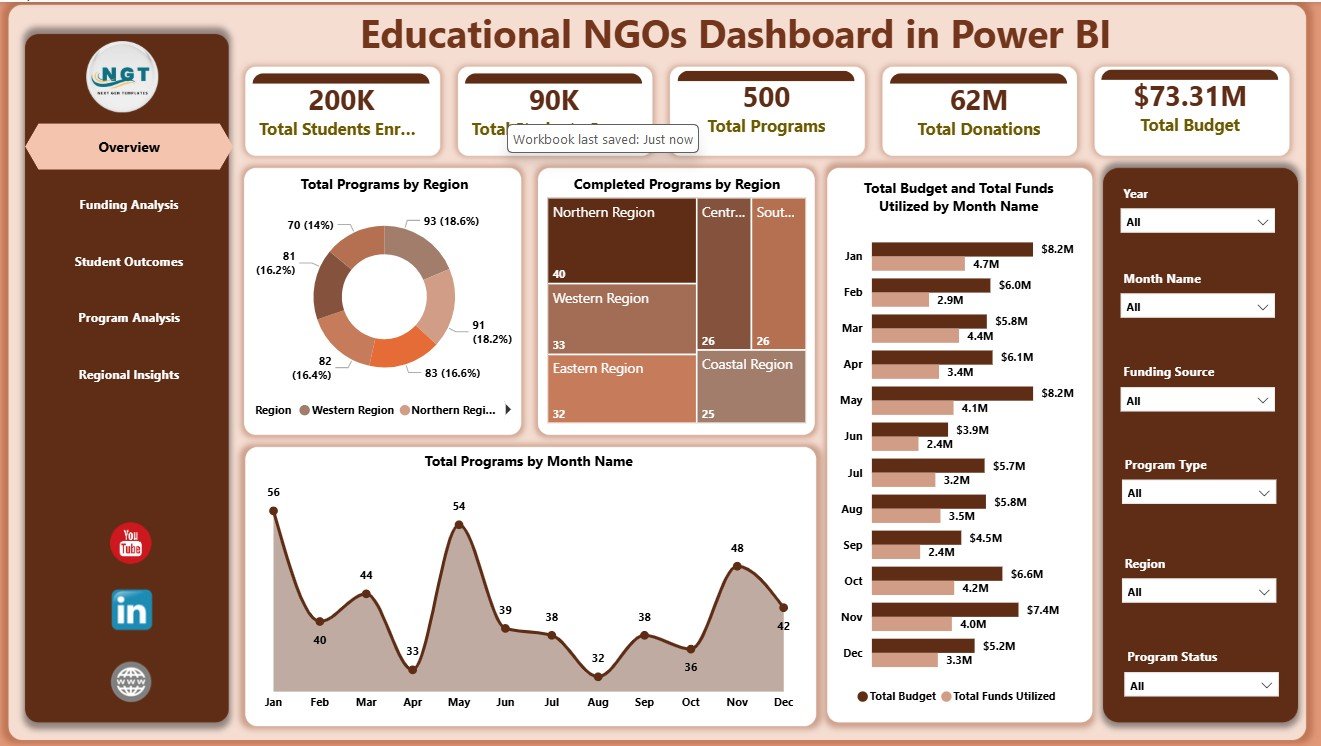
1. Overview Page
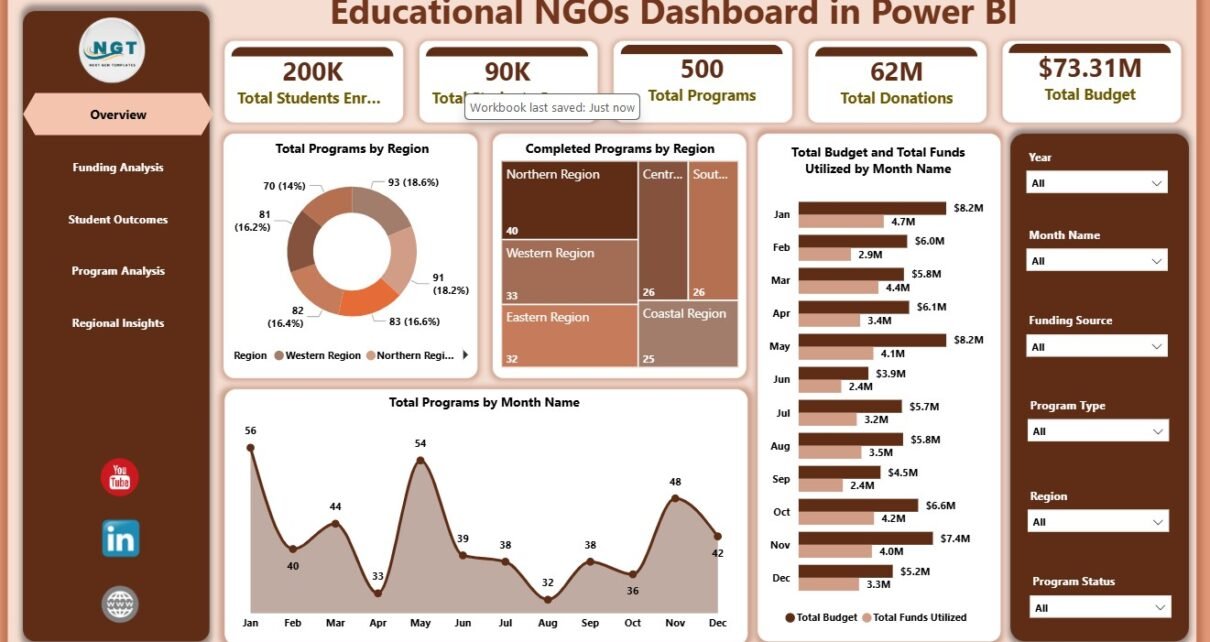
The Overview Page is the main executive summary for the report. At the top, it shows cards for Total Students Enrolled, Total Donations, Total Programs, Total Budget, and Total Funds Utilized. These cards help NGO leaders understand education reach, donor support, program volume, and funding movement without opening multiple files.
Total Programs by Region: This chart shows the distribution of education programs across regions. It helps leadership review geographic coverage and identify where program activity is concentrated.
Completed Programs by Region: This visual compares completed program counts by region. It helps managers spot strong delivery areas and regions that may need closer follow-up.
Total Budget and Total Funds Utilized by Month Name: This chart compares planned budget with actual utilization by month. It helps finance and program teams monitor whether spending is aligned with the delivery calendar.
Total Programs by Month Name: This chart shows program volume across months. It is useful for understanding seasonal activity, planning cycles, and high workload periods.
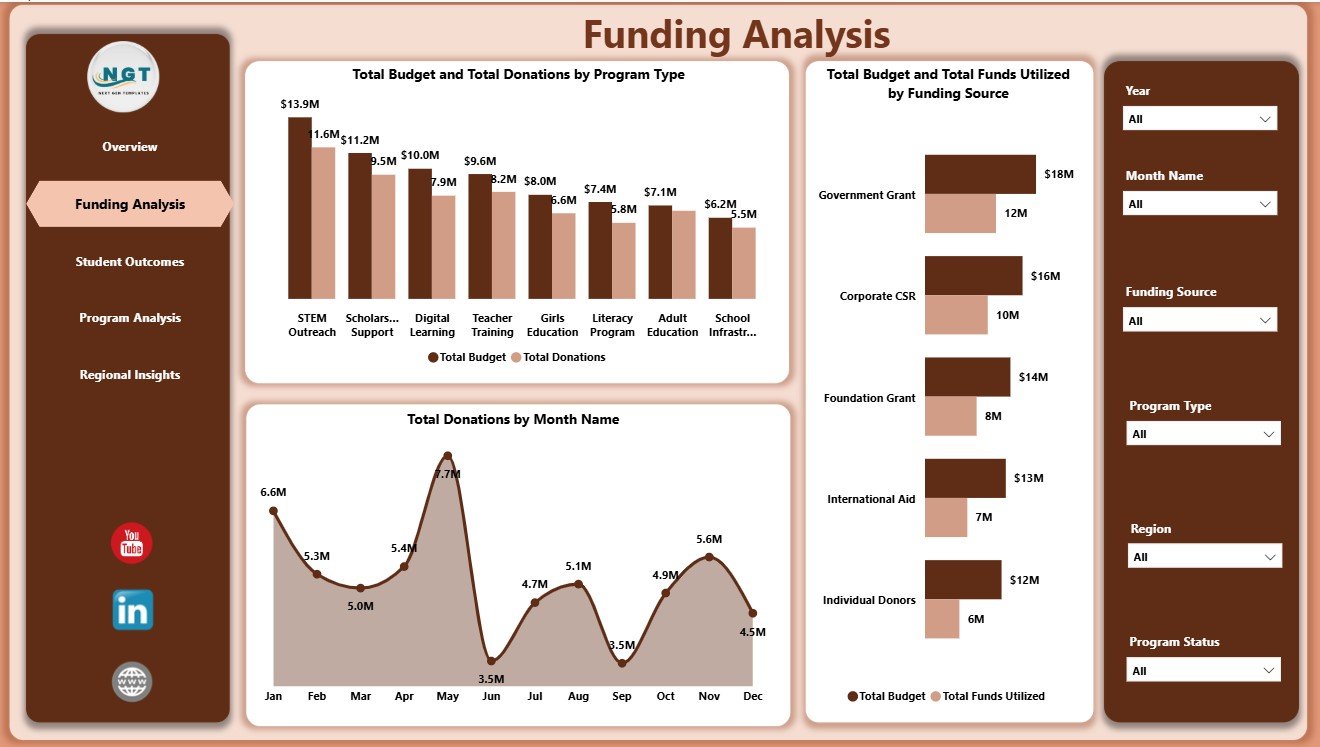
2. Funding Analysis
The Funding Analysis page focuses on budget and donation performance. Total Budget and Total Donations by Program Type shows which program categories receive stronger funding support. This helps donor reporting teams explain where financial resources are concentrated.
Total Donations by Month Name shows donation movement across the year. Total Budget and Total Funds Utilized by Funding Source compares approved budgets with actual utilization by source, helping finance teams track whether grant or donor funds are being used on schedule.
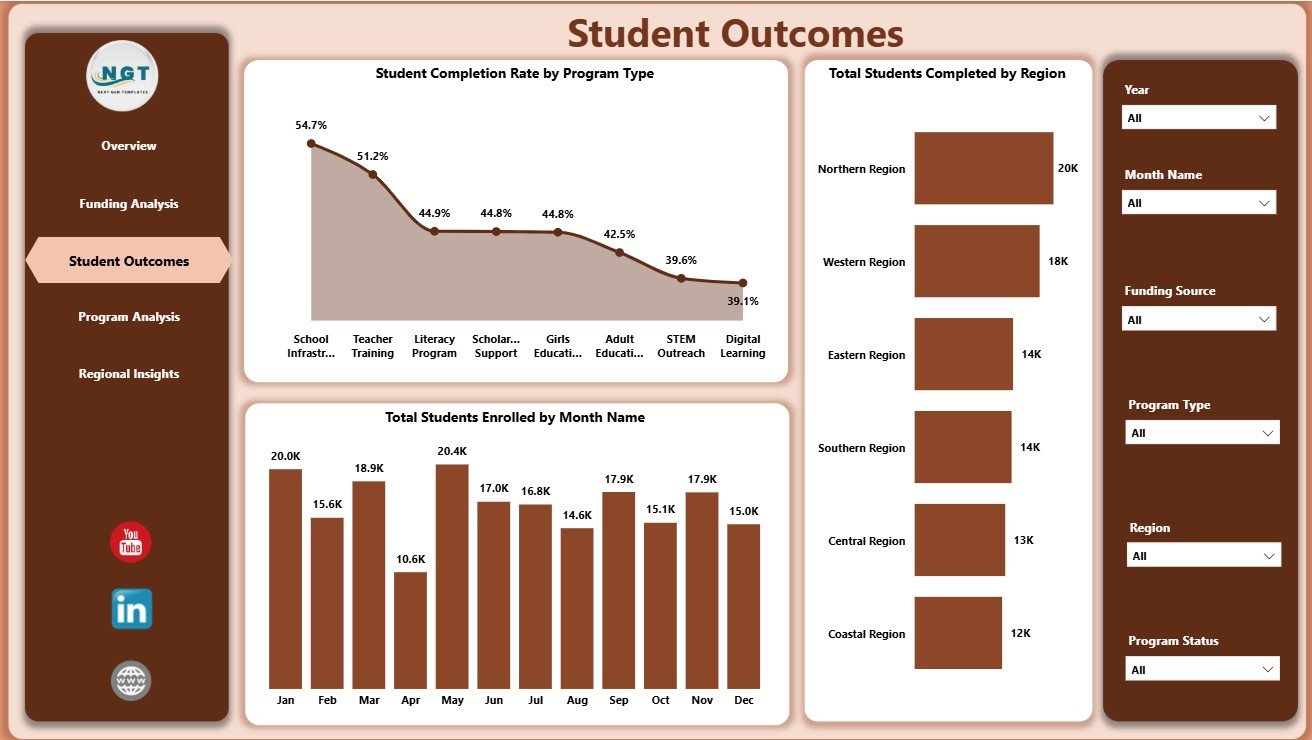
3. Student Outcomes
The Student Outcomes page connects program activity with learner results. Student Completion Rate by Program Type shows which intervention categories are converting enrollment into completed outcomes. This is one of the most useful visuals for education impact conversations.
Total Students Enrolled by Month Name helps teams review intake and enrollment trends over time. Total Students Completed by Region highlights regions with stronger completed student outcomes, supporting donor updates and regional performance reviews.
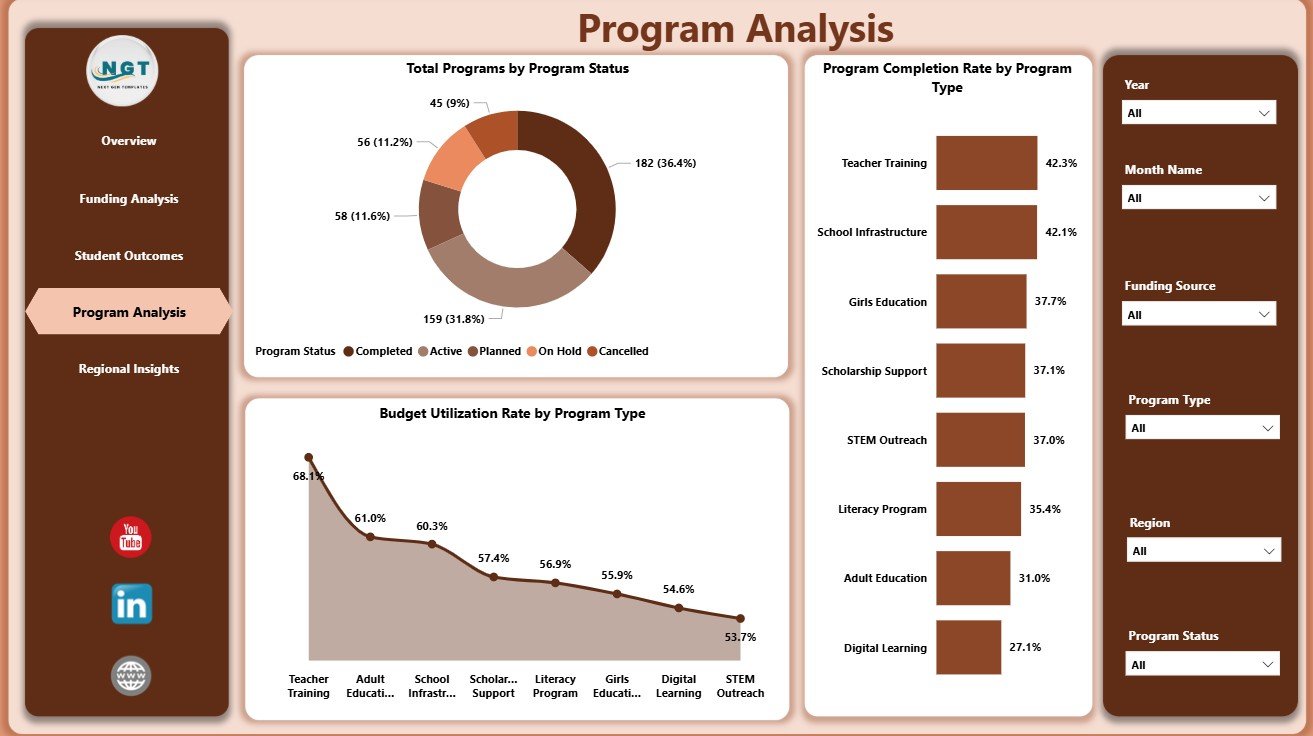
4. Program Analysis
The Program Analysis page helps teams review delivery status and program quality. Total Programs by Program Status shows how many programs are active, completed, pending, delayed, or in another status. This makes operational discussions more direct.
Budget Utilization Rate by Program Type compares spending efficiency across program categories. Program Completion Rate by Program Type helps identify which types of education programs are completing well and which may need additional support.
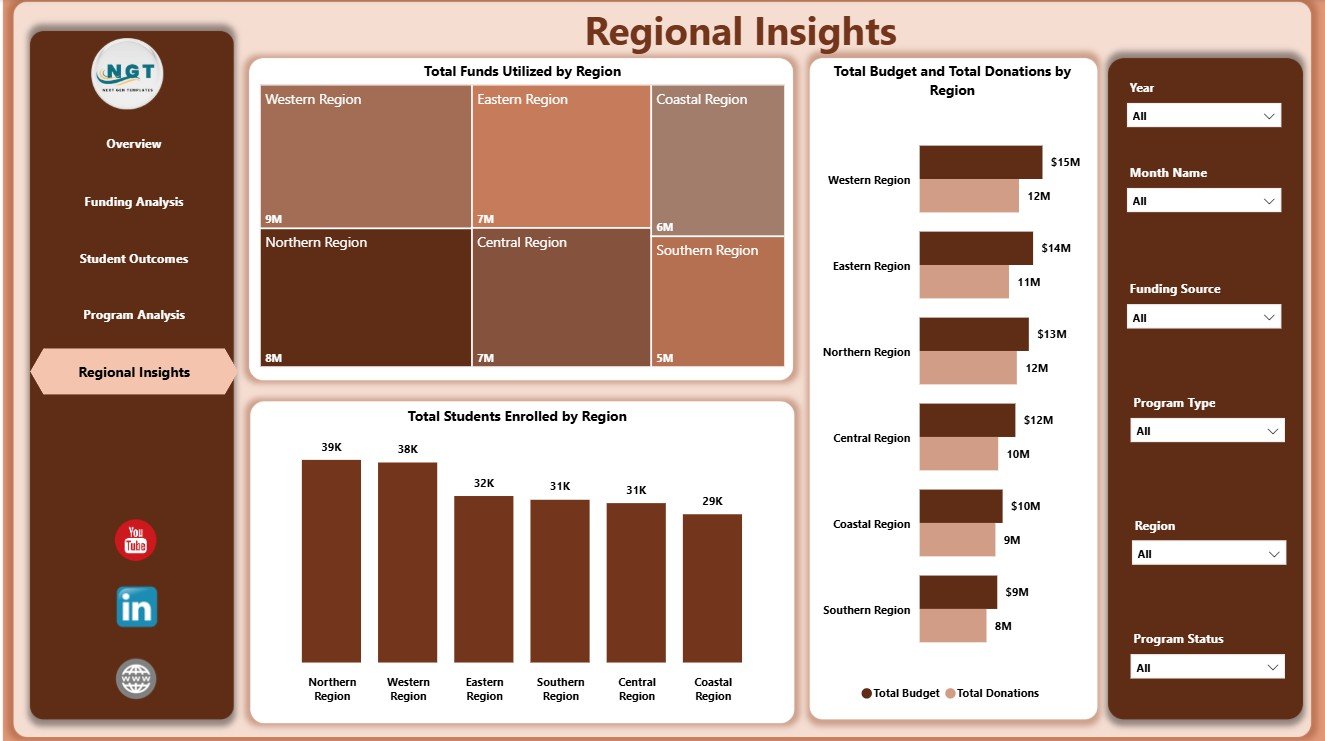
5. Regional Insights
The Regional Insights page is designed for comparing locations. Total Funds Utilized by Region shows where money has actually been spent, while Total Students Enrolled by Region shows education reach across operating areas.
Total Budget and Total Donations by Region compares planned funding and donation support geographically. This view helps leadership balance resources, review donor coverage, and prepare region-specific presentations.
Educational NGOs Dashboard in Power BI vs. Tableau vs. Paid NGO SaaS – Feature Comparison
| Feature | Educational NGOs Dashboard in Power BI | Tableau Alternative | Paid NGO SaaS |
|---|---|---|---|
| Cost | $17.99 one-time | Requires Tableau licensing | Recurring subscription |
| Platform | Power BI Desktop | Tableau Desktop or Cloud | Vendor-hosted app |
| Setup time | Open .pbix, replace data, refresh | Build workbook and model | Requires onboarding |
| Real-time collaboration | Available through Power BI Service | Available through Tableau Cloud | Usually included |
| Mobile access | Available through Power BI apps after publishing | Available through Tableau apps | Usually included |
| Customizable fields | Editable report and model | Editable if built internally | Limited by vendor settings |
| Share with link | Possible through Power BI Service | Possible through Tableau Cloud | Usually account based |
| Year-1 cost at 5 users | $17.99 plus any Microsoft licensing | Usually higher license cost | Often hundreds or thousands |
| Education NGO analytics | Pre-built across 5 pages | Must be designed | Depends on module or plan |
Who Should Use This Template
This template is useful for educational NGOs, nonprofit education teams, literacy programs, scholarship support teams, regional program coordinators, community learning centers, donor reporting analysts, and finance teams that already maintain structured program data. It is especially helpful when leadership needs one report for student reach, donation performance, budget utilization, program status, and regional comparison.
It is not intended to replace a donor CRM, grant approval workflow, accounting platform, student case management tool, or learning management system. It is a reporting layer for Power BI, not a full operational system.
Real-World Use Cases
Amina, NGO director: Amina uses the Overview and Regional Insights pages before board meetings to explain student reach, donation movement, budget utilization, and regional delivery.
Ravi, program manager: Ravi uses Program Analysis to compare status, completion rate, and budget utilization by program type so he can prioritize follow-up actions.
Sofia, donor reporting analyst: Sofia uses Funding Analysis to prepare monthly donor updates that show donations, budgets, funding sources, and utilization trends.
Advantages of Educational NGOs Dashboard in Power BI
- Faster reporting: Start from a ready Power BI report instead of building pages and visuals from zero.
- Focused nonprofit education metrics: The report is structured around students, donations, programs, budgets, utilization, and regions.
- Interactive analysis: Slicers let users filter multiple visuals quickly during management review.
- Editable structure: Users can adjust fields, charts, measures, colors, labels, and data sources.
- One-time purchase: Practical for teams that need analytics without adding another monthly software subscription.
Opportunities for Improvement
As with any Power BI dashboard, the quality of the final report depends on clean source data. Teams should keep region names, program types, month names, funding source names, and program status values consistent. Larger NGOs may later connect the report to SharePoint, SQL, Dataverse, or another central database. Organizations that need approval workflows, donor communications, individual student records, or audit trails should use this dashboard alongside their operational systems.
Best Practices
- Keep one clean record structure for program, funding, student, and regional data.
- Use consistent names for regions, funding sources, program types, and status values.
- Refresh the report after every source data update.
- Review budget utilization together with program completion, not separately.
- Use slicers to prepare donor-specific, region-specific, or month-specific views.
- Publish to Power BI Service only after validating data accuracy and permissions.
Explore Relevant Templates
You can purchase the Educational NGOs Dashboard in Power BI from NextGenTemplates. You may also want to review Educational NGOs Dashboard in Excel, Disability Support NGOs Dashboard in Power BI, Nonprofit Grant Dashboard in Power BI, and more Power BI Dashboard Templates.
Frequently Asked Questions
What is the Educational NGOs Dashboard in Power BI?
It is a Power BI dashboard template for tracking education NGO donations, budgets, funds utilized, student enrollment, student completions, program status, completion rates, and regional performance.
What pages are included?
The report includes Overview, Funding Analysis, Student Outcomes, Program Analysis, and Regional Insights pages.
Can I use my own data?
Yes. Replace the sample data source with your own structured NGO data and refresh the report in Power BI Desktop.
Do I need Power BI Desktop?
Yes. Power BI Desktop is used to open and edit the .pbix file. Publishing and sharing online may require Power BI Service licensing.
Can I customize the dashboard?
Yes. You can edit visuals, colors, fields, report pages, relationships, and data source settings if you are comfortable with Power BI.
Is this a donor CRM?
No. It is an analytics dashboard. It does not manage donor communications, accounting transactions, grant approvals, or individual student case records.
About the Author
Built by PK – Microsoft Certified Professional with 15+ years of Excel, Google Sheets, and Power BI experience. Founder of NextGenTemplates, reaching 300K+ subscribers across YouTube channels. Every template is hand-built and tested before release.
Conclusion
The Educational NGOs Dashboard in Power BI gives nonprofit education teams a practical way to review donations, budgets, funds utilized, programs, student outcomes, completion rates, and regional performance from one interactive report. It is a useful starting point for donor reporting, internal reviews, and monthly program analysis.
Click here to purchase Educational NGOs Dashboard in Power BI
Visit our YouTube channel for step-by-step Excel and Power BI tutorials: Youtube.com/@PKAnExcelExpert.