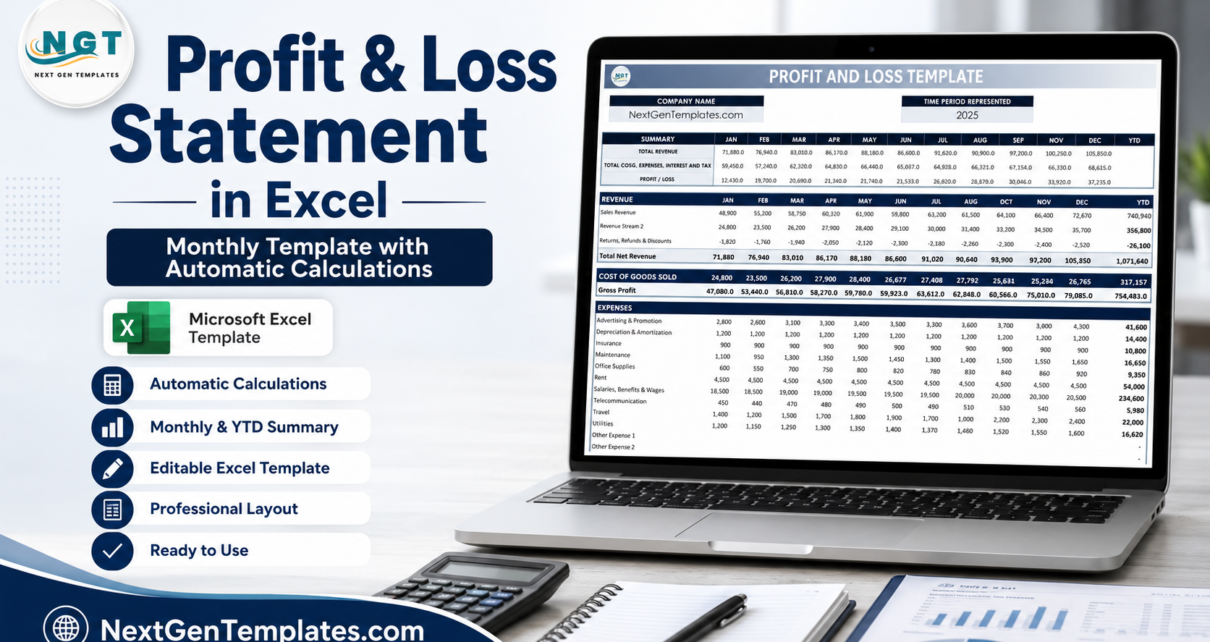
A monthly profit and loss statement gives a business owner one clear view of revenue, costs, gross profit, operating expenses, and net profit. That matters because most businesses do not fail from one dramatic event; they usually drift into trouble when small margin changes go unnoticed. The U.S. Bureau of Labor Statistics reported that only 34.7 percent of business establishments born in 2013 were still operating in 2023, which is a sharp reminder that owners need simple financial visibility every month.
This tutorial shows how to set up a profit loss Excel workbook, what automatic calculations to include, and how to use a monthly P&L template as a practical income statement Excel system. You can build the workbook yourself, or you can start faster with a ready-made template that already includes formulas, monthly sections, and dashboard views.
Download the Profit and Loss (P&L) Template in Excel
Key Features of a Monthly Profit & Loss Statement in Excel
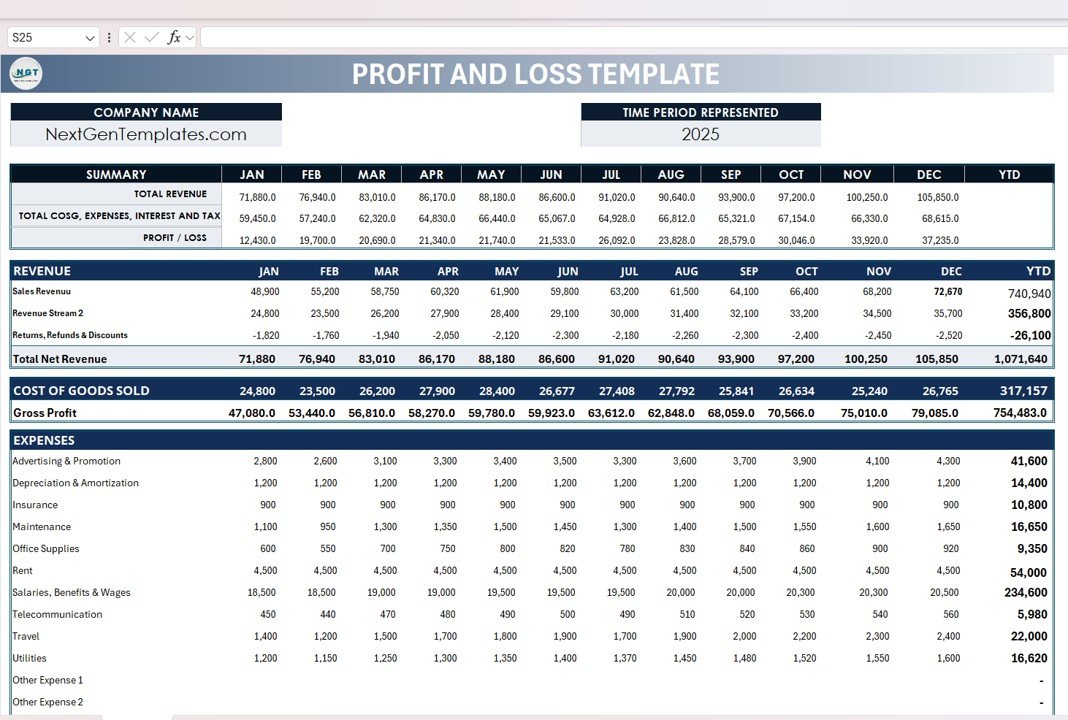
A good monthly P&L workbook should do more than list transactions. It should summarize the financial story of each month so you can see what changed, why it changed, and what to do next. At minimum, your income statement Excel file should include revenue categories, cost of goods sold, gross profit, operating expenses, other income or expenses, taxes, and net profit.
Automatic calculations are the main reason Excel works well for this task. Microsoft explains that the SUM function adds values, cells, and ranges, which makes it ideal for rolling up revenue and expense categories. A properly structured workbook can calculate total sales, total expenses, gross margin, net margin, month-over-month variance, and year-to-date performance without rebuilding formulas every reporting cycle.
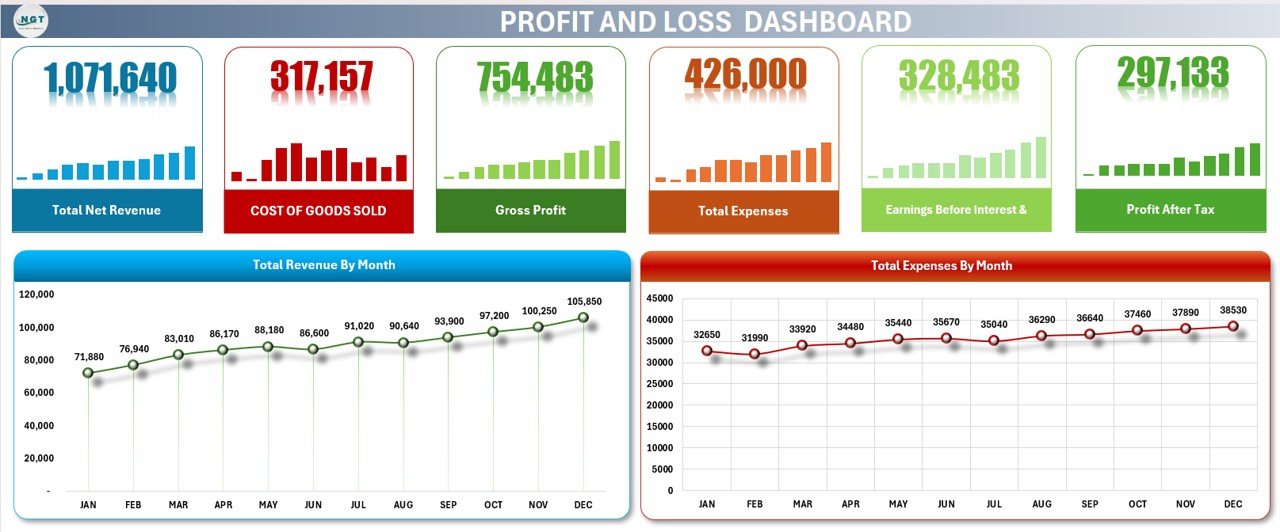
The best P&L template also includes a clean dashboard. A dashboard helps you scan revenue trends, top expense categories, profit margin, and monthly net income at a glance. This is especially useful for owners, consultants, freelancers, agencies, clinics, restaurants, service businesses, and inventory-based companies that need quick financial check-ins without opening a full accounting system every time.
Template Sections Explained
The first section should be a setup or control sheet. This is where you define the fiscal year, month labels, business name, reporting currency, revenue categories, expense categories, and any tax or adjustment lines. Keeping these assumptions in one place makes the file easier to maintain.
The second section is revenue. You can group revenue by product, service line, customer type, location, project, channel, or department. For a simple monthly model, the total revenue formula might be =SUM(B5:B12). If you track multiple months across columns, each month should use the same row structure so formulas can be copied consistently.
The third section is cost of goods sold or direct costs. These are expenses tied directly to delivering the product or service. Examples include raw materials, supplier costs, contract labor, payment processing fees, packaging, or delivery costs. Gross profit is calculated as revenue minus direct costs. Gross margin is gross profit divided by revenue.
The fourth section is operating expenses. Typical rows include salaries, rent, software, advertising, utilities, insurance, subscriptions, professional fees, travel, repairs, and office expenses. Net operating profit is calculated after subtracting operating expenses from gross profit.
The final statement section should calculate net profit. A practical formula structure is: revenue minus cost of goods sold, minus operating expenses, plus or minus other income and expenses, minus taxes. The dashboard can then show net profit, net margin, total revenue, total expenses, and year-to-date totals.
Profit & Loss Statement in Excel vs. Google Sheets vs. Accounting Software
| Feature | Excel P&L Template | Google Sheets | Accounting Software |
|---|---|---|---|
| Best use case | Monthly reporting, budgeting, owner review | Shared lightweight reporting | Bookkeeping, invoicing, bank feeds |
| Setup speed | Fast with a prepared workbook | Fast, but formatting can drift | Requires account setup and chart of accounts |
| Formula control | High control over every calculation | High control with online collaboration | Lower formula control, stronger automation |
| Dashboard flexibility | Strong charts, pivots, and custom summaries | Good for simple charts | Depends on plan and vendor |
| Collaboration | Best with OneDrive or SharePoint | Native browser collaboration | Role-based user access |
| Cost profile | Low one-time template cost | Low if you already use Google Workspace | Usually monthly subscription |
Excel is not a replacement for bookkeeping software when you need invoicing, bank reconciliation, payroll, or tax filing workflows. It is excellent, however, for management reporting. Many businesses use accounting software for transaction capture and Excel for analysis, scenario planning, cleanup, monthly summaries, and executive reporting.
Who Should Use This Template
A monthly P&L template in Excel is useful for small business owners who want a readable income statement without building one from scratch. It also works for freelancers, ecommerce sellers, local service companies, consultants, marketing agencies, rental property operators, nonprofit program managers, and department leaders who need monthly financial snapshots.
It is also valuable for startup founders and side-business operators. Early-stage businesses often need to understand whether revenue growth is improving profit or simply creating more cost. A monthly profit loss Excel workbook can reveal whether advertising spend is producing enough gross profit, whether subscriptions are creeping upward, or whether labor costs are outpacing sales.
Real-World Use Cases
Use the workbook during monthly close to compare actual results against the prior month. If revenue increased but net profit fell, the statement helps you isolate whether the issue came from direct costs, payroll, marketing, supplier price increases, or one-time expenses.
Use it for budgeting before a new quarter begins. Enter expected revenue, planned expenses, and target margins, then compare the forecast to actual results each month. This makes the template a practical planning tool, not just a reporting file.
Use it before loan applications, investor updates, management meetings, and pricing reviews. A clean P&L statement can help explain the operating health of the business in a format that non-accountants can understand quickly.
Advantages of a P&L Template in Excel
The biggest advantage is transparency. You can click a cell, inspect the formula, adjust categories, and adapt the workbook to your reporting style. You are not locked into a rigid report layout.
Excel also supports formulas, charts, conditional formatting, pivot tables, and simple what-if analysis. Microsoft provides many financial management template resources, which shows why spreadsheet-based planning remains a familiar workflow for finance and operations teams.
A ready-made template reduces setup time. Instead of building formulas, formatting monthly columns, creating charts, and checking calculation links manually, you can start with a tested structure and customize it for your categories.
Opportunities for Improvement
No Excel template is perfect for every business. If you sell physical products, you may need deeper inventory, freight, and landed-cost tracking. If you manage multiple entities, you may need a consolidation workbook. If you run a SaaS business, you may want rows for monthly recurring revenue, churn, expansion revenue, and customer acquisition cost.
The best approach is to start with the core P&L, then add supporting tabs only when they improve decisions. Too many tabs can make the workbook harder to use. Keep the statement clean, protect formula cells, and document any custom formulas so the file remains easy to audit.
Best Practices
Use consistent account names every month. If you call an expense Software in January and Subscriptions in February, trend analysis becomes harder. Keep category labels stable and add notes when something unusual happens.
Separate inputs from formulas. Users should enter monthly values in clearly marked cells, while summary rows and dashboard metrics should calculate automatically. Protect formula ranges if multiple people use the workbook.
Review gross margin and net margin every month, not only total revenue. Revenue can rise while profit quality weakens. Margin review helps you catch supplier increases, labor inefficiency, discounting issues, and overhead growth early.
Keep a backup copy before major changes. When you add rows, columns, or categories, check totals against the prior version to make sure the formulas still capture every line.
Explore Relevant Templates
The best starting point for this tutorial is the Profit and Loss (P&L) Template in Excel. It is designed for monthly income statement tracking with automatic calculations and dashboard-style reporting.
If you run a smaller operation and want a simpler version, explore the Small Business Profit and Loss Template in Excel. If you also need to understand cash movement, pair your P&L review with the Cash Flow Template in Excel.
For more Excel walkthroughs, dashboards, and spreadsheet tutorials, visit the PK: An Excel Expert YouTube channel.
Frequently Asked Questions
What is a profit and loss statement in Excel?
It is an Excel workbook that summarizes revenue, costs, expenses, and net profit for a specific period. A monthly version shows each month side by side so you can review trends and compare performance.
Is a P&L statement the same as an income statement?
Yes. In most business contexts, profit and loss statement, P&L statement, and income statement refer to the same core financial report.
Which formulas should a P&L template include?
Common formulas include SUM for revenue and expense totals, gross profit as revenue minus direct costs, gross margin as gross profit divided by revenue, and net profit as total income minus total expenses.
Can I use this template instead of accounting software?
You can use Excel for monthly reporting, budgeting, analysis, and management review. For official bookkeeping, payroll, taxes, invoicing, and bank reconciliation, you may still need accounting software or a qualified accountant.
How often should I update a monthly P&L template?
Update it at least once per month after your books are closed. Many owners also update a forecast version weekly so they can monitor expected profit before the month ends.
About the Author
Built by PK – Microsoft Certified Professional with 15+ years of Excel, Google Sheets, and Power BI experience. Founder of NextGenTemplates, reaching 300K+ subscribers across YouTube channels. Every template is hand-built and tested before release.
Conclusion
A monthly profit and loss statement in Excel gives you a practical way to monitor business performance without overcomplicating the process. With consistent categories, automatic formulas, margin calculations, and dashboard visuals, your P&L template can become a monthly decision tool instead of a static report.
Start with the core statement, review it every month, and connect the results to pricing, expense control, hiring, and growth decisions. That is where a simple income statement Excel workbook becomes genuinely useful.
Sources: U.S. Bureau of Labor Statistics business survival data, Microsoft SUM function documentation, and Microsoft financial management templates.


