Private Clubs Dashboard in Excel
The Private Clubs Dashboard in Excel is a professional reporting template for private clubs, country clubs, social clubs, and membership-based organizations. It helps track dues revenue, event revenue, food and beverage revenue, operating profit, members, visits, referrals, retention, and satisfaction in one Excel workbook.
This dashboard is built with multiple pages, KPI cards, interactive slicers, charts, a structured Data sheet, and a Support sheet with pivot tables. After updating the Data sheet, you can use Refresh All from the Excel Data tab to update the dashboard automatically.
Download the Private Clubs Dashboard in Excel
Overview Page
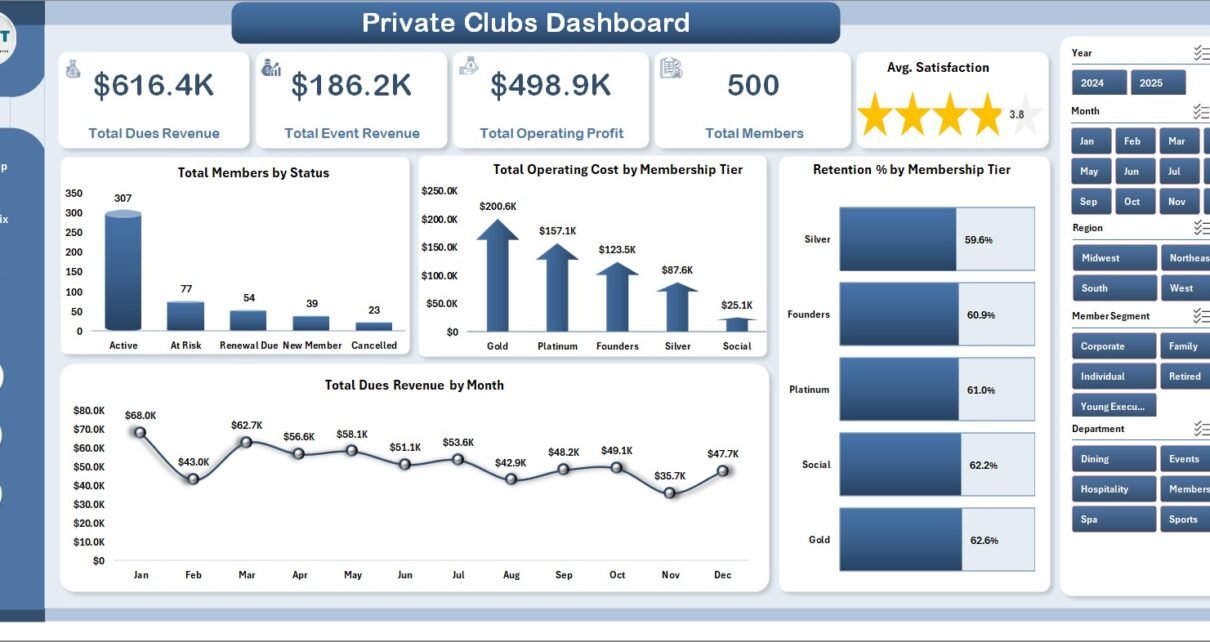
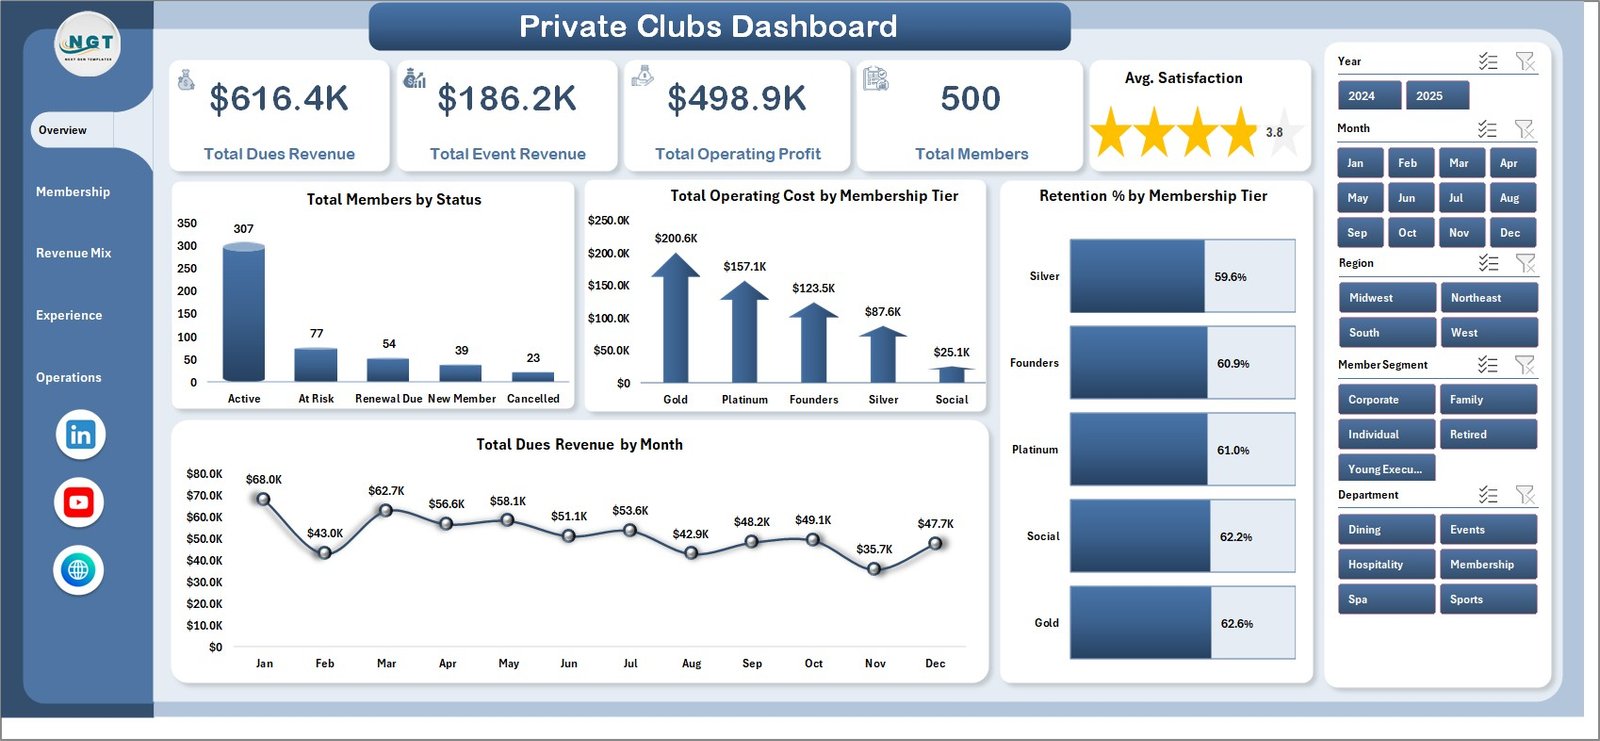
The Overview page shows the high-level performance of the club. It includes KPI cards for total dues revenue, total event revenue, total operating profit, total members, and average satisfaction.
Cards on the Overview Page
- Total Dues Revenue: Shows the total recurring revenue collected from member dues. This helps clubs monitor the strength of their membership income.
- Total Event Revenue: Tracks revenue generated from club events. This gives management a quick way to evaluate event performance.
- Total Operating Profit: Displays the profit after operating costs. It helps decision-makers understand the financial result of club operations.
- Total Members: Shows the total member count. This gives a quick view of overall membership size.
- Avg. Satisfaction: Displays the average satisfaction score. It helps monitor member experience and service quality.
Charts on the Overview Page
- Total Members by Status: This chart breaks members into status groups such as active, inactive, or pending. It helps identify how many members are currently engaged with the club.
- Total Operating Cost by Membership Tier: This chart compares operating costs across membership tiers. It helps identify tiers that require more operating support.
- Retention % by Membership Tier: This chart shows retention performance for each membership tier. It helps identify which tiers are keeping members longer.
- Total Dues Revenue by Month: This chart tracks monthly dues revenue. It helps show revenue seasonality and recurring income trends.
Membership Page
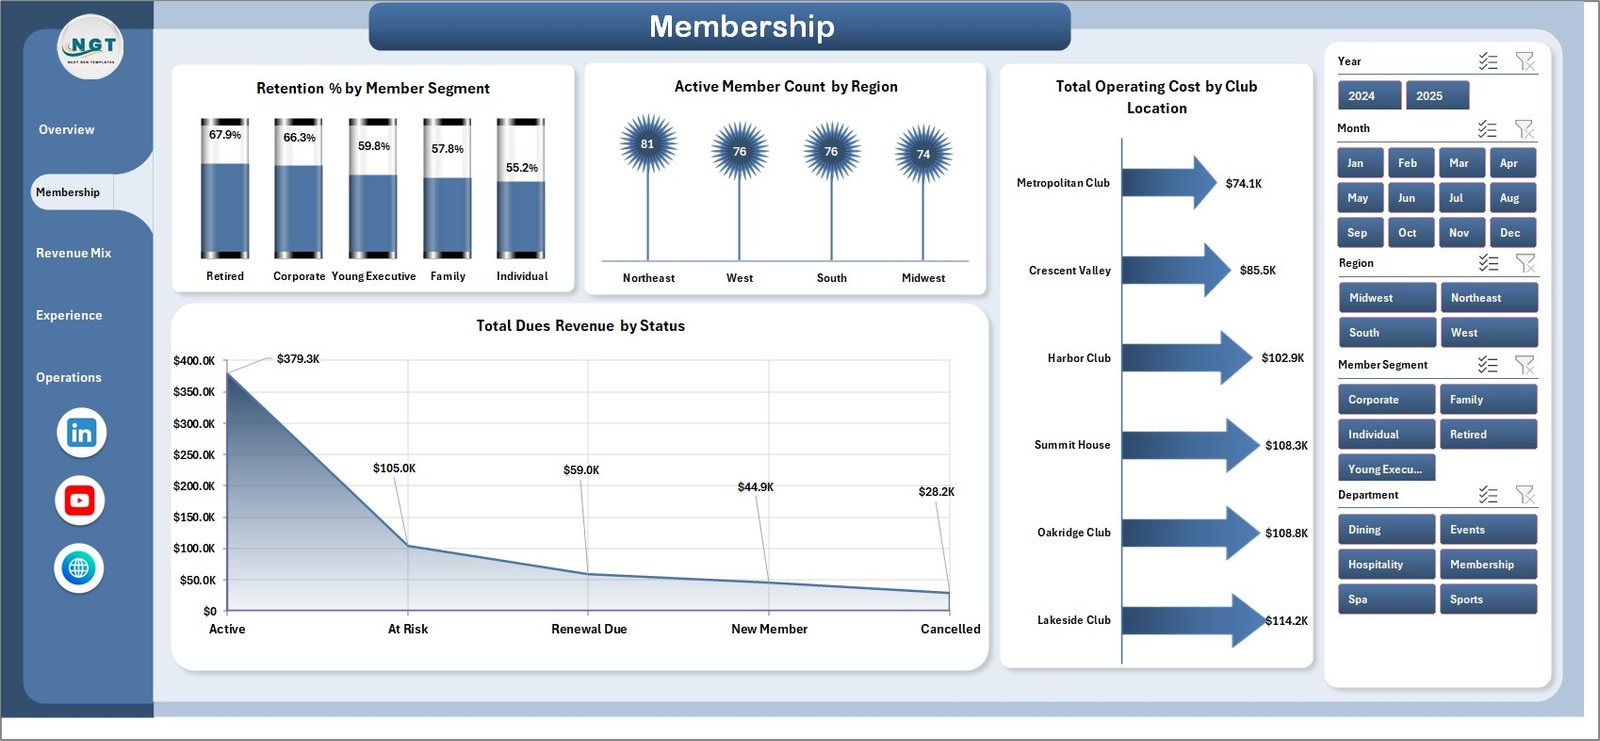
The Membership page provides analysis around retention, active members, operating costs, and dues revenue by member-related dimensions. This page is useful for membership managers who need to understand member behavior and participation.
- Retention % by Member Segment: This chart compares retention by segment. It helps identify the strongest and weakest member groups for renewals.
- Active Member Count by Region: This chart shows active members by region. It helps understand where the club has the strongest active membership base.
- Total Operating Cost by Club Location: This chart compares operating cost by location. It helps spot locations with higher operating expense.
- Total Dues Revenue by Status: This chart shows dues revenue by member status. It helps separate revenue contribution from active and other member groups.
Revenue Mix Page
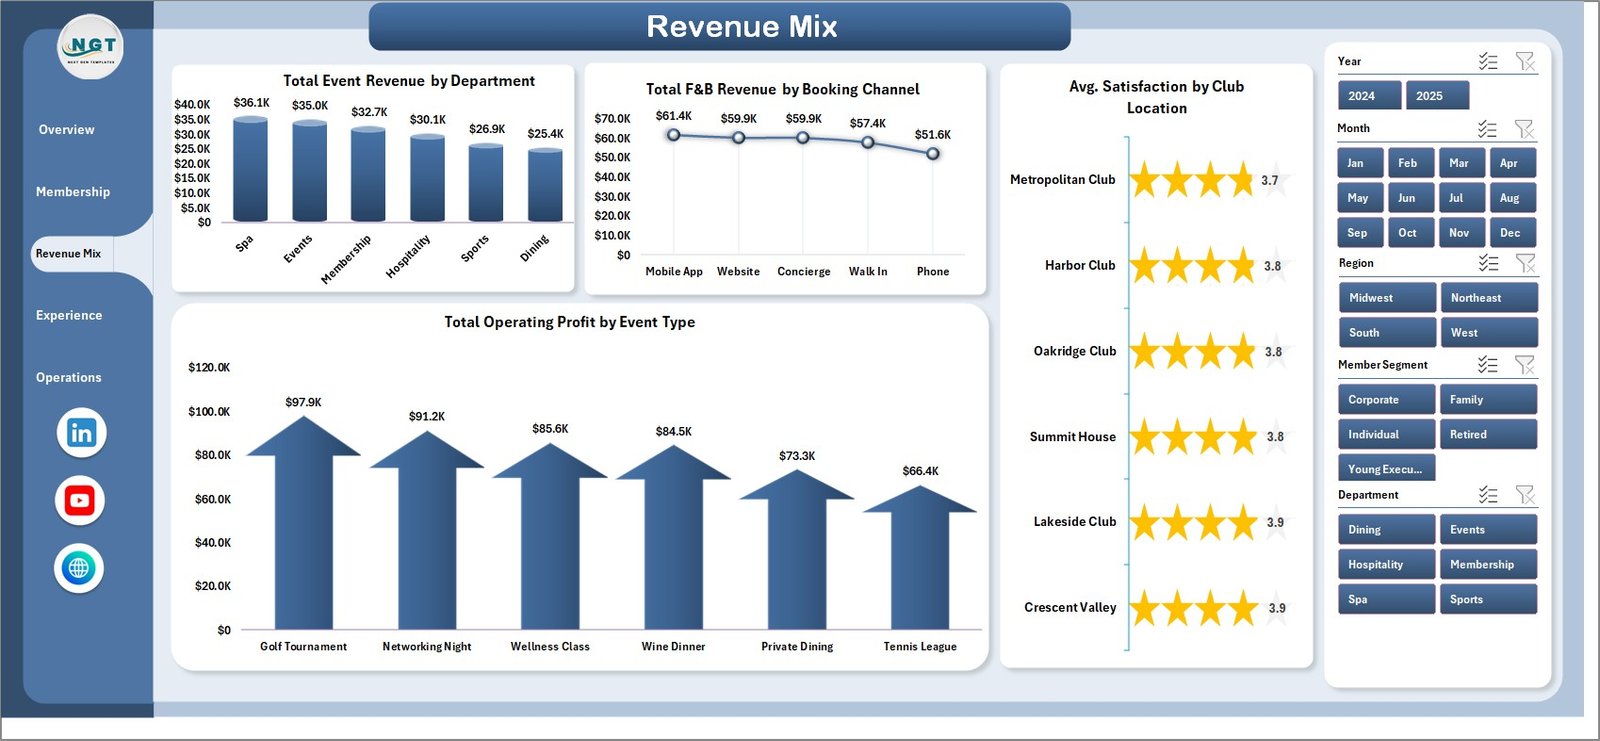
The Revenue Mix page focuses on how the club earns money across departments, channels, locations, and event types. It is useful for reviewing non-dues revenue and profitability drivers.
- Total Event Revenue by Department: This chart compares event revenue across departments. It helps identify which departments contribute most to event income.
- Total F&B Revenue by Booking Channel: This chart shows food and beverage revenue by booking channel. It helps reveal which channels generate stronger F&B sales.
- Avg. Satisfaction by Club Location: This chart compares satisfaction scores across locations. It helps identify locations with stronger or weaker member experience.
- Total Operating Profit by Event Type: This chart compares operating profit by event type. It helps identify which events are most profitable for the club.
Experience Page
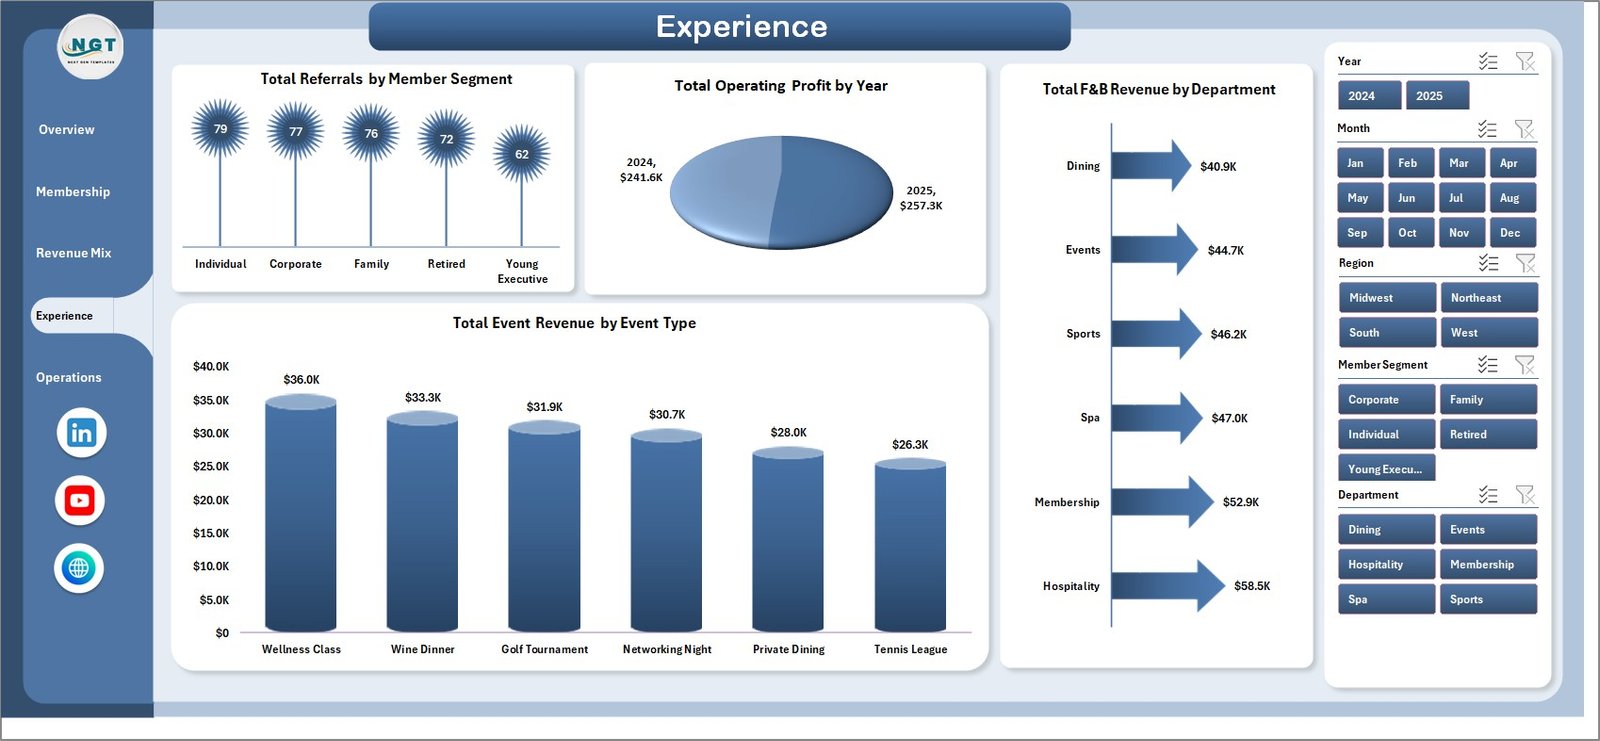
The Experience page helps connect member engagement, referrals, event performance, food and beverage revenue, and yearly operating profit. It gives club teams a better way to understand how member experience affects performance.
- Total Referrals by Member Segment: This chart shows referrals by member segment. It helps identify which segments are driving word-of-mouth growth.
- Total Operating Profit by Year: This chart tracks operating profit year by year. It helps review long-term growth and profitability trends.
- Total F&B Revenue by Department: This chart compares food and beverage revenue by department. It helps understand which departments are contributing most to F&B income.
- Total Event Revenue by Event Type: This chart compares revenue across event types. It helps management plan events that create stronger revenue outcomes.
Operations Page
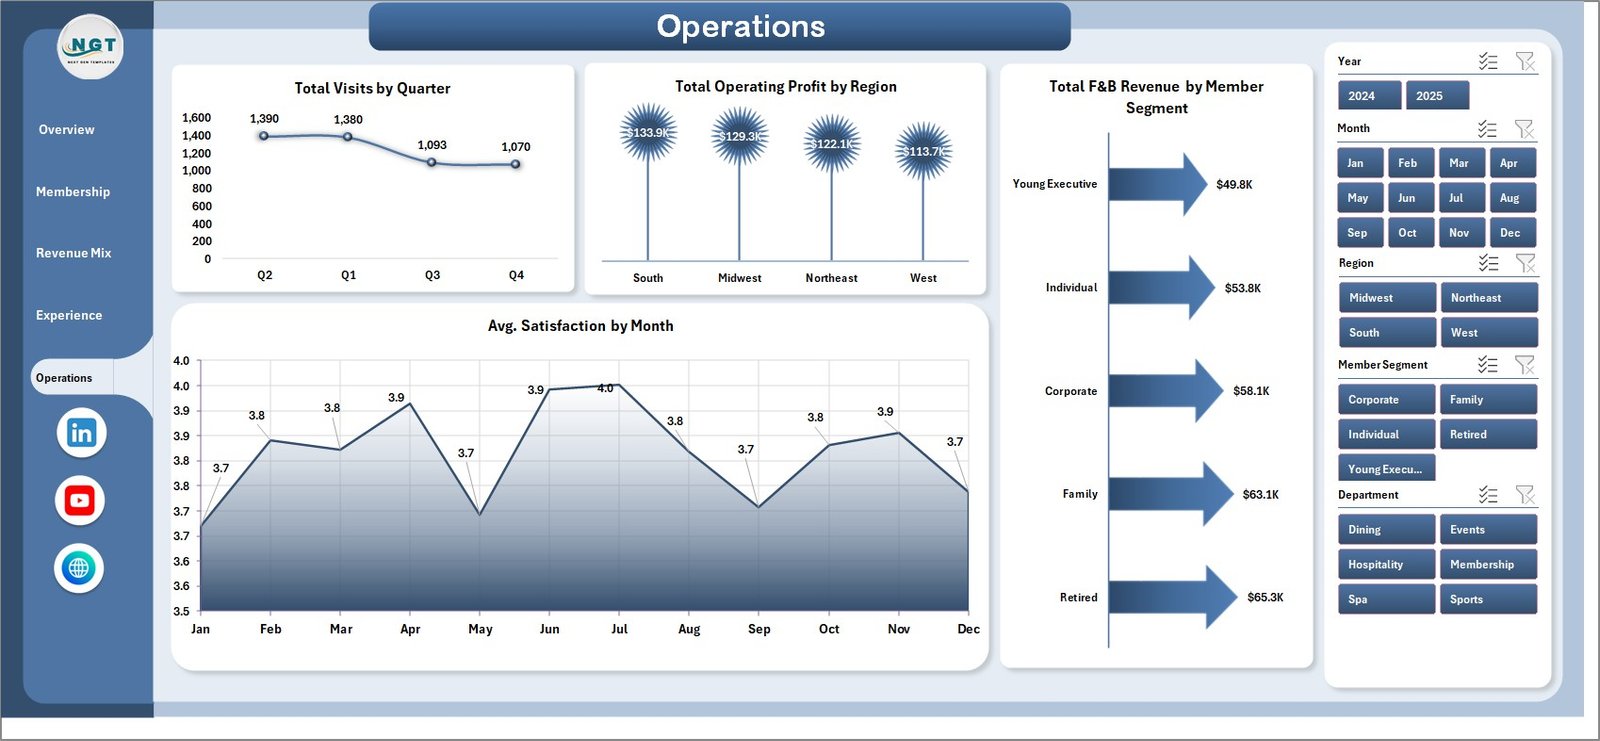
The Operations page gives a practical view of visits, regional profit, F&B revenue by segment, and satisfaction trends. This page is helpful for recurring operational reviews and leadership meetings.
- Total Visits by Quarter: This chart tracks total visits by quarter. It helps identify seasonal changes in club usage.
- Total Operating Profit by Region: This chart compares operating profit by region. It helps show where the club is performing best financially.
- Total F&B Revenue by Member Segment: This chart shows F&B revenue by member segment. It helps identify which member groups are spending more on food and beverage services.
- Avg. Satisfaction by Month: This chart tracks satisfaction by month. It helps monitor whether member experience is improving or declining.
Data Sheet Tab
The Data sheet is where users add their club records in the same format. Once the data is replaced or updated, the dashboard can be refreshed to show the latest club performance.

Support Sheet Tab
The Support sheet contains multiple pivot tables used to create the full dashboard dynamically. After updating the Data sheet, go to the Excel Ribbon, open the Data tab, and click Refresh All. All pivots and charts will refresh. This sheet can be kept hidden after setup.

Why Use This Private Clubs Dashboard?
- Monitor club revenue, profit, members, retention, referrals, visits, and satisfaction in Excel.
- Use dashboard pages for overview, membership, revenue mix, experience, and operations analysis.
- Apply slicers to filter the dashboard quickly.
- Update the Data sheet and refresh pivot tables to update the charts.
- Save time by starting with a ready-made Excel dashboard template.
Download the Template
You can get the ready-to-use file here: Private Clubs Dashboard in Excel.