WineBusiness Analytics counted 11,107 wineries in the United States at the start of 2026, down from 11,450 in 2025, which makes faster visibility into revenue, profit, production, visitor club growth, and inventory even more important for craft wineries. The Craft Winery and Vineyard Dashboard in Power BI gives winery owners, vineyard managers, tasting room teams, and consultants a ready-to-use PBIX report for reviewing performance across sales, vineyard operations, customer segments, wine club signups, and inventory.
This dashboard includes 5 Power BI report pages, 4 executive KPI cards, multiple slicers, and page-level charts for monthly, quarterly, regional, channel, grape variety, vineyard block, event type, wine label, and order type analysis. Open the file in Power BI Desktop, replace or connect the sample data, refresh the model, and use the report during owner reviews, tasting room meetings, production planning sessions, and inventory discussions.
Click here to purchase Craft Winery and Vineyard Dashboard in Power BI
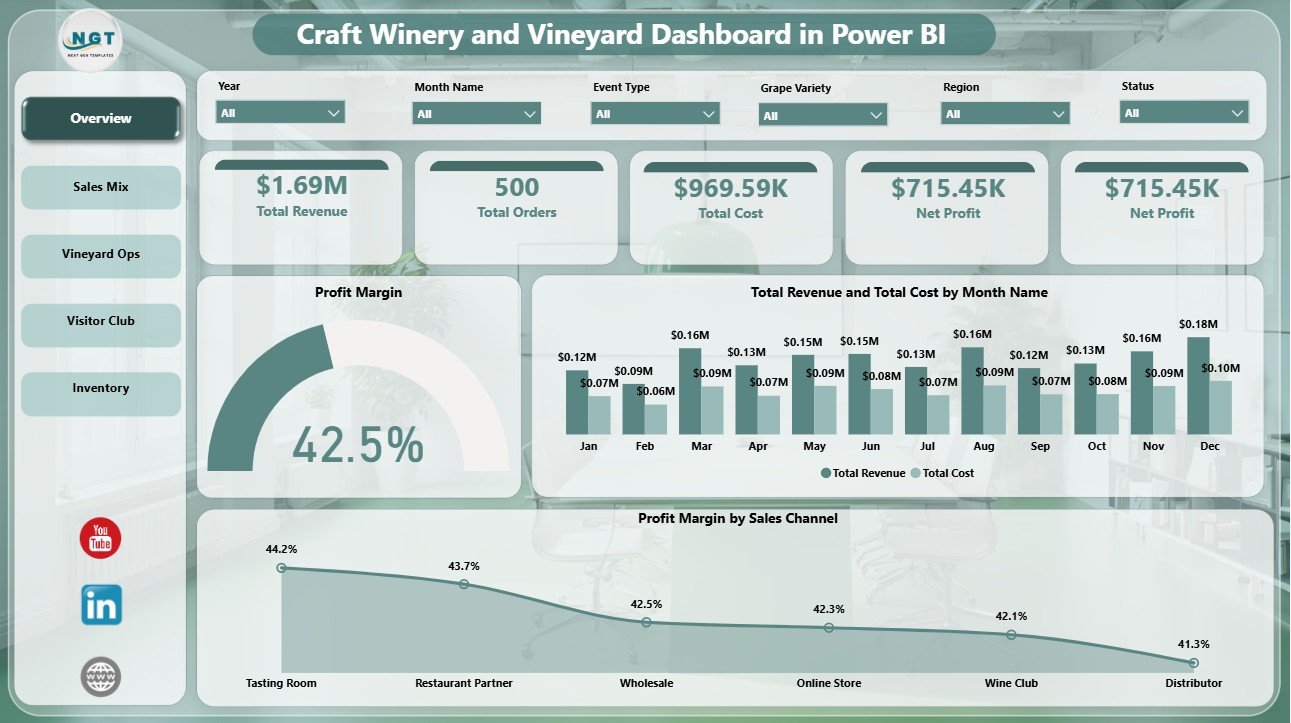
Craft Winery and Vineyard Dashboard in Power BI
Key Features of Craft Winery and Vineyard Dashboard in Power BI
- 5 report pages – Overview Page, Sales Mix, Vineyard Ops, Visitor Club, and Inventory.
- 4 high-level KPI cards – Total Revenue, Total Orders, Total Cost, and Net Profit.
- Sales and cost comparison – Review Total Revenue and Total Cost by Month Name and by Quarter.
- Profitability views – Analyze Profit Margin by Overall Performance, Sales Channel, and Region.
- Production and vineyard views – Compare bottles sold by grape variety, cases produced by vineyard block, and cases produced by wine label.
- Visitor and club tracking – Monitor total orders by customer segment, wine club signups by month, and event-related cost.
- Interactive slicers – Filter the dashboard quickly during live review meetings.
- Editable PBIX file – Customize pages, visuals, fields, measures, colors, and data source connections in Power BI Desktop.
Dashboard Pages Explanation
1 – Overview Page
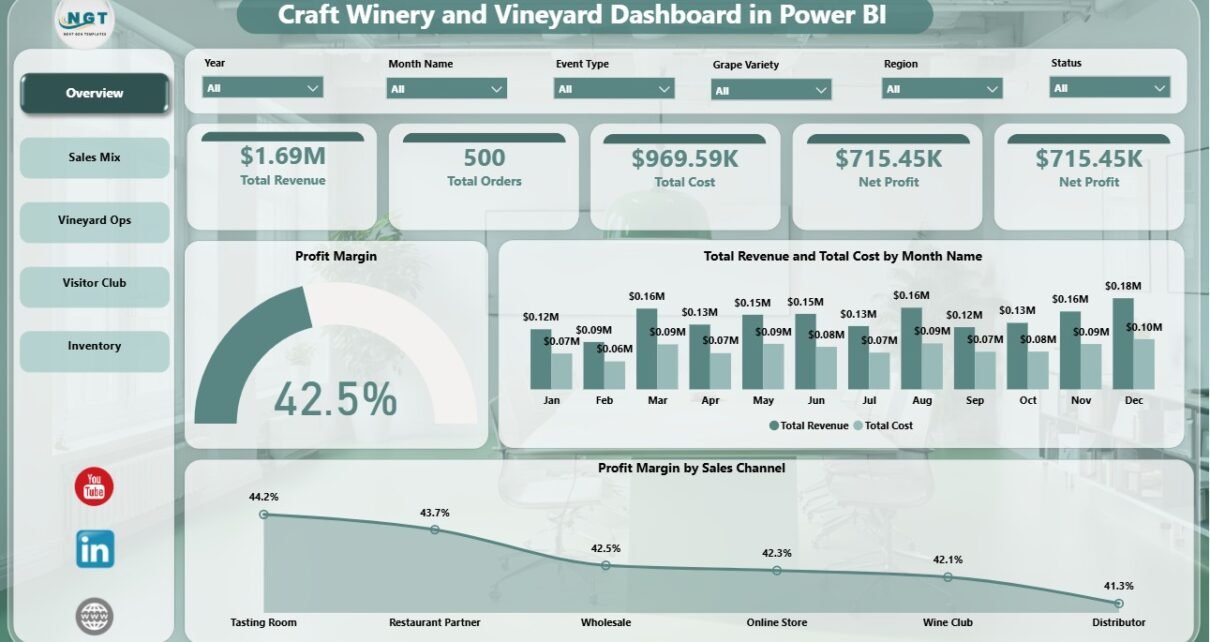
The Overview Page is the executive view of the Power BI report. At the top, KPI cards show Total Revenue, Total Orders, Total Cost, and Net Profit so decision-makers can understand the financial position of the winery before moving into deeper pages.
This page also includes slicers so users can apply filters and see the filtered dashboard quickly. It is useful for monthly owner reviews, tasting room performance meetings, and high-level profitability discussions.
Profit Margin by Overall Performance
This chart helps users understand how profitability is distributed across performance groups or categories. It makes it easier to see whether strong revenue is also producing healthy margin.
Total Revenue and Total Cost by Month Name
This chart compares revenue and cost month by month. It helps reveal seasonal pressure, high-cost months, and months where the winery generated stronger operating spread.
Profit Margin by Sales Channel
This chart compares margin across sales channels such as tasting room, wine club, wholesale, online, or event channels depending on the source data. It helps identify channels that deserve more focus or pricing review.
Craft Winery and Vineyard Dashboard in Power BI
2 — Sales Mix
The Sales Mix page helps winery teams understand where profit, bottle movement, grape variety demand, and vineyard block production are coming from. It is useful for comparing commercial performance across regions, grape varieties, and production sources.
Net Profit by Region
This chart shows which regions contribute the most bottom-line profit. It helps owners and sales teams prioritize regions for distribution, events, promotions, or follow-up analysis.
Total Bottles Sold by Grape Variety
This chart compares bottle movement by grape variety. It helps identify which varieties are selling strongest and which may need stronger promotion or production adjustment.
Total Cases Produced by Vineyard Block
This chart connects production output to vineyard blocks. It helps vineyard and cellar teams compare block-level contribution and review production planning before the next harvest cycle.
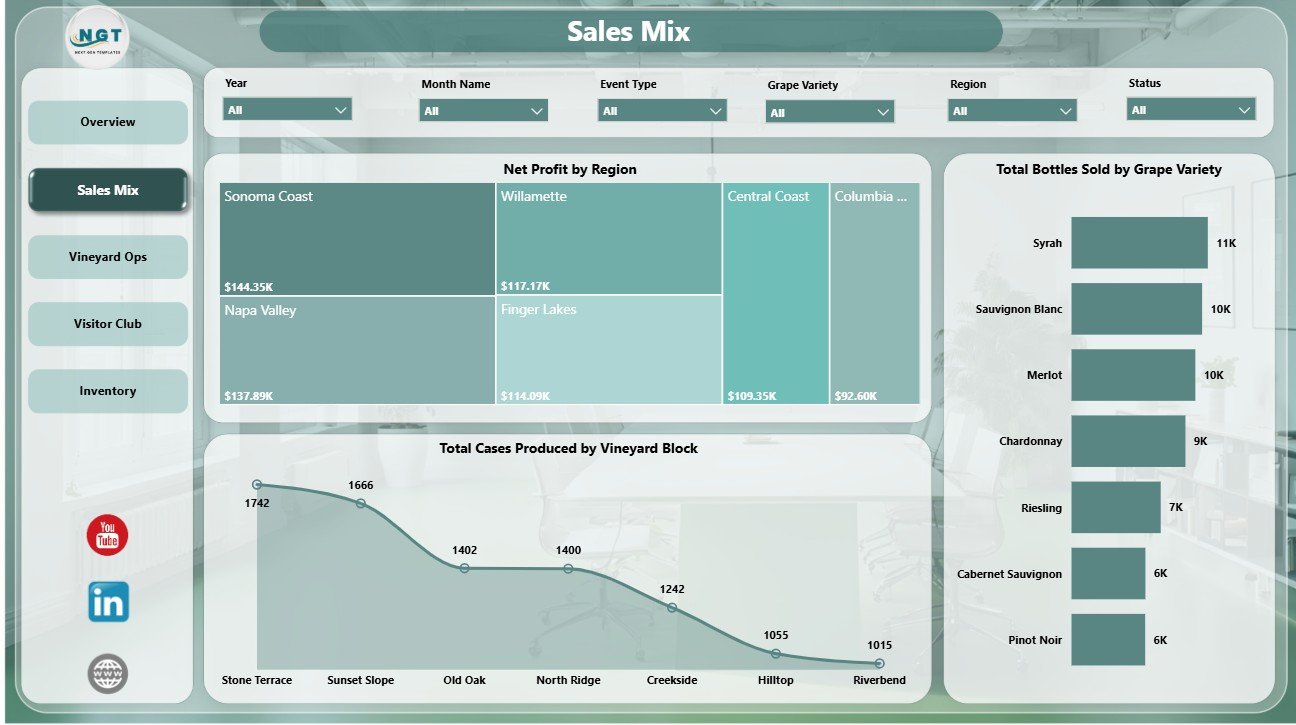
Sales Mix
3 — Vineyard Ops
The Vineyard Ops page connects quality, grape variety revenue, and quarterly financial movement. It is useful for teams that want to review vineyard performance, product mix, and financial trends together instead of treating operations and sales as separate conversations.
Average Quality Score by Region
This chart compares quality score by region. It helps users identify regions with stronger production outcomes and regions that may require viticulture, sourcing, or process review.
Total Revenue by Grape Variety
This chart shows revenue contribution by grape variety. It helps compare which varieties create the most commercial value, not just the most bottle movement.
Total Revenue and Total Cost by Quarter
This chart compares quarterly revenue and cost. It is helpful for understanding seasonal performance around harvest, tasting room demand, events, and sales campaigns.
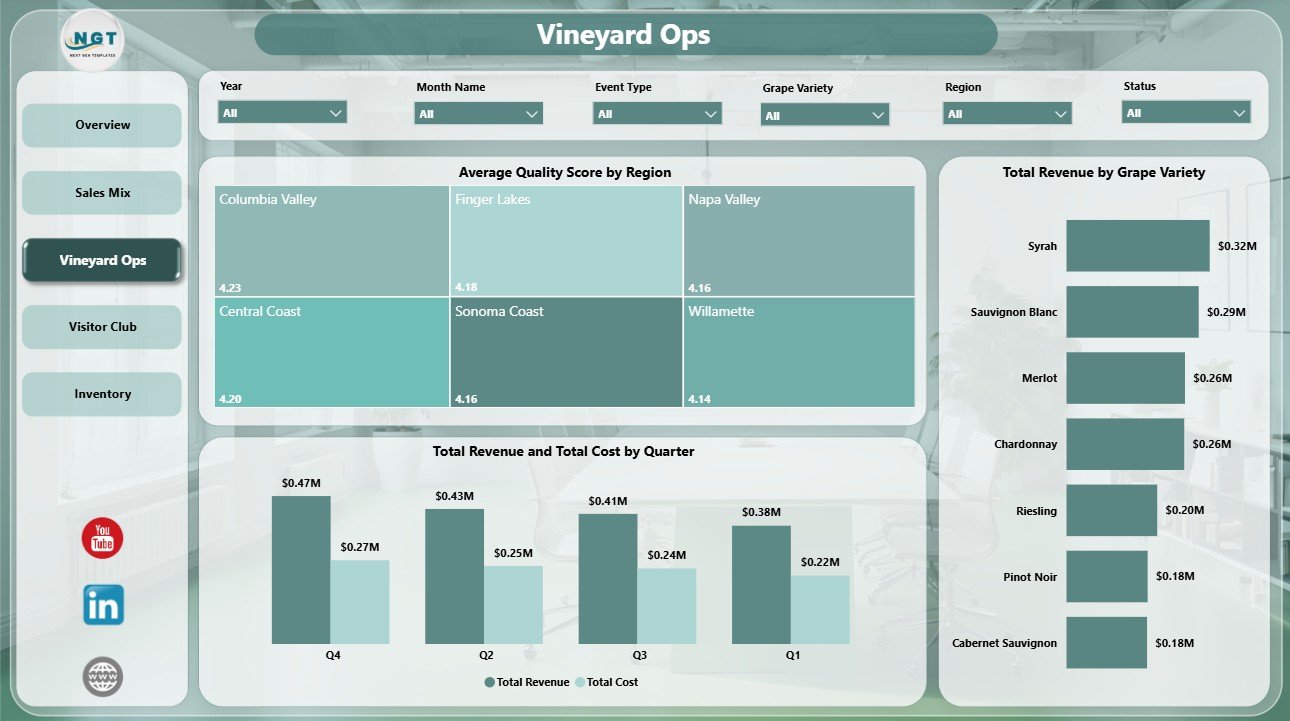
Vineyard Ops
4 — Visitor Club
The Visitor Club page focuses on customer segments, wine club growth, and event cost. It is built for tasting room managers, wine club coordinators, and marketing teams who need to understand how customer activity converts into orders and signups.
Total Orders by Customer Segment
This chart compares order volume by customer segment. It helps teams see whether club members, tasting room visitors, wholesale customers, online buyers, or event customers are driving order count.
Wine Club Signups by Month Name
This chart tracks signups month by month. It helps review whether tasting room campaigns, event calendars, seasonal traffic, and membership promotions are converting visitors into recurring customers.
Total Cost by Event Type
This chart shows cost by event type. It helps teams compare the spend behind tastings, tours, private events, club events, and seasonal campaigns so event profitability can be reviewed more clearly.
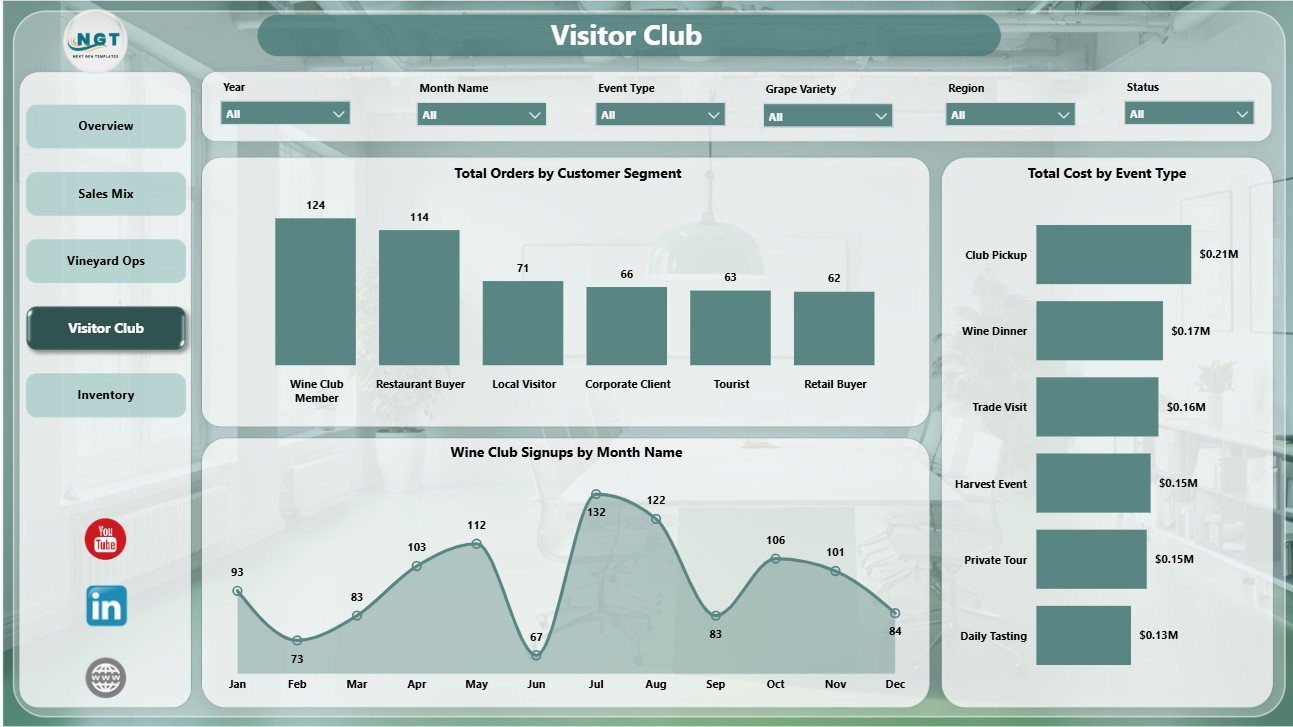
Visitor Club
5 — Inventory
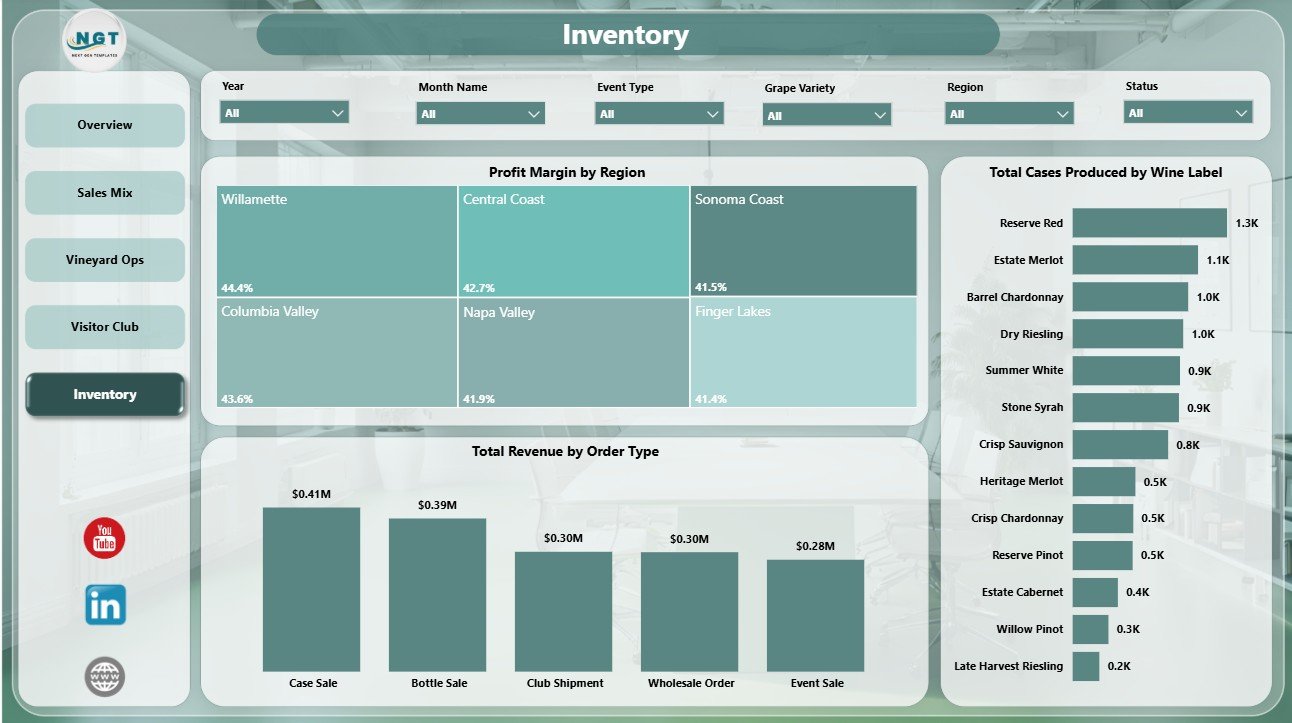
The Inventory page helps users review regional margin, wine label production, and revenue by order type. It is practical for inventory meetings, fulfillment planning, label-level production reviews, and regional sales discussions.
Profit Margin by Region
This chart compares profitability across regions. It helps identify markets where freight, discounts, distributor terms, or pricing may be affecting margin.
Total Cases Produced by Wine Label
This chart shows production volume by wine label. It helps owners and cellar teams compare label-level output and spot labels that may need inventory attention.
Total Revenue by Order Type
This chart compares revenue across order types. It helps evaluate whether club orders, tasting room orders, online orders, wholesale orders, or event orders are contributing most to sales.
Inventory
Craft Winery and Vineyard Dashboard in Power BI vs. Tableau vs. Paid CRM/SaaS – Feature Comparison
| Feature | This Power BI Dashboard | Tableau or Qlik Alternative | Paid Winery SaaS |
|---|---|---|---|
| Cost | $17.99 one-time sale price | BI license plus analyst build time | Monthly or annual subscription |
| Platform | Power BI Desktop and optional Power BI Service | BI desktop or cloud platform | Vendor cloud platform |
| Setup time | Open PBIX, replace or connect data, refresh | Build model, measures, and visuals manually | Onboarding and integration setup |
| Real-time team collaboration | Available after publishing to Power BI Service | Available by plan | Usually included by plan |
| Mobile access | Available through Power BI mobile after publishing | Available through vendor app | Usually included |
| Customizable fields | Edit model, visuals, pages, slicers, and source connections | Editable with BI skills | Often limited by vendor settings |
| Share with link | Available through workspace permissions | Available through platform permissions | Usually login controlled |
| Year-1 cost at 5 users | Template cost plus Microsoft licensing choice | License cost plus analyst time | Often hundreds or thousands per year |
| Winery reporting fit | Revenue, cost, orders, net profit, grape variety, vineyard block, wine club, event, region, and inventory views | Must be designed manually | Depends on winery platform reporting module |
Who Should Use This Template
This template is a strong fit for craft winery owners, vineyard managers, winemakers, tasting room managers, wine club coordinators, inventory planners, finance analysts, and consultants who already maintain structured winery data and want a faster Power BI reporting layer.
It is not intended to replace a POS system, wine club billing platform, vineyard sensor system, compliance platform, barcode inventory solution, or full winery ERP. Use it when your goal is management reporting and decision support, especially if your data can be exported into a clean structure for Power BI.
Real-World Use Cases
Maria, tasting room manager: Maria reviews Total Orders by Customer Segment and Wine Club Signups by Month Name before adjusting event calendars, staff scheduling, and membership promotions.
James, vineyard operations lead: James compares Total Cases Produced by Vineyard Block with Average Quality Score by Region before planning harvest discussions and field-level follow-up.
Anika, winery consultant: Anika connects each client export to the Power BI report, refreshes the model, and uses Sales Mix and Inventory pages to explain which grape varieties, regions, and order types need attention.
Advantages of Craft Winery and Vineyard Dashboard in Power BI
- It gives winery teams a ready report structure instead of starting from a blank PBIX file.
- It connects finance, sales, vineyard production, customer segments, wine club, event cost, and inventory analysis in one place.
- It supports interactive review through slicers and page-level filtering.
- It is editable in Power BI Desktop, so analysts can customize the visuals and data model.
- It can be reused for monthly or quarterly reporting once the data source is updated.
Opportunities for Improvement
The dashboard depends on clean source data. Inconsistent region names, grape variety labels, event type values, customer segment names, wine labels, and order type names can create messy slicers or fragmented chart results. It also does not automate winery workflows such as club billing, POS transactions, compliance reporting, lot tracking, or barcode scanning.
For best results, use this dashboard as the reporting layer after exporting or preparing data from your operating systems. Once the source structure is stable, the same PBIX file can support recurring management reviews with much less manual chart building.
Best Practices
- Open the PBIX file in Power BI Desktop before changing any data source.
- Keep source columns consistent with the sample data structure.
- Standardize values for region, sales channel, grape variety, vineyard block, customer segment, event type, wine label, and order type.
- Refresh the report after replacing or connecting the source data.
- Check slicer selections before presenting final numbers.
- Use the Overview Page for executive review, then move into Sales Mix, Vineyard Ops, Visitor Club, and Inventory for explanation.
For official platform guidance, see Microsoft Learn: Get started with Power BI Desktop.
Explore Relevant Templates
- Craft Winery and Vineyard Dashboard in Excel tutorial
- Craft Winery and Vineyard Dashboard in Excel
- Brewery & Winery Dashboard in Power BI
- Winemaking KPI Dashboard in Power BI
- Browse Power BI Dashboard templates
Frequently Asked Questions
What does the Craft Winery and Vineyard Dashboard in Power BI track?
It tracks Total Revenue, Total Orders, Total Cost, Net Profit, Profit Margin, monthly and quarterly revenue versus cost, sales channel margin, grape variety sales, vineyard block production, customer segment orders, wine club signups, event cost, wine label production, and order type revenue.
How many pages are included?
The report includes 5 Power BI pages: Overview Page, Sales Mix, Vineyard Ops, Visitor Club, and Inventory.
Do I need Power BI Desktop?
Yes. Power BI Desktop is required to open and edit the PBIX file. Power BI Service is optional if you want workspace sharing, browser access, or scheduled refresh.
Can I use my own winery data?
Yes. Replace or connect the sample source with your structured winery records, then refresh the report. Consistent category names and date fields will make the dashboard cleaner.
Can I customize the report?
Yes. You can edit report pages, visuals, slicers, fields, measures, colors, and data connections in Power BI Desktop.
Does this replace winery management software?
No. It is a reporting dashboard template. POS transactions, club billing, compliance, lot tracking, automated inventory scanning, and vineyard sensor data require dedicated operational systems.
About the Author
Built by PK – Microsoft Certified Professional with 15+ years of Excel, Google Sheets, and Power BI experience. Founder of NextGenTemplates, reaching 300K+ subscribers across YouTube channels. Every template is hand-built and tested before release.
Conclusion
The Craft Winery and Vineyard Dashboard in Power BI gives winery and vineyard teams a practical way to review revenue, orders, cost, net profit, margin, grape varieties, vineyard blocks, customer segments, wine club signups, event cost, wine labels, and order types in one interactive report. With 5 pages, executive cards, slicers, and editable Power BI visuals, it is built for teams that want faster winery reporting without creating a PBIX file from scratch.
Click here to purchase Craft Winery and Vineyard Dashboard in Power BI
For more tutorials, visit YouTube.com/@PKAnExcelExpert.
Last updated: July 30, 2026