Educational NGOs Dashboard in Excel is built for education-focused nonprofits, NGOs, donor-funded learning programs, regional coordinators, and finance teams that need a clean way to track budgets, fund utilization, student enrollment, completion performance, teachers trained, donations, and regional outcomes. Education NGO reporting often involves scattered files: one spreadsheet for funding, another for beneficiaries, another for program status, and separate notes for donor reporting. This dashboard brings those signals into one Excel workbook with 5 dashboard pages, 4 KPI cards, slicers, a Data sheet, and a pivot-powered Support sheet.
You can get the template from Educational NGOs Dashboard in Excel. For official Excel guidance on pivot tables and dashboards, see Microsoft Support – Create a PivotTable.
Key Features of Educational NGOs Dashboard in Excel
- 5 dashboard pages: Overview, Funding Analysis, Student Outcomes, Program Analysis, and Regional Insights.
- 4 executive KPI cards: Total Budget, Total Funds Utilized, Total Students Enrolled, and Total Programs.
- Funding views: Compare budgets, utilization, donations, program types, funding sources, and utilization percentages.
- Student outcomes: Track enrollments, completions, beneficiary groups, completion percentages, and regional student outcomes.
- Program analysis: Review program status, completed programs, teachers trained, program type, and monthly completion percentages.
- Regional reporting: Compare budget, donations, average satisfaction, and teacher training by region.
- Pivot-driven refresh: Update the Data sheet, click Refresh All, and refresh dashboard visuals together.
- No macros required: The workbook uses native Excel functionality including pivot tables, charts, slicers, and formulas.
Dashboard Pages Explanation
1. Overview Page
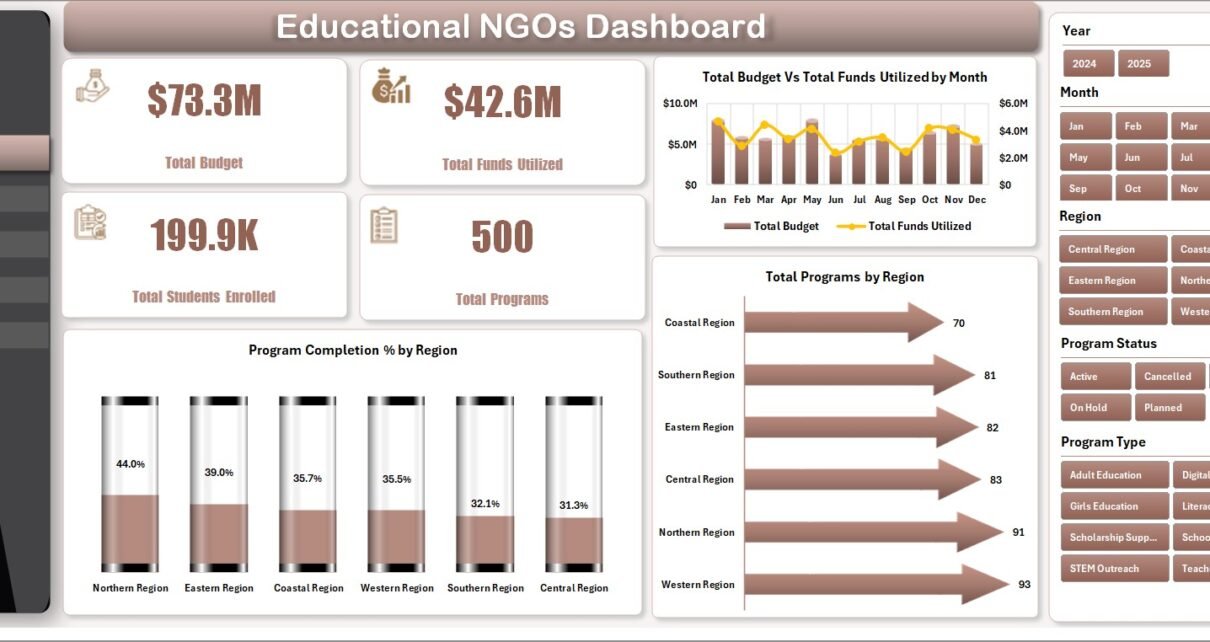
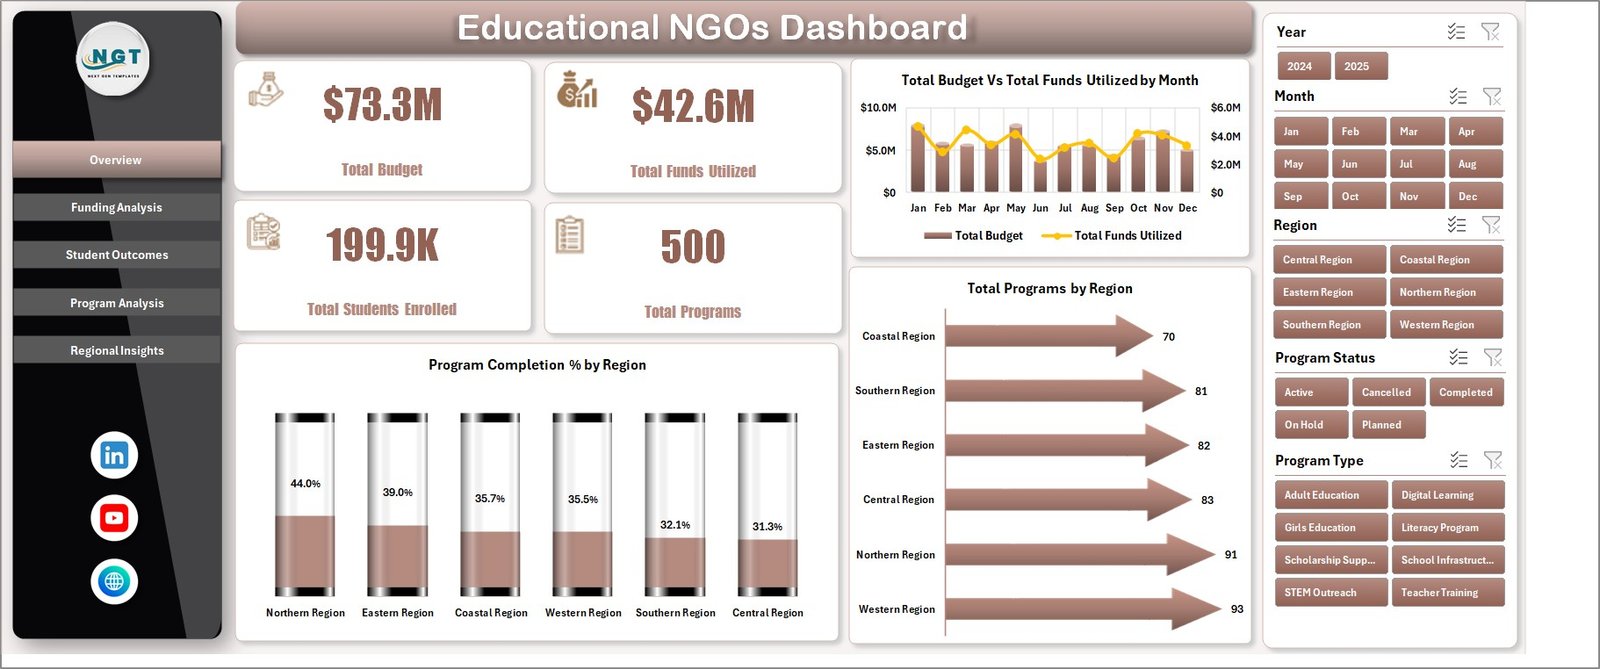
The Overview Page gives a high-level summary of the educational NGO program portfolio. The top cards show Total Budget, Total Funds Utilized, Total Students Enrolled, and Total Programs, giving leadership an instant view of scale, funding movement, student reach, and program activity.
Total Budget and Total Funds Utilized by Month: This chart compares planned budget with actual utilization across months. It helps teams spot underused funds, spending spikes, or months where donor funding needs closer attention.
Program Completion % by Region: This chart compares completion performance across regions. It helps managers identify where program delivery is strong and where regional teams may need additional support.
Total Programs by Region: This chart shows the distribution of programs by region. It is useful for understanding coverage, workload concentration, and geographic balance.
2. Funding Analysis
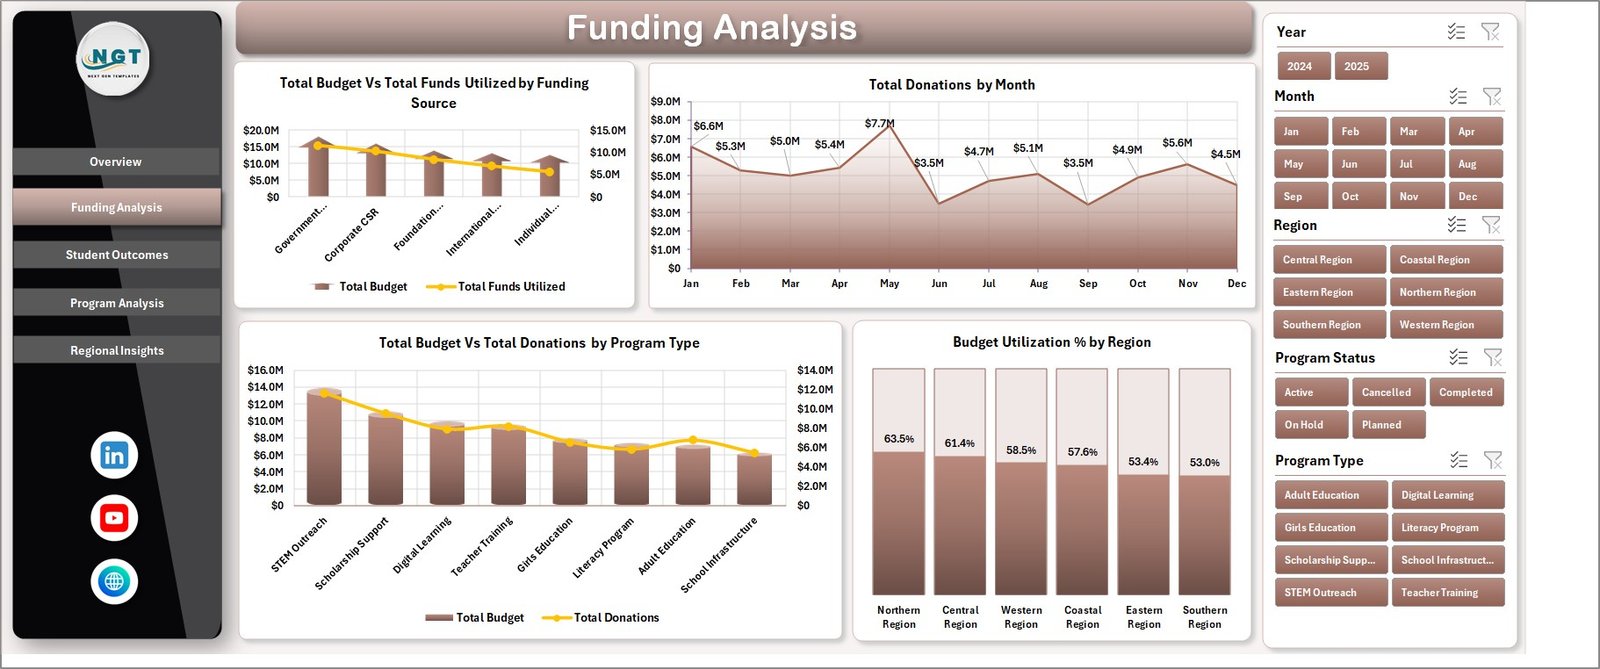
The Funding Analysis page focuses on how budgets, utilization, donations, funding sources, and regions connect. Total Budget and Total Funds Utilized by Funding Source helps users compare funding commitments with actual spending by donor or source. Total Donations by Month shows donation movement over time and can help teams understand seasonality or campaign impact.
Total Budget and Total Donations by Program Type compares funding across program categories, making it easier to see which program types attract stronger support. Budget Utilization % by Region gives a regional efficiency view, helping leadership find areas where funds are being used on schedule or where utilization is lagging.
3. Student Outcomes
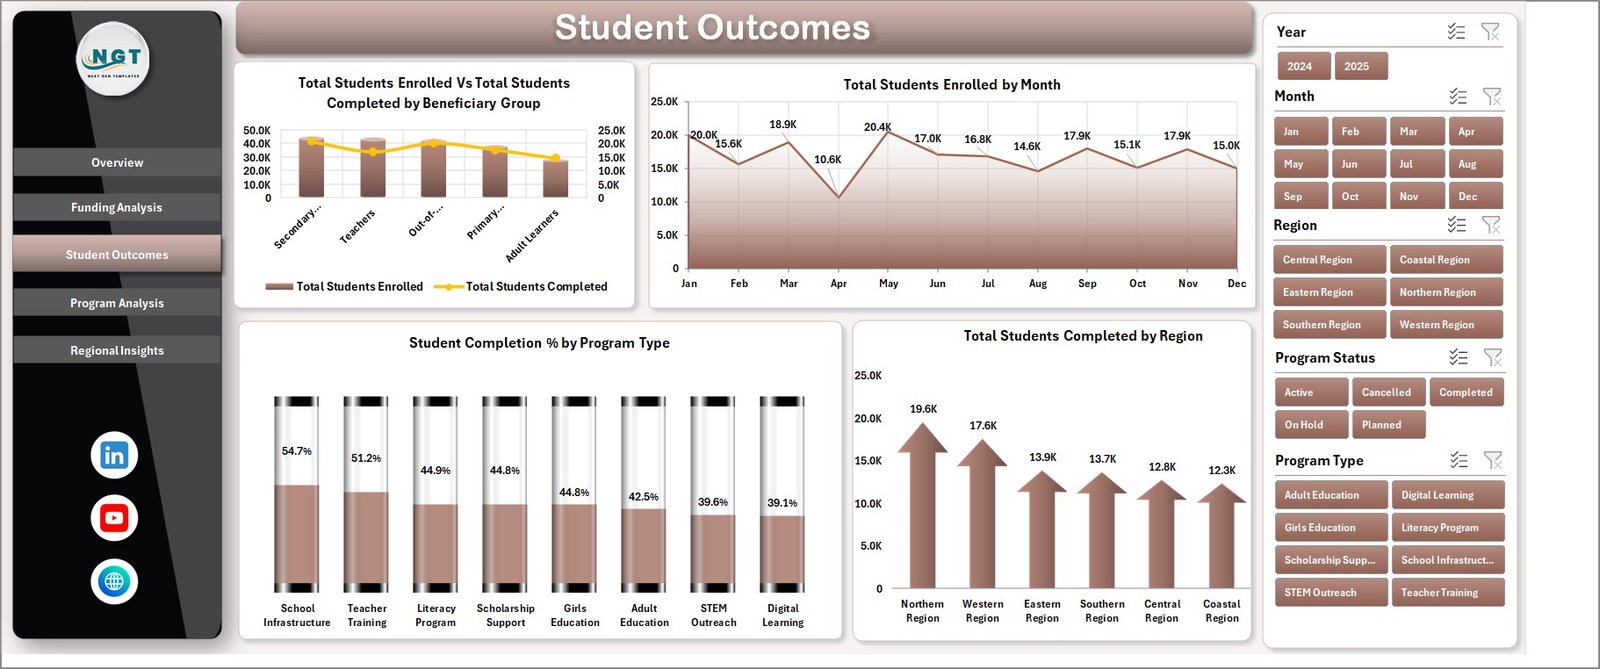
The Student Outcomes page connects program activity with learner results. Total Students Enrolled and Total Students Completed by Beneficiary Group helps NGOs understand which beneficiary groups are entering and completing programs. Total Students Enrolled by Month shows enrollment movement across time, useful for monthly reviews and donor reporting.
Student Completion % by Program Type compares completion rates across education interventions, while Total Students Completed by Region highlights where completed student outcomes are strongest. Together, these visuals support evidence-based conversations about reach and impact.
4. Program Analysis
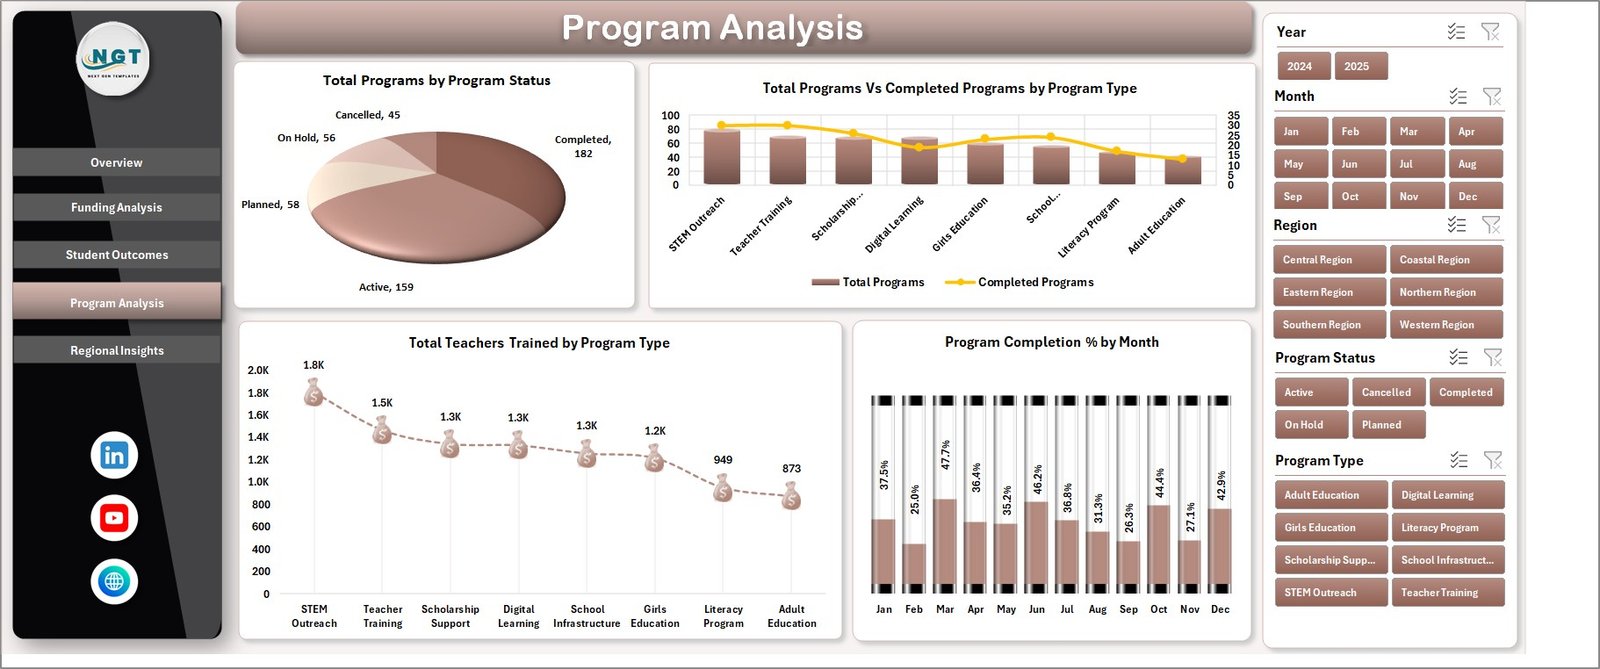
The Program Analysis page helps teams review program delivery and operational status. Total Programs by Program Status shows active, completed, pending, delayed, or other program statuses in one visual. This makes it easier to prepare operational updates for leadership.
Total Programs and Completed Programs by Program Type compares program volume against completion output. Total Teachers Trained by Program Type tracks capacity-building work, while Program Completion % by Month helps teams monitor delivery momentum over time.
5. Regional Insights
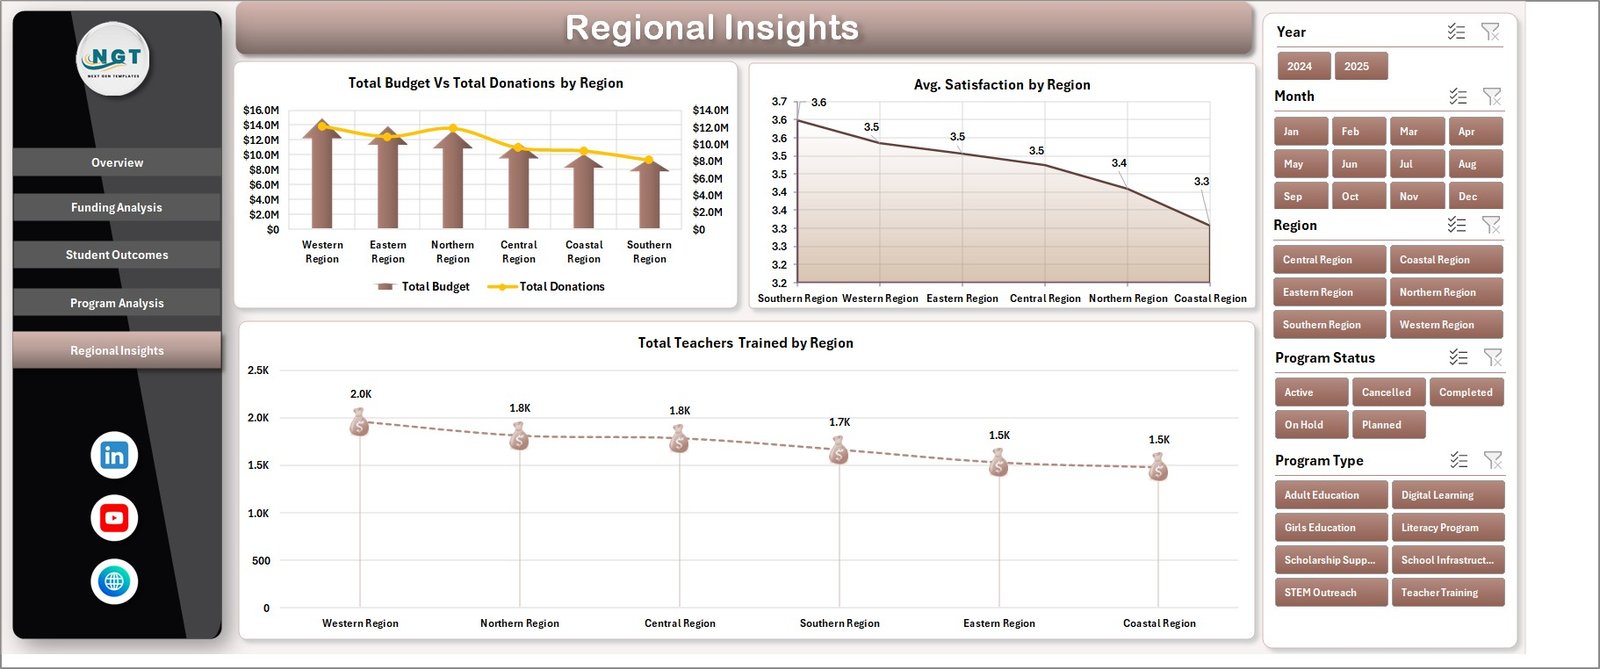
The Regional Insights page is designed for comparing regional performance. Total Budget and Total Donations by Region helps users compare planned funding and donation support geographically. This is helpful for board discussions and donor coverage analysis.
Avg. Satisfaction by Region gives a quality signal beyond raw counts, while Total Teachers Trained by Region shows where teacher capacity is being developed. These visuals help connect funding, satisfaction, and delivery support by location.
6. Data Sheet Tab
The Data Sheet is where users add or replace the source records. Keep the same column headers and structure so the pivot tables summarize correctly. Once the data is updated, the workbook can refresh the cards, charts, and slicers from the latest information.

7. Support Sheet
The Support Sheet contains the pivot tables that power the dashboard. After updating the Data sheet, go to the Data tab in the Excel Ribbon and click Refresh All. All pivot tables and charts will refresh together. You can keep this sheet hidden during regular use to protect the dashboard logic.

Educational NGOs Dashboard in Excel vs. Google Sheets vs. Paid CRM/SaaS – Feature Comparison
| Feature | Educational NGOs Dashboard in Excel | Google Sheets Alternative | Paid NGO CRM/SaaS |
|---|---|---|---|
| Cost | $17.99 one-time | Free or workspace cost, but must be built | Recurring subscription |
| Platform | Microsoft Excel | Google Sheets | Vendor-hosted cloud app |
| Setup time | Open workbook, replace data, refresh | Build formulas and charts manually | Requires onboarding |
| Real-time team collaboration | Available through OneDrive or SharePoint | Native collaboration | Usually included |
| Mobile access | Available through Excel mobile with limits | Available through Sheets app | Usually included |
| Customizable fields | Fully editable workbook | Fully editable sheet | Limited by vendor settings |
| Share with link | Possible through OneDrive or SharePoint | Native link sharing | Usually account based |
| Year-1 cost at 5 users | $17.99 plus any Microsoft licensing | Workspace cost plus build time | Often hundreds or thousands |
| Education NGO analytics | Pre-built across 5 pages | Must be designed | Depends on module or plan |
Who Should Use This Template
This template is useful for educational NGOs, nonprofit education teams, literacy programs, scholarship support teams, community learning centers, international education nonprofits, regional program coordinators, and donor reporting analysts who already keep structured program records in Excel or CSV format.
It is not designed to replace a donor CRM, applicant portal, accounting platform, learning management system, case management tool, or grant workflow system. It works best as a reporting dashboard after your operational data has already been collected.
Real-World Use Cases
Amina, NGO director: Amina reviews the Overview and Regional Insights pages before monthly board meetings to explain budget utilization, student enrollment, program counts, satisfaction, and teachers trained by region.
Ravi, field program manager: Ravi uses Program Analysis and Student Outcomes to identify which program types are completing successfully and which beneficiary groups need follow-up support.
Sofia, donor reporting analyst: Sofia uses Funding Analysis to prepare grant updates showing total budget, utilization, donations, funding source performance, and regional budget utilization percentages.
Advantages of Educational NGOs Dashboard in Excel
- Faster reporting: Start from a ready Excel dashboard instead of building multiple pages manually.
- Focused NGO education metrics: Budget, funds utilized, students, programs, teachers, donations, and satisfaction are all included.
- Easy refresh process: Update the Data sheet and use Refresh All to update the dashboard.
- Flexible workbook: Users can edit charts, fields, colors, labels, and formulas if needed.
- One-time purchase: Useful for teams that need reporting without an ongoing analytics subscription.
Opportunities for Improvement
As with any Excel dashboard, data quality matters. Users should keep region names, funding source names, beneficiary groups, dates, and program types consistent. Larger teams may want to connect the workbook to Power Query, SharePoint, or a central database later. Organizations that need multi-user approvals, donor communication automation, or individual student case management may need a dedicated CRM or learning management system alongside this dashboard.
Best Practices
- Keep one row per program, student outcome, or reporting record based on the workbook’s sample format.
- Use consistent names for regions, program types, beneficiary groups, and funding sources.
- Refresh all pivots after every data update.
- Protect or hide the Support Sheet after setup to avoid accidental pivot edits.
- Review budget utilization together with completion metrics, not separately.
- Use slicers for donor-specific or region-specific presentations.
Explore Relevant Templates
You can purchase the Educational NGOs Dashboard in Excel from NextGenTemplates. You may also want to review Adult Literacy Programs Dashboard in Excel, International Development Report in Excel, Nonprofit Grant Dashboard in Power BI, and Excel Dashboard Templates.
Frequently Asked Questions
What is the Educational NGOs Dashboard in Excel?
It is an Excel dashboard template for tracking education NGO budgets, funds utilized, student enrollment, student completions, program status, teachers trained, donations, satisfaction, and regional performance.
What KPI cards are included on the Overview page?
The Overview page includes Total Budget, Total Funds Utilized, Total Students Enrolled, and Total Programs.
Can I add my own data?
Yes. Replace the sample rows in the Data Sheet with your own records, keep the same format, and refresh the workbook.
Does the dashboard require macros?
No. The dashboard uses native Excel features such as pivot tables, charts, slicers, formulas, and structured data.
Can I customize charts and fields?
Yes. You can edit visuals, labels, formulas, slicers, colors, and pivot fields if you are comfortable with Excel dashboard editing.
Can I hide the Support Sheet?
Yes. The Support Sheet contains pivot tables that power the dashboard and can be hidden after setup.
About the Author
Built by PK – Microsoft Certified Professional with 15+ years of Excel, Google Sheets, and Power BI experience. Founder of NextGenTemplates, reaching 300K+ subscribers across YouTube channels. Every template is hand-built and tested before release.
Conclusion
The Educational NGOs Dashboard in Excel gives nonprofit education teams a practical way to review budget, funding utilization, student enrollment, program completion, teacher training, donations, satisfaction, and regional performance from one workbook. It is a useful starting point for teams that need fast Excel reporting before investing in a larger custom system.
Visit our YouTube channel for step-by-step Excel and Power BI tutorials: Youtube.com/@PKAnExcelExpert.
Click here to purchase Educational NGOs Dashboard in Excel