The Music School Dashboard in Excel tracks 5 KPIs and 20 interactive charts across 5 dashboard pages, all driven by pivot tables that auto-refresh when you update the Data sheet. Built for music academies, conservatories, and private studios that need real analytics without paying $19–$59 per month for cloud SaaS, this template ships as a one-time $17.99 purchase with instant download and lifetime access.
Running a music school means juggling instructors, instruments, branches, course levels, fee collection, and student progression — usually across spreadsheets that never quite tie out. The Music School Dashboard in Excel consolidates all of it onto five filterable pages so an academy director can answer any reporting question in under 30 seconds. Replace the sample student records with your own, click Refresh All, and every chart, KPI, and slicer recalculates instantly.
Key Features of Music School Dashboard in Excel
This Music School Dashboard packs five fully built analytical pages plus a Data sheet and a hidden Support sheet that powers every visual through native Excel pivot tables. Here’s what makes it different from the typical free template:
- 5 Analytical Pages — Overview, Instrument Analysis, Instructor Performance, Branch Analysis, and Enrollment Trends. Each page is filterable through slicers placed at the top.
- 5 KPI Cards on the Overview — Total Fee Collected, Total Records, Avg. Performance Score, Total Active, and Avg. Practice Hours.
- 20 Pre-Built Charts — Four charts per analytical page, all driven by pivots, all filterable by the same slicer panel.
- Fee Collected vs. Fee Due Tracking — Compare paid versus outstanding dues by Branch, Course Level, and Year.
- Performance Score & Practice Hours Analytics — By Instrument, Instructor, and Branch — leading indicators of student progression.
- Pivot-Driven Architecture — Click Refresh All on the Data ribbon and the entire dashboard rebuilds in 2–3 seconds.
- No Macros, No VBA — Runs safely in any corporate or personal Excel environment, including Excel for Mac.
Dashboard Pages Explanation
1. Overview Page
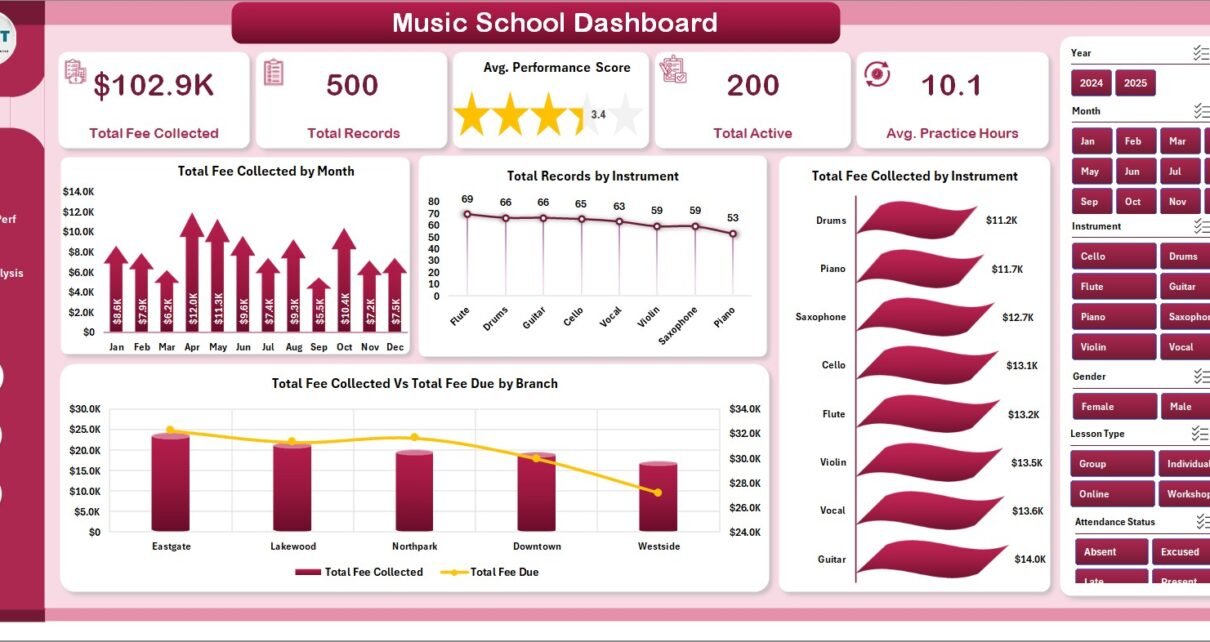
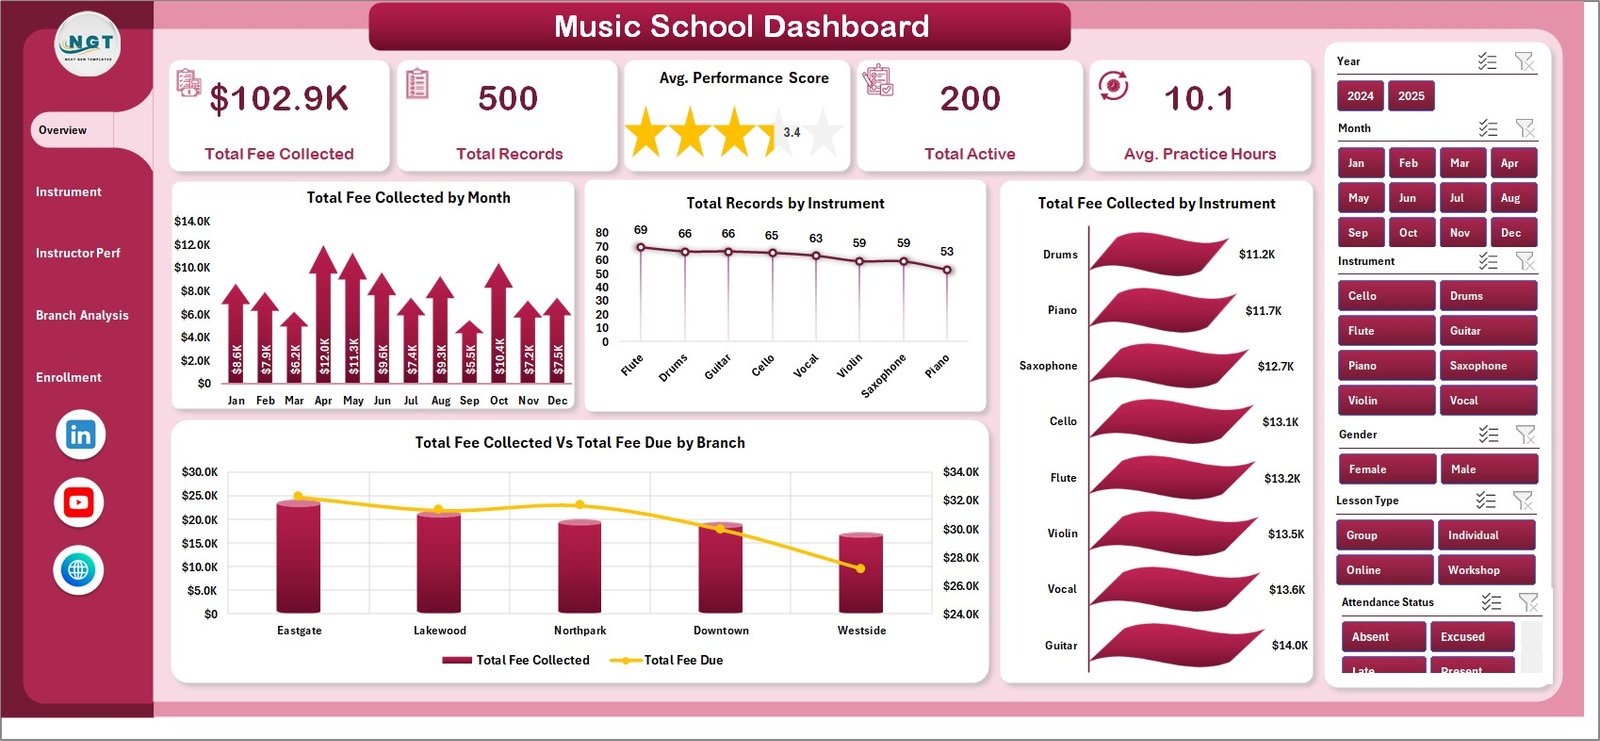
The Overview page gives owners and branch managers a single-screen snapshot of the entire academy. Five KPI cards anchor the top, and four charts surface fee trends, instrument popularity, and branch fee-collection health.
KPI cards: Total Fee Collected · Total Records · Avg. Performance Score · Total Active · Avg. Practice Hours
Charts on this page:
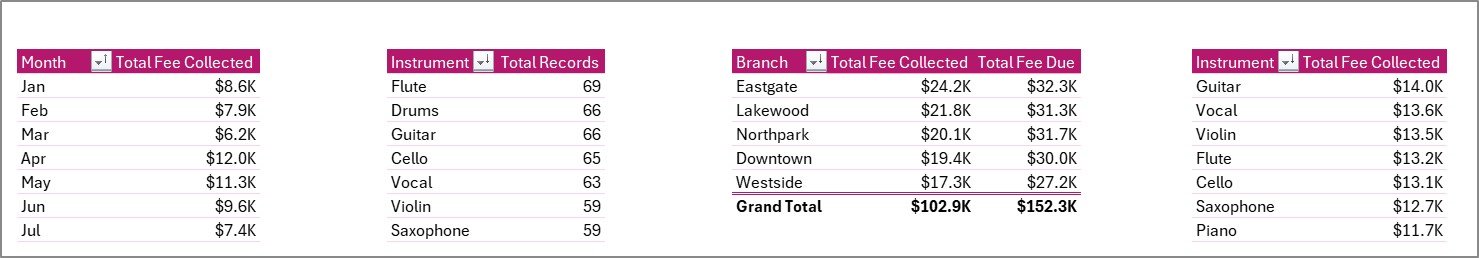
- Total Fee Collected by Month — exposes seasonality and the impact of enrollment drives.
- Total Records by Instrument — shows where demand is concentrated across guitar, piano, violin, drums, and others.
- Total Fee Collected by Instrument — reveals which programs generate the most revenue.
- Total Fee Collected Vs Total Fee Due by Branch — flags branches with collection gaps.
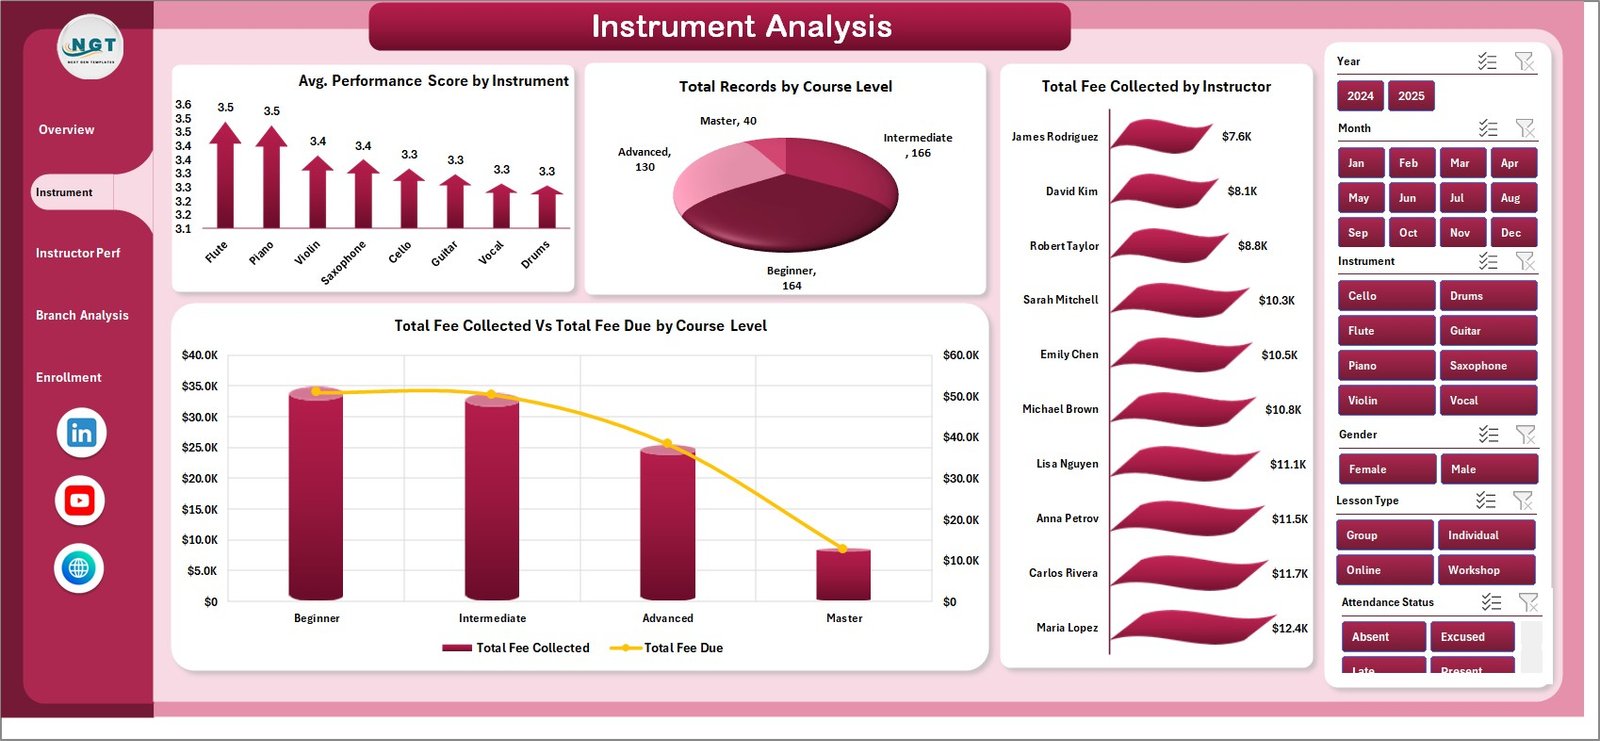
2. Instrument Analysis
This page helps you understand which instruments and course levels drive the academy and where fee-due gaps emerge.
- Avg. Performance Score by Instrument — ranks instruments by student outcomes.
- Total Records by Course Level — splits enrollment across Beginner, Intermediate, and Advanced.
- Total Fee Collected by Instructor — guides bonus and retention conversations.
- Total Fee Collected Vs Total Fee Due by Course Level — highlights levels where dues are slipping.
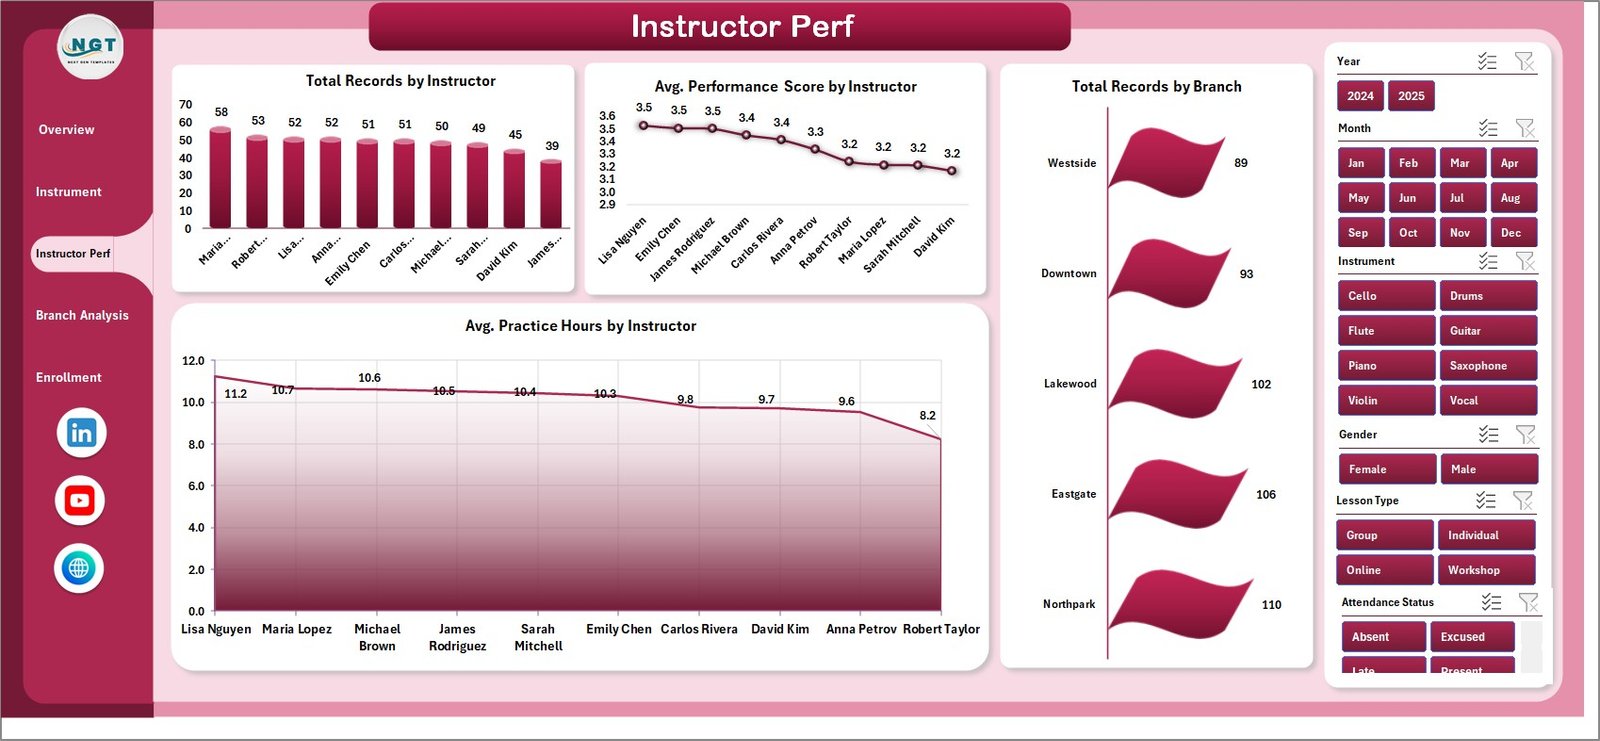
3. Instructor Performance
A manager-focused page for monthly 1:1s, quarterly bonus decisions, and retention conversations with high-rated instructors.
- Total Records by Instructor — ranks instructors by student volume.
- Avg. Performance Score by Instructor — surfaces who lifts student outcomes the most.
- Total Records by Branch — branch-level enrollment view for capacity planning.
- Avg. Practice Hours by Instructor — leading indicator of progression.
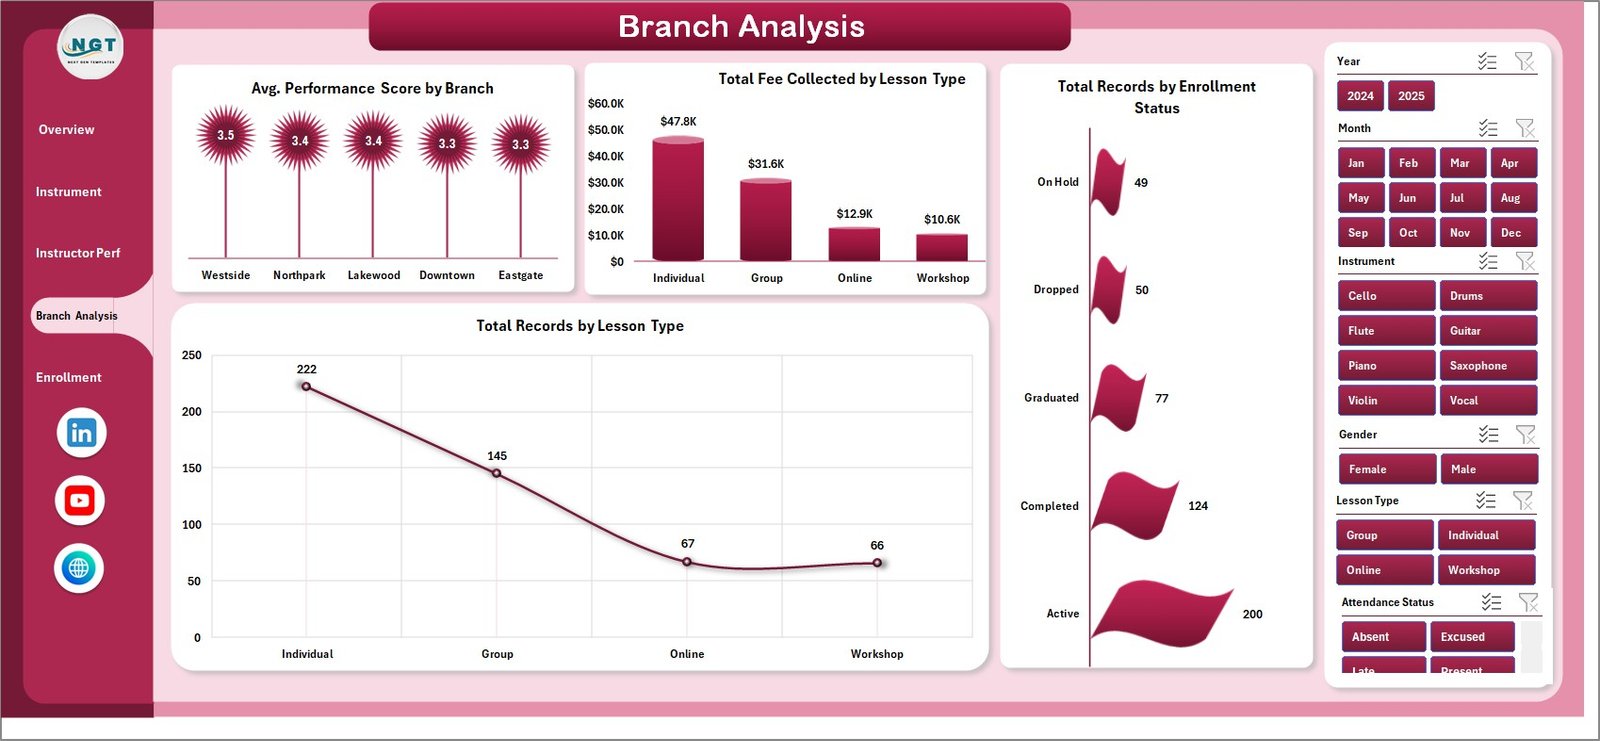
4. Branch Analysis
Built for multi-location music academies, this page exposes branch-level performance, lesson-type revenue mix, and active-student counts.
- Avg. Performance Score by Branch — flags locations needing curriculum support.
- Total Fee Collected by Lesson Type — splits revenue across Private, Group, and Online lessons.
- Total Records by Enrollment Status — Active, Inactive, Trial, and Dropped.
- Total Records by Lesson Type — volume mix across lesson formats.
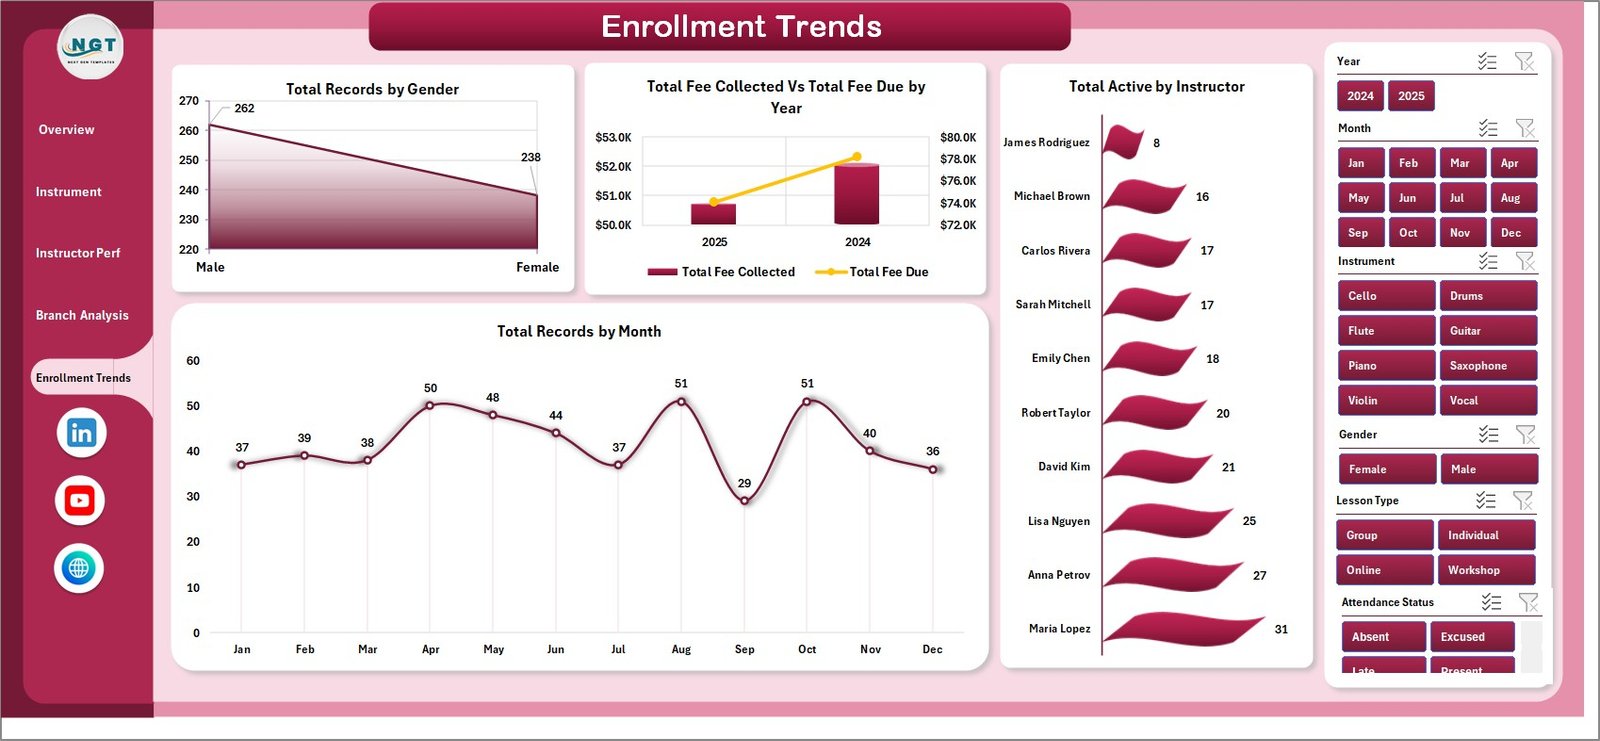
5. Enrollment Trends
Designed for owners and marketing leads planning hiring, capacity, and outreach campaigns.
- Total Records by Gender — supports marketing-targeting decisions.
- Total Fee Collected Vs Total Fee Due by Year — year-over-year fee health view.
- Total Active by Instructor — current active-student load per instructor.
- Total Records by Month — month-over-month enrollment trend for forecasting.
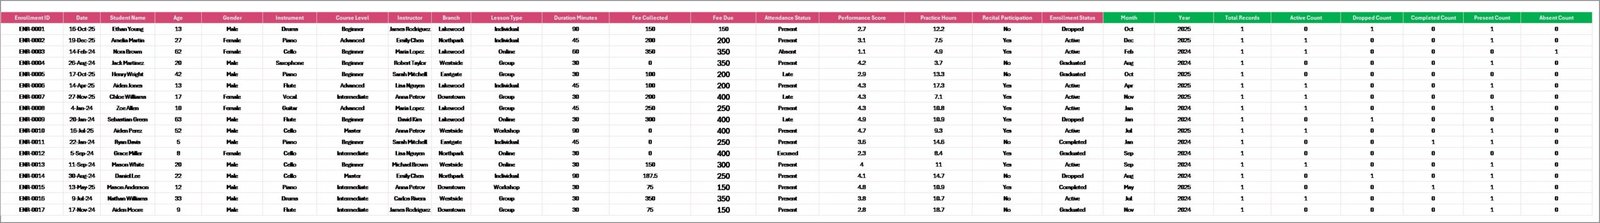
6. Data Sheet
This is where you enter your student records. Each row is one enrollment with fields for Date, Student Name, Gender, Branch, Instrument, Course Level, Lesson Type, Instructor, Enrollment Status, Practice Hours, Performance Score, Fee Due, and Fee Collected. Replace the sample data with your own in the same column order, and every chart updates after a single Refresh All.
7. Support Sheet
A hidden sheet containing all the pivot tables that power the dashboard. After updating the Data sheet, click Refresh All on the Excel Data ribbon — every pivot and chart recalculates automatically. Keep this sheet hidden in daily use. For background on how pivot tables work and why they’re the right backbone for this kind of dashboard, see the official Microsoft pivot table documentation.
Music School Dashboard Excel vs. Google Sheets vs. Paid Music-School SaaS — Feature Comparison
| Feature | Music School Dashboard (Excel) | Google Sheets Alternatives | MyMusicStaff / Fons / Music Teacher’s Helper |
|---|---|---|---|
| Cost | $17.99 one-time | Mostly free, limited features | $19–$59 / month + per-teacher fees |
| Setup time | Under 10 minutes | 30–60 minutes | 3–7 days onboarding |
| Works offline | ✅ Yes — local Excel file | ❌ No, needs internet | ❌ No, cloud-only |
| Fee collected vs. fee due tracking | ✅ By branch, course level, year | Manual formulas | Yes, vendor-locked |
| Performance score analytics | ✅ By instrument, instructor, branch | Must build manually | Limited or add-on |
| Data ownership | ✅ 100% yours, local file | Stored in your Drive | Vendor-owned cloud database |
| Customizable | ✅ Edit any pivot, chart, KPI | Yes | Limited to vendor options |
| 3-year cost (10 instructors) | $17.99 | $0 | $684–$2,124 |
For music academies and private studios that want full analytics control without paying $19–$59 every month, the Music School Dashboard in Excel sits in the sweet spot.
Who Should Use This Template
Perfect for:
- Music school owners managing 5–50 instructors and 50–500 active students across 1–5 branches
- Independent music instructors who want a professional dashboard to share with parents or studio partners
- Music academy directors tracking multi-instrument, multi-branch revenue and instructor performance
- Conservatories and performing-arts schools running monthly business reviews
- Private music studios migrating from notebooks or basic spreadsheets to real analytics
Not a fit if:
- You need integrated lesson-scheduling with calendar sync, automated reminders, and student-portal logins
- You need a mobile app for instructors to mark attendance in real time
- You need automatic Stripe / payment-gateway billing — this is a reporting template, not a billing engine
Real-World Use Cases
Anika runs a 14-instructor music academy in Pune teaching guitar, piano, violin, and drums. She uses the Music School Dashboard in Excel to review monthly fee collection by instrument, identify her highest-rated instructors for retention bonuses, and present quarterly numbers to her co-founder. She replaced a $39/month MyMusicStaff subscription with this one-time $17.99 file and now keeps every record on her own laptop.
James is an independent piano teacher in the US with 25 active students across two suburbs. He uses the dashboard to track monthly fee inflow, monitor his average performance score by student, and prove progression to parents asking for additional lessons. The Excel file replaces a $19/month Fons subscription, and he can hand a parent a one-page PDF export anytime.
Priya directs operations at a 4-branch performing-arts academy in Mumbai. She filters the Music School Dashboard by branch, compares average practice hours and performance scores across locations, and surfaces fee-due gaps to her finance lead — all inside one Excel file, no cloud login required, no per-instructor charge.
Advantages of Music School Dashboard in Excel
- Massive cost savings: $17.99 once vs. $684–$2,124 over three years on cloud SaaS — and the savings compound as you add instructors.
- Real data ownership: Your student records live in a local file, not a vendor’s cloud. No risk of price hikes or platform shutdown costing you years of records.
- Fast decision-making: Slicers let you isolate one instructor, one branch, or one course level in two clicks — useful before parent calls or board meetings.
- Customizable end-to-end: Add a new column to the Data sheet, a new pivot field, a new chart — all native Excel, no developer needed.
- Works without internet: Runs offline on Excel for Windows, Mac, or Microsoft 365 — useful in branches with patchy connectivity.
Opportunities for Improvement
- No automated lesson scheduling: If you need calendar sync and automated parent reminders, pair this dashboard with a separate scheduling tool like Google Calendar.
- No payment processing: The dashboard tracks fee collection but doesn’t process payments — invoicing happens elsewhere.
- Single-user editing by default: Multi-user co-authoring requires hosting the file on OneDrive or SharePoint with Microsoft 365 — fine, but a step beyond a local file.
- Performance score is manual input: The dashboard reports it; instructors still need to enter the scores after each evaluation cycle.
Best Practices
- Fix the Data sheet column order. Don’t rename or reorder columns — the pivots reference them by position.
- Use one row per enrollment record, not per student. A single student taking two instruments is two rows. This keeps fee and performance metrics accurate.
- Refresh All after every Data sheet update. Every chart and KPI is a pivot — they don’t auto-refresh until you click the button.
- Save a clean master copy. Keep an untouched template file separately so you always have a recovery point.
- Export monthly snapshots as PDF. File → Export → Create PDF gives you an archive trail for board meetings or franchise reviews.
- Use slicers in combination. Filter by Branch + Instructor + Year together to isolate exactly the slice you want before screenshotting.
Explore Relevant Templates
- Tutoring Business Dashboard in Excel — adjacent education vertical with the same pivot-driven architecture.
- Driving School Dashboard in Excel — same school-management pattern for driving academies.
- Language Schools Dashboard in Excel — multi-instructor multi-branch sibling for language academies.
- Teacher Training Institutes KPI Dashboard in Excel — MTD/YTD KPI variant for training institutions.
- Browse the full Excel Dashboard Templates category for more pivot-driven business dashboards.
Frequently Asked Questions
What does the Music School Dashboard in Excel track?
The Music School Dashboard in Excel tracks 5 core KPIs (Total Fee Collected, Total Records, Avg. Performance Score, Total Active, Avg. Practice Hours) and 20 pre-built charts across 5 pages — Overview, Instrument Analysis, Instructor Performance, Branch Analysis, and Enrollment Trends. Every metric recalculates automatically when you update the Data sheet and click Refresh All.
How does the Music School Dashboard compare to MyMusicStaff or Fons?
MyMusicStaff and Fons charge $19–$59 per month plus per-teacher fees and lock your data in their cloud. The Music School Dashboard in Excel is a one-time $17.99 purchase, works fully offline, and gives you 100% data ownership. You trade automated scheduling and parent portals for ownership, flexibility, and large cost savings over 3+ years.
How long does setup take?
Setup takes under 10 minutes for most music academies. Open the file, replace the sample student records in the Data sheet with your own following the same column format, click Refresh All on the Data ribbon, and every chart and KPI on the 5 dashboard pages updates automatically. No formula edits or chart rebuilds required.
Can I add my own instruments, instructors, or branches?
Yes. The Music School Dashboard in Excel uses pivot tables sourced directly from the Data sheet, so any new instrument, instructor name, branch, or course level you enter is picked up automatically after clicking Refresh All. You can scale from a single-branch private studio to a 5-branch multi-instrument academy without touching the dashboard structure.
Do I need macros or VBA enabled?
No. The Music School Dashboard in Excel is a pivot-table-driven workbook with no macros or VBA. It runs safely in any corporate or personal Excel environment where macros are blocked, and it’s fully compatible with Excel 2016, 2019, 2021, Microsoft 365, and Excel for Mac.
Can multiple branches edit the same Music School Dashboard file?
Yes, if you save the file to OneDrive or SharePoint and open it in Excel for the web or Microsoft 365 desktop with co-authoring enabled. For local-only use, one person updates the Data sheet at a time, clicks Refresh All, and shares the refreshed file with the rest of the team.
Is this Music School Dashboard a one-time purchase?
Yes — the Music School Dashboard in Excel is a one-time $17.99 purchase with instant download. There is no subscription, no per-student fee, and no renewal charge. You can use the template on unlimited devices within your business and keep using it as long as you have Microsoft Excel installed.
About the Author
Built by PK — Microsoft Certified Professional with 15+ years of Excel, Google Sheets, and Power BI experience. Founder of NextGenTemplates, reaching 300K+ subscribers across YouTube channels. Every template is hand-built and tested before release.
Conclusion
The Music School Dashboard in Excel is built for music academy owners, independent instructors, and multi-branch directors who want real analytics on their fee collection, instructor performance, and enrollment trends — without the recurring cost of cloud SaaS. Five pivot-driven pages, 20 charts, 5 KPIs, slicer-based filtering across the entire workbook, and a one-time $17.99 price tag.
👉 Click here to Purchase the Music School Dashboard in Excel
✅ Instant download · One-time payment · No subscription · Lifetime access
🎥 Visit YouTube.com/@PK-AnExcelExpert for step-by-step Excel video tutorials.
📅 Last updated: April 2026