Plumbing contractors lose 12–18% of annual revenue to unbilled hours, missed AR follow-up, and untracked job-level profitability — and most shops only discover it at year-end when the books are reconciled. The Plumbing Contractor Dashboard in Excel is a $17.99 one-time reporting layer that surfaces these leaks weekly across 5 KPIs, 17 charts, and 5 dashboard pages, with setup under 10 minutes.
If you run a small or mid-sized plumbing business and you’ve been priced out of ServiceTitan ($49–$398/technician/month), this article walks through every page of the dashboard, who it’s built for, and how it stacks up against both Google Sheets equivalents and full field-service SaaS platforms.
Plumbing Contractor Dashboard in Excel — Overview Page
Key Features of the Plumbing Contractor Dashboard in Excel
The Plumbing Contractor Dashboard in Excel is built around a pivot-driven architecture: every chart and KPI on every page reads from a pivot table on a hidden Support Sheet, which itself sources from a single Data Sheet. The result is a dashboard you maintain in 30 seconds a week — paste new job rows, click Refresh All, done.
- 5 headline KPI cards on the Overview page: Total Revenue, Total Payments, Total Records (job count), Average Customer Rating, and Total Hours Worked.
- 17 pivot-driven charts distributed across 5 analysis pages — Overview, Job Analysis, Technician Performance, Financial Tracking, and Client & Marketing.
- Multiple slicers on every page for filtering by technician, service category, location, priority, payment status, or referral source in two clicks.
- Structured Data Sheet with columns for technician, service category, job type, hours, revenue, material cost, payment status, customer rating, location, and referral source — fully editable.
- Hidden Support Sheet houses every pivot table powering the dashboard. Hide it before sharing the file with crew or clients.
- One-click refresh via Excel Ribbon → Data → Refresh All. No macros, no VBA, no Power Query — works in Excel 2016+, Excel 365, and Excel for Mac.
Dashboard Pages Explanation
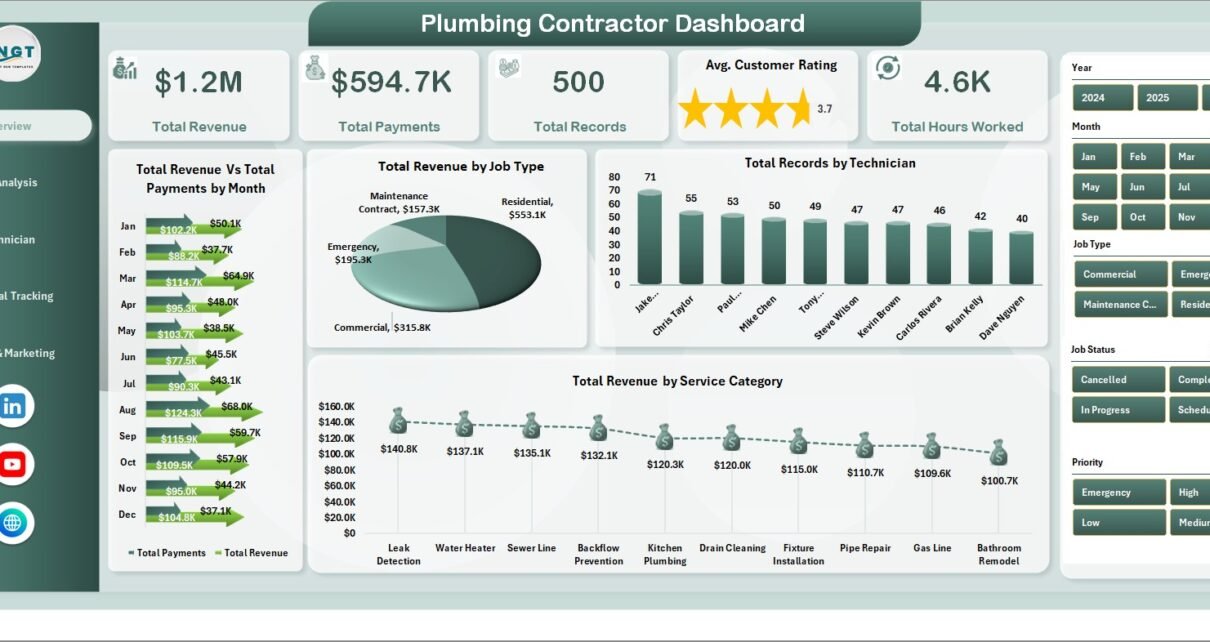
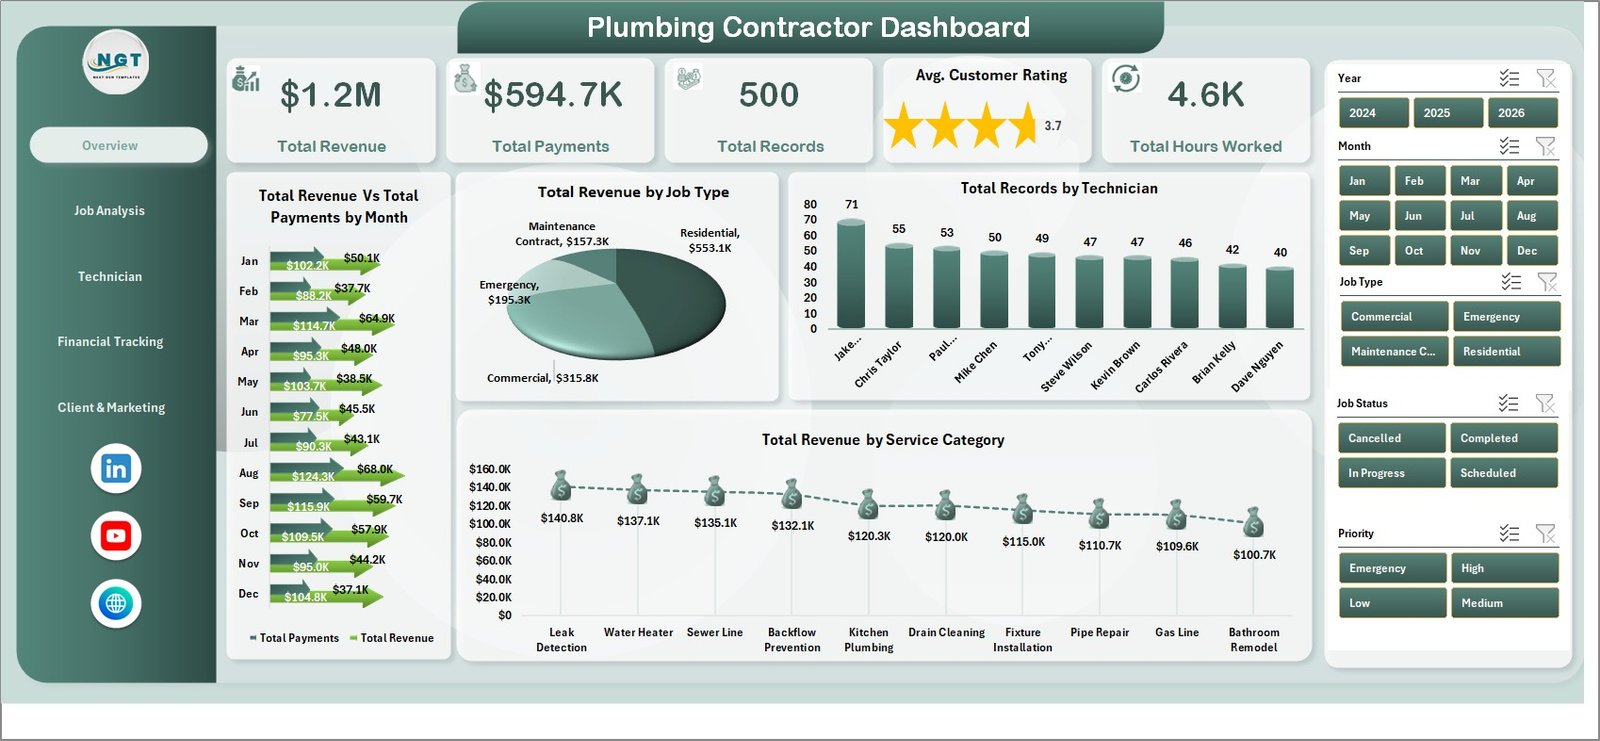
Page 1 — Overview
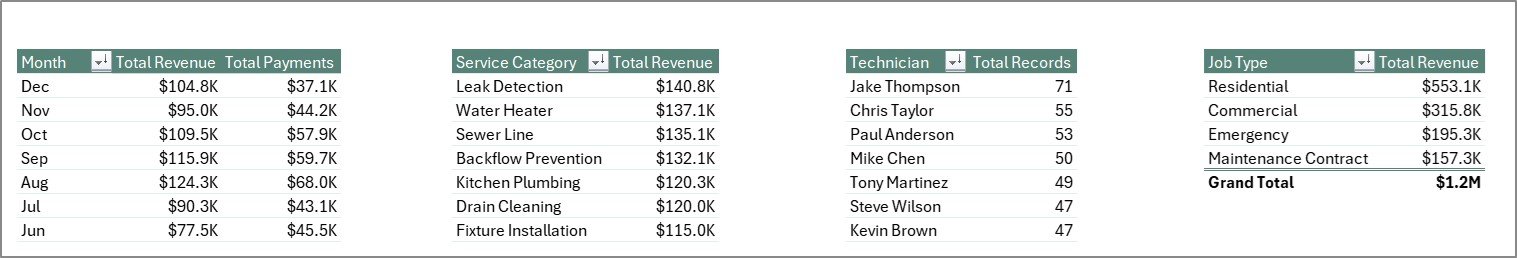
The Overview page is the owner’s weekly snapshot. The 5 KPI cards at the top — Total Revenue, Total Payments, Total Records, Avg. Customer Rating, Total Hours Worked — give the headline numbers. Below them, four charts go deeper: Total Revenue Vs Total Payments by Month exposes the gap between billed and collected revenue (your AR exposure), Total Revenue by Job Type shows whether emergency calls or scheduled service drives the P&L, Total Records by Technician shows job volume distribution across the crew, and Total Revenue by Service Category answers “what kind of work is paying the bills?”
Overview Page
Page 2 — Job Analysis
The Job Analysis page answers operational questions. Total Records by Priority shows whether you’re spending too much capacity on low-priority work. Total Hours Worked by Service Category exposes where labor is concentrated — useful when you’re pricing service categories and want to know where the time actually goes. Total Records by Location shows geographic distribution (often a clue for new branch decisions or marketing spend). Total Revenue by Technician closes the loop by tying revenue to crew assignment.
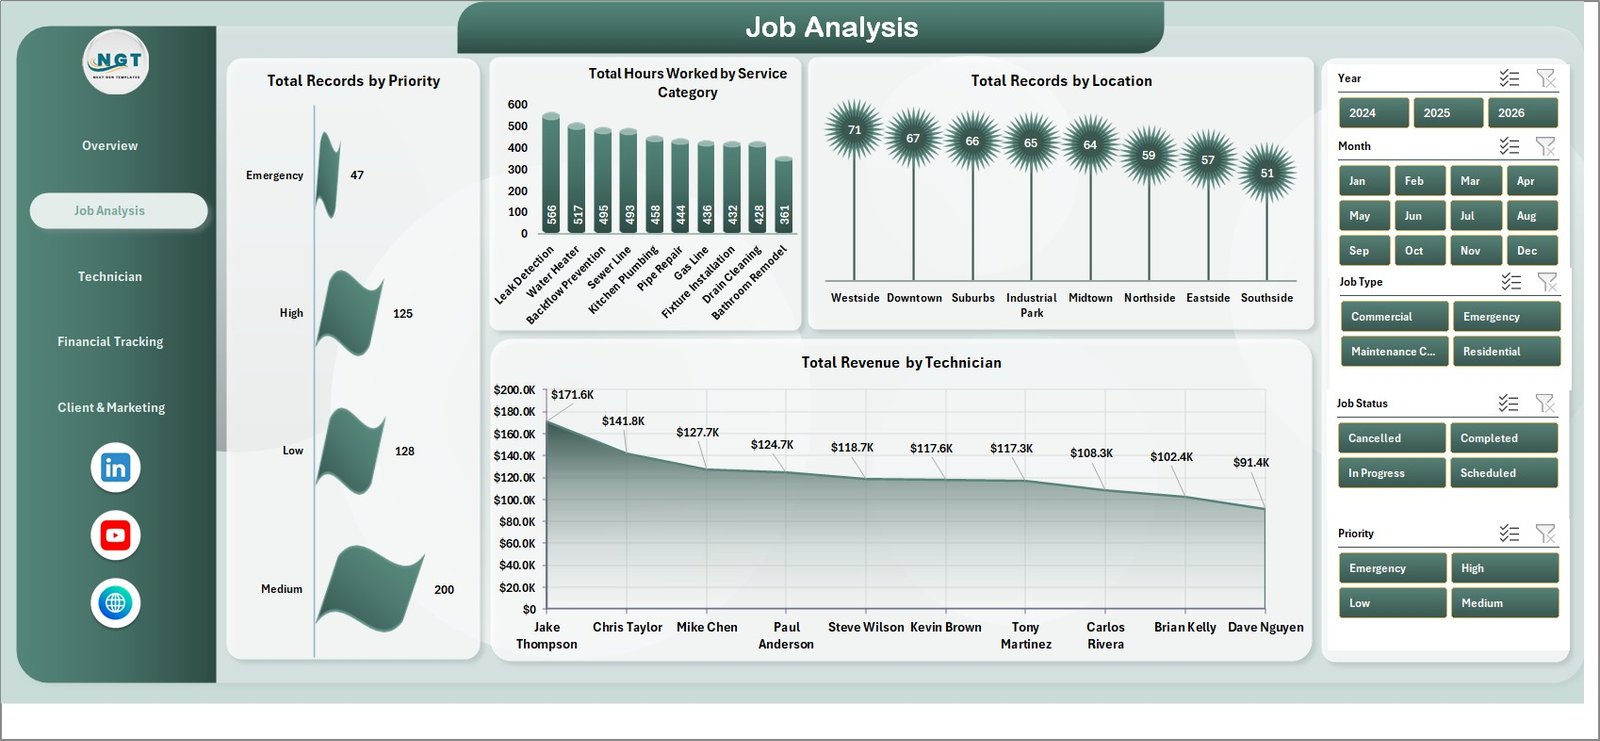
Job Analysis
Page 3 — Technician Performance
This is the page owners use for monthly 1-on-1s, bonus calculations, and training plans. Avg. Customer Rating by Technician is the customer-experience scorecard. Jobs Completed by Technician is the throughput metric. Total Hours Worked by Technician is the utilization view (cross-reference with revenue per tech to spot underutilized or over-extended crew). Net Profit by Month rolls up the entire P&L into a 12-month trend so you can see whether the year is heading the right direction.
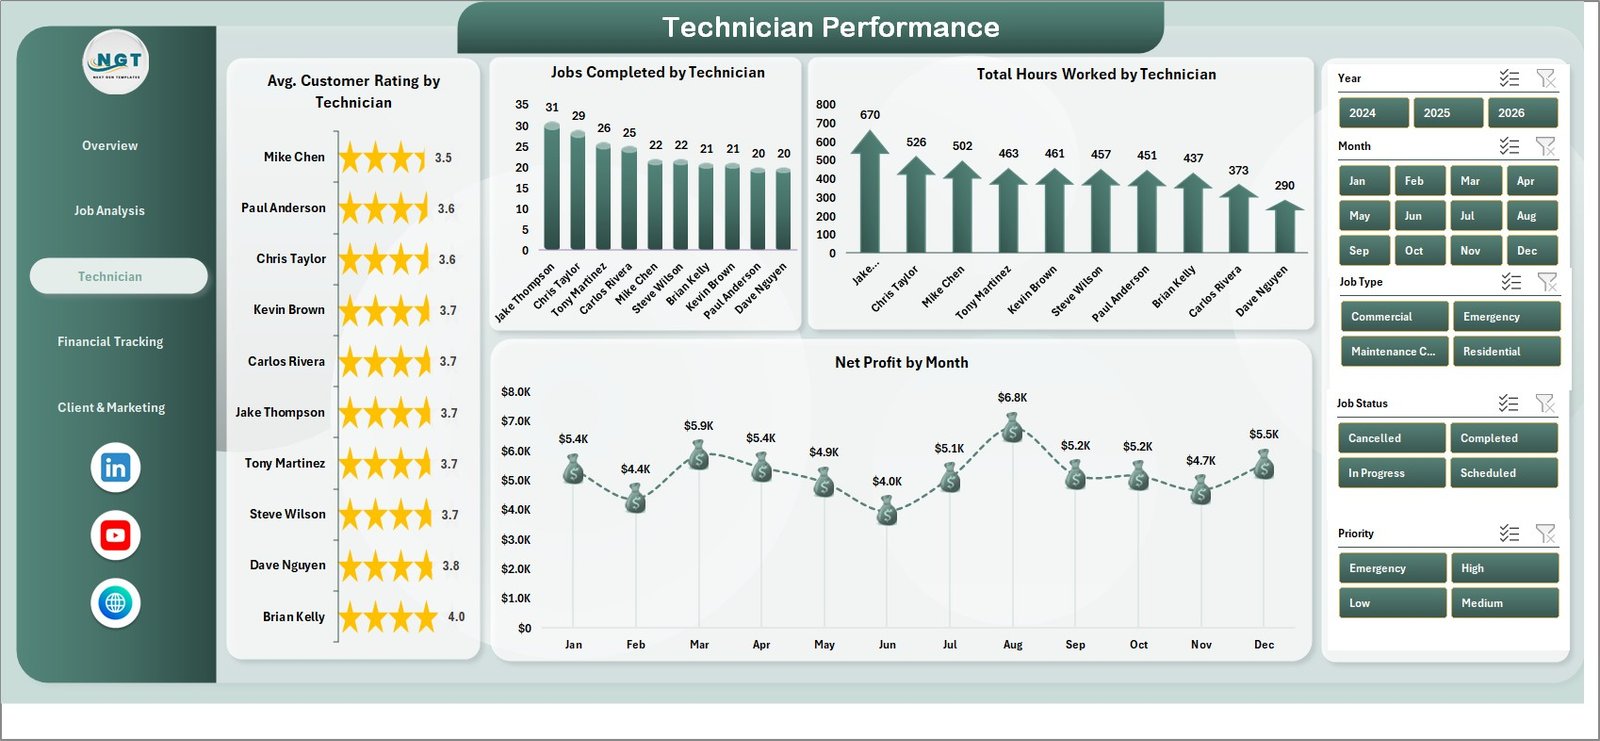
Technician Performance
Page 4 — Financial Tracking
The Financial Tracking page is where you find the money leaks. Total Revenue Vs Total Material Cost by Job Type tells you which job types are margin-rich and which ones you should reprice or stop bidding. Total Revenue by Payment Status (Paid / Pending / Overdue) is the AR call list — anything in Overdue gets a Tuesday-morning phone call. Total Revenue Vs Total Payments by Year is the year-over-year collection trend, and Total Records by Referral Source ties the marketing spend to actual booked jobs.
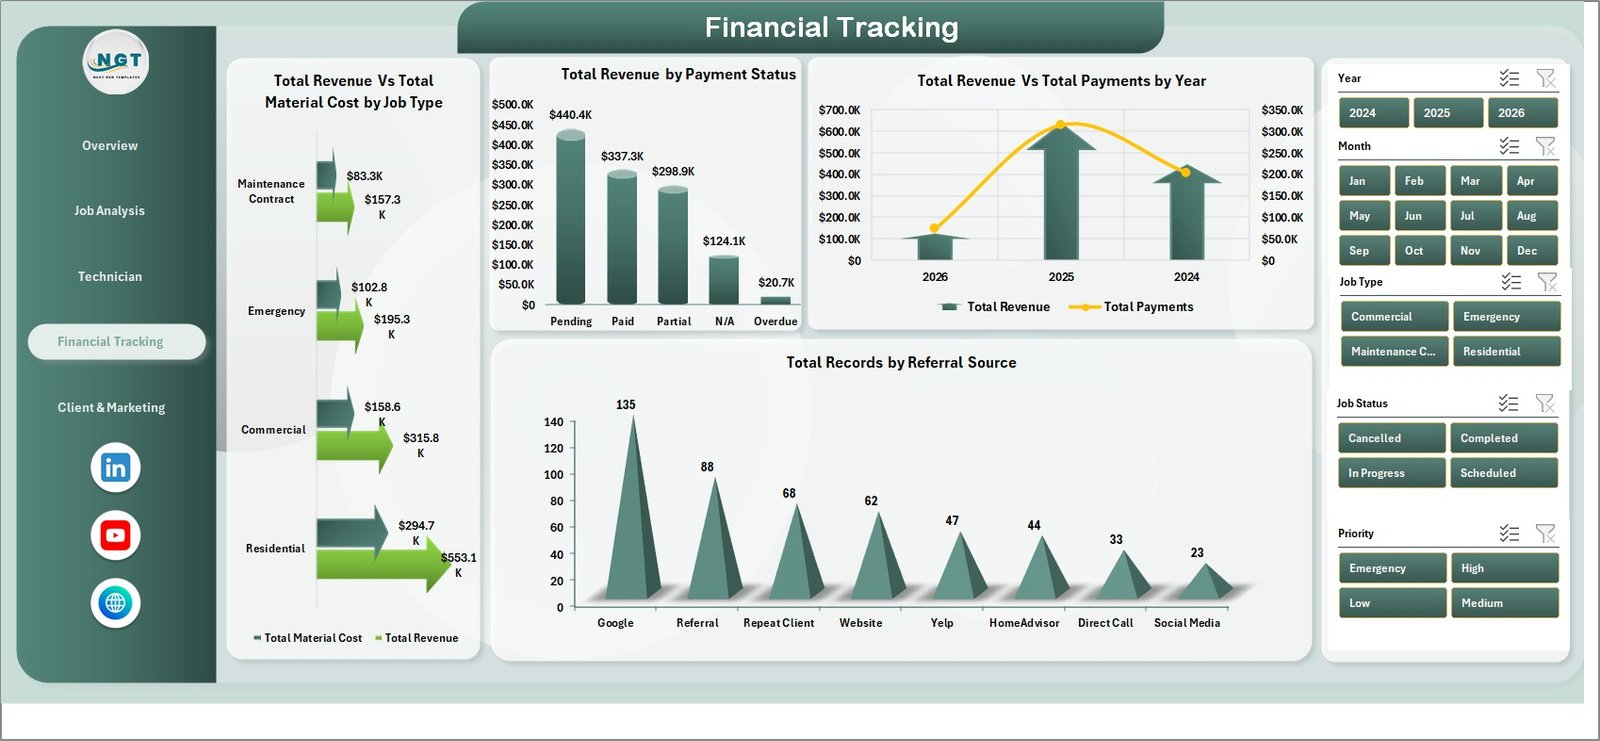
Financial Tracking
Page 5 — Client and Marketing
Total Revenue by Referral Source helps you decide whether the Yelp ad, the Google LSA, or the Nextdoor referrals are actually paying off. Total Records by Job Status shows the operational pipeline (Scheduled / In Progress / Completed / Cancelled). Total Revenue by Location tells you where to concentrate marketing dollars. Total Labor Cost by Month is the budget reality-check against the Net Profit trend on Page 3.
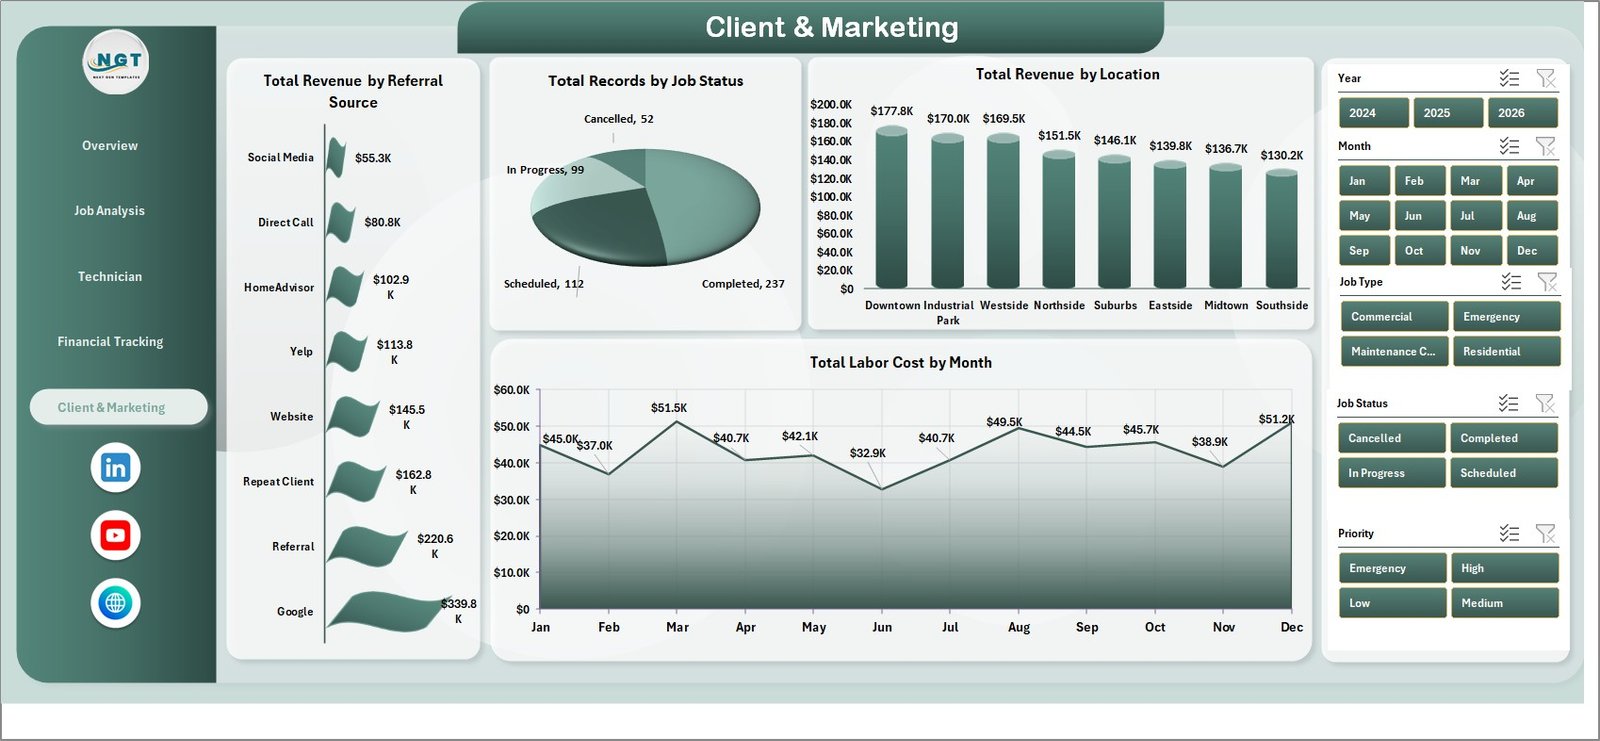
Client and Marketing
Data Sheet
The Data Sheet is the single source of truth — every pivot reads from it. Columns are pre-defined; just keep the headers identical and replace the sample rows with your own job log.
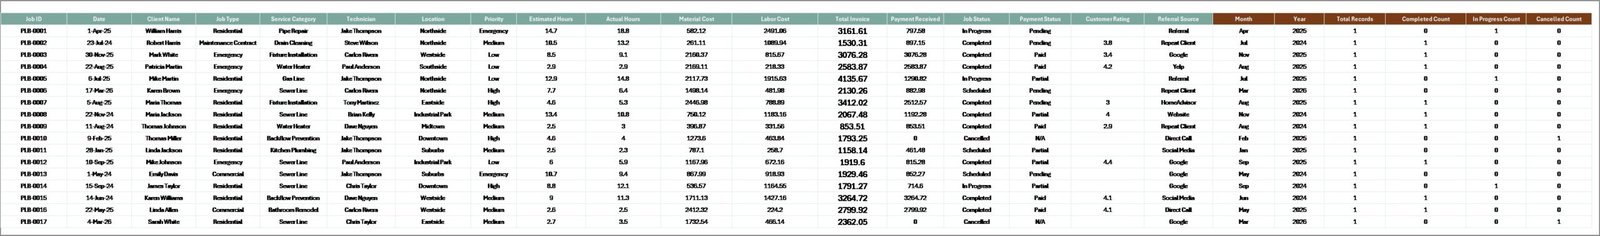
Data Sheet tab
Support Sheet
The Support Sheet hosts the pivot tables that drive every chart. After updating the Data Sheet, go to Excel Ribbon → Data → Refresh All, and every pivot rebuilds in one click. Right-click the Support Sheet tab and Hide it before sharing the file with crew or clients.
Support sheet tab
Plumbing Contractor Dashboard in Excel vs. Google Sheets vs. ServiceTitan / Jobber — Feature Comparison
| Feature | Plumbing Contractor Dashboard in Excel | Google Sheets Equivalent | ServiceTitan / Jobber / Housecall Pro |
|---|---|---|---|
| Cost | $17.99 one-time | $9–$15 one-time | $49–$398 / user / month |
| Platform | Microsoft Excel (offline) | Google Sheets (browser) | Cloud SaaS |
| Setup time | Under 10 minutes | 10–15 minutes | 2–6 weeks onboarding |
| Customizable fields | ✅ Fully editable | ✅ Fully editable | Limited to vendor schema |
| Slicer-driven filtering | ✅ Native Excel slicers | Filter views (clunkier) | ✅ Built-in |
| Technician performance view | ✅ 4 charts on dedicated page | ✅ Same charts | ✅ Available on higher tiers |
| Per-user fees | None — share the file | None | $49–$398 per technician / month |
| Year-1 cost at 5 users | $17.99 | $9–$15 | $2,940–$23,880 |
| Mobile dispatch app | ❌ Desktop / OneDrive only | Browser on mobile | ✅ Native iOS/Android |
For plumbing contractors who want owner-level visibility into revenue, technician performance, and AR — without paying $49–$398 per technician per month for a full field-service platform — the Plumbing Contractor Dashboard in Excel sits in the sweet spot.
Who Should Use This Template
Perfect for:
- Independent plumbing contractors and 2–25 technician shops who already log jobs in a spreadsheet or QuickBooks
- Plumbing business owners who want a weekly KPI review without hiring a bookkeeper or analyst
- Office managers and dispatchers who need to slice job data by technician, location, or service category
- Trades-business consultants who need a client-ready reporting template for plumbing clients
Not a fit if:
- You run a multi-location plumbing franchise and need real-time mobile dispatch with GPS routing
- You need an integrated invoicing, payments, and customer-messaging platform — that is what ServiceTitan and Jobber are built for
- You’ve never tracked job-level data and have no historical records to load into the Data Sheet
Real-World Use Cases
Mark runs an 8-technician plumbing shop in Phoenix. He used to spend Sunday evenings building a job summary in Google Sheets to brief his lead tech on Monday morning. With the Plumbing Contractor Dashboard, he pastes the week’s jobs into the Data Sheet, clicks Refresh All, and walks into the Monday huddle with a printed Technician Performance page. Total time from raw data to printed brief: about 4 minutes. The Avg. Customer Rating chart became the single most useful tool in his quarterly bonus conversation — every tech now knows exactly where they stand.
Lisa is the office manager at a 3-tech residential plumbing company in Denver. She needed a way to flag unpaid invoices without buying ServiceTitan at $300/month per seat. The Financial Tracking page’s “Total Revenue by Payment Status” chart now drives her Tuesday-morning AR follow-up call list, and the “Total Records by Referral Source” chart helped the owner kill a $400/month Yelp ad spend that wasn’t pulling its weight — savings paid for the dashboard 22 times over.
Raj is an independent consultant for trades businesses across Texas. He uses the Plumbing Contractor Dashboard as a 30-minute discovery deliverable for new plumbing clients. He pastes the client’s last 6 months of jobs into the Data Sheet, screenshots the Overview and Technician Performance pages, and the conversation about where to invest moves much faster. He charges $750 for the discovery, the dashboard cost him $17.99 — the math is good.
Advantages of the Plumbing Contractor Dashboard in Excel
- Zero subscription: $17.99 one-time vs. $588–$4,776 per technician per year for ServiceTitan-tier platforms.
- Owner-level visibility in 10 minutes: paste in your jobs, refresh, done.
- No vendor lock-in: it’s an Excel file. You own it. You can edit any column, add any field, change any chart, share it with your accountant.
- Works offline: no internet required. Useful when you’re reviewing the week from the truck.
- Mac & Windows: standard pivot tables, slicers, and charts. No macros, no platform-specific features.
- Pivot-driven architecture: every chart auto-rebuilds on Refresh All. No broken formulas when you add rows.
Opportunities for Improvement
To be balanced — this dashboard is a reporting layer, not an operations platform. There are a few things it doesn’t do, and it’s worth being upfront about them:
- No mobile dispatch app. If you need GPS-routed job assignment with live status updates from techs in the field, you need ServiceTitan, Jobber, or Housecall Pro. The dashboard reports on jobs after they’re logged; it doesn’t run them.
- No integrated invoicing or payments. You’ll still create invoices in QuickBooks (or your AR tool of choice) and log payment status into the Data Sheet manually. The dashboard reads what you record; it doesn’t generate or collect.
- No real-time multi-user collaboration. Excel + OneDrive supports co-authoring, but it’s not as smooth as a true SaaS. If your office staff edits the file simultaneously all day, Google Sheets may suit better.
- Manual data entry. You (or your office manager) will paste rows into the Data Sheet. No CRM connector, no FieldEdge import. For 2–25 tech shops this is a 30-minute weekly task; for 50+ tech operations it’s a constraint.
Best Practices
- Update weekly, not monthly: the AR follow-up workflow only works if Payment Status is current within 7 days.
- Hide the Support Sheet before sharing the file with crew or clients (right-click tab → Hide).
- Don’t rename Data Sheet column headers — pivots reference them by name; rename one and the corresponding chart breaks.
- Add custom fields at the right of the Data Sheet, then refresh the affected pivots and drag the new field in. Don’t insert columns in the middle.
- Save monthly snapshots: file → Save As → “Plumbing-Dashboard-2026-04.xlsx”. Year-over-year trend analysis is much easier when you have monthly archives.
- Use slicers for client meetings: filter to one technician or service category to make the conversation specific.
Explore Relevant Templates
If you’re a trades or field-service business, these templates from our Excel Dashboard library pair naturally with the Plumbing Contractor Dashboard:
- 👉 HVAC Service Dashboard in Excel — same architecture, different trade. Useful if you also offer HVAC service or partner with one.
- 👉 Landscaping Dashboard in Excel — covers crews instead of technicians, but the KPI logic is identical.
- 👉 Field Service KPI Dashboard in Google Sheets — good if your office staff prefers browser-based collaboration.
- 👉 HVAC Service Dashboard in HTML — standalone HTML version if you want to publish a read-only version to a private URL.
- 👉 Oil and Gas Analysis Dashboard in Excel — for service contractors in the energy sector.
Frequently Asked Questions
What KPIs does the Plumbing Contractor Dashboard in Excel track?
The Plumbing Contractor Dashboard in Excel tracks 5 headline KPIs — Total Revenue, Total Payments, Total Records, Average Customer Rating, and Total Hours Worked — plus 17 supporting charts spanning job priority, service category, technician performance, payment status, and referral source. All KPIs and charts update automatically when you click Refresh All in the Excel Ribbon.
How long does setup take?
Setup takes under 10 minutes for the Plumbing Contractor Dashboard. Open the file, replace the sample rows in the Data Sheet with your own job records, and click Data → Refresh All in the Excel Ribbon. Every chart, KPI, and slicer across all 5 dashboard pages rebuilds automatically — no formula edits required.
How does the Plumbing Contractor Dashboard compare to ServiceTitan or Jobber?
ServiceTitan and Jobber are full-stack field-service platforms with mobile dispatch, payments, CRM, and customer messaging at $49–$398 per technician per month. The Plumbing Contractor Dashboard in Excel is a $17.99 one-time reporting layer for owners who already track jobs elsewhere and just need a clean weekly KPI view.
Does this template work in Excel for Mac and Excel 365?
Yes. The Plumbing Contractor Dashboard in Excel uses standard pivot tables, slicers, and charts — all supported in Excel 2016 or later, Excel 365, and Excel for Mac (2016 or later). No macros or VBA, so the file opens identically across Windows and Mac with no compatibility issues.
Can I add custom fields to the Plumbing Contractor Dashboard?
Yes. Add new columns to the right of the Data Sheet, then go to the Support Sheet, refresh the affected pivot tables, and drag the new field into Rows, Columns, Values, or Filters as needed. The Plumbing Contractor Dashboard is fully customizable — every pivot, chart, and slicer is editable.
Is the Plumbing Contractor Dashboard a one-time purchase or a subscription?
The Plumbing Contractor Dashboard in Excel is a one-time purchase of $17.99 with lifetime access. There are no subscriptions, no per-user fees, and no recurring charges. Download the file, share it with your office team, and use it forever — even on multiple workstations.
What size of plumbing business is this dashboard built for?
The Plumbing Contractor Dashboard in Excel works best for 2–25 technician shops. Below 2 techs the Technician Performance page has limited utility; above 25 techs you’ll likely outgrow Excel’s manual data-entry model and want a proper field-service platform.
About the Author
Built by PK — Microsoft Certified Professional with 15+ years of Excel, Google Sheets, and Power BI experience. Founder of NextGenTemplates, reaching 300K+ subscribers across YouTube channels. Every template is hand-built and tested before release.
Conclusion
If you run a small or mid-sized plumbing business and you’ve been weighing whether to drop $300+/month per technician on ServiceTitan, the Plumbing Contractor Dashboard in Excel is the $17.99 alternative that gives you owner-level visibility on revenue, AR, technician performance, and marketing ROI in under 10 minutes of setup. It’s not a dispatch app and it doesn’t replace your invoicing tool — but for the weekly Monday-morning KPI review, the monthly tech 1-on-1, and the quarterly marketing-budget conversation, it’s the cleanest tool we’ve built for the trade.
📥 Click here to Purchase the Plumbing Contractor Dashboard in Excel
Instant download · One-time payment · No subscription
🎥 Visit our YouTube channel for step-by-step video tutorials
👉 Youtube.com/@PK-AnExcelExpert
📅 Last updated: April 2026