The Public Relations (PR) Report in Excel tracks 5 core PR KPIs across 4 structured sheets, with 5 interactive charts covering Positive Campaign %, channel mix, regional cost, event-type distribution, and monthly spend. Setup takes under 10 minutes — paste your campaign data, click Refresh All, and every card, chart, and slicer recalculates automatically through pivot tables.
This article walks through every page of the Public Relations (PR) Report in Excel — what each sheet contains, which KPIs are tracked, how the comparison stacks up against tools like Cision and Meltwater, and how PR managers, agencies, and in-house comms teams are using it today. If you’ve been running monthly PR reports out of a messy spreadsheet (or paying $7,000+ per year for SaaS just to summarise placements), this template fills that exact gap.
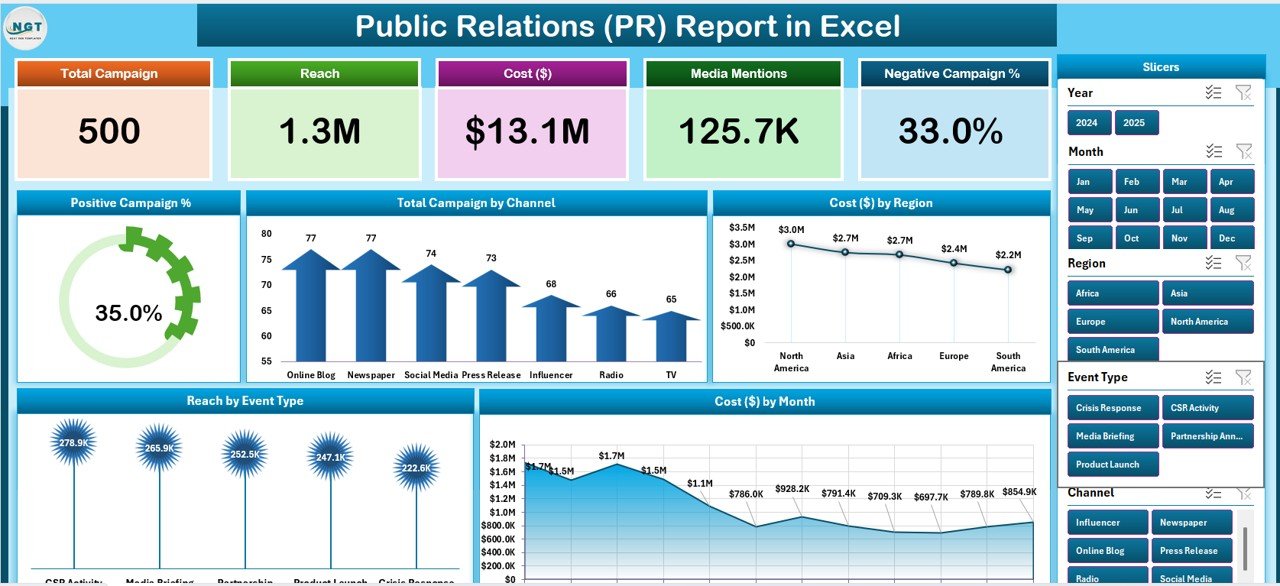
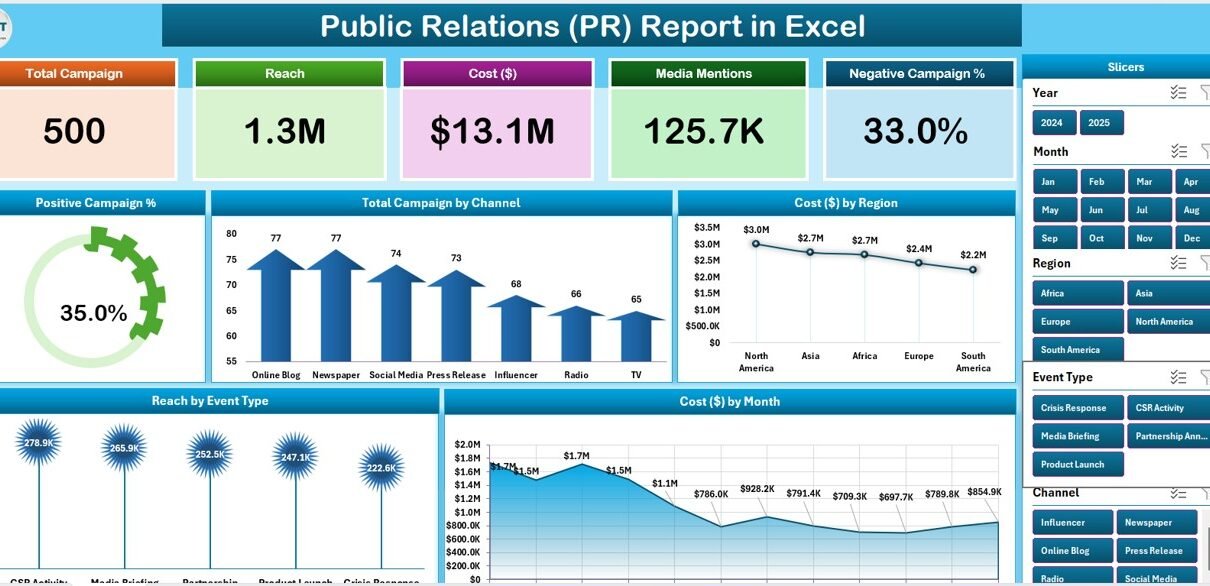
Public Relations (PR) Report in Excel — Summary Page
Key Features of the Public Relations (PR) Report in Excel
This Excel report is built entirely with native pivot tables and slicers — no VBA, no macros, no add-ins — so it runs identically on Windows Excel and Mac Excel 2016 or later. It tracks 5 KPIs and 5 charts on the Summary Page, drives a campaign-level information table on the Report Page, and stores 100% of the calculation logic in a hidden Support sheet.
- Five-KPI Summary Page with a right-side slicer panel filtering channel, region, event type, and month.
- Five core charts — Positive Campaign %, Total Campaign by Channel, Cost by Region, Region by Event Type, and Cost by Month.
- Dedicated Report Page with a left-side slicer driving a campaign-level information table for client decks and audits.
- Pivot-table architecture in the Support sheet — update the Data sheet, hit Refresh All, every visual updates.
- Offline-first — embargoed press releases and unannounced campaign data never leave your machine.
- One-time $7.99 purchase — no subscription, no per-user fees, lifetime access.
Sheets Explanation
The file contains 4 sheets, each with a specific role in the PR reporting workflow.
1. Summary Page
This is the dashboard. Five KPI cards sit across the top of the Summary Page and give PR leads an instant view of campaign performance. A right-side slicer panel filters the entire page by channel, region, event type, and month — so you can answer questions like “what did we spend in EMEA on product launches last quarter?” in two clicks.
Five charts cover the core analytical questions:
- Positive Campaign % — the share of campaigns that landed positive coverage versus neutral or negative mentions.
- Total Campaign by Channel — campaign volume across Press Release, Media Pitch, Press Conference, Influencer, Social Media, and Podcast Tour channels.
- Cost by Region — total PR spend by region (North America, EMEA, APAC, LATAM).
- Region by Event Type — how Product Launches, Crisis Responses, Awards, Trade Shows, and Sponsorships distribute across regions.
- Cost by Month — a 12-month trend view of total PR spend.
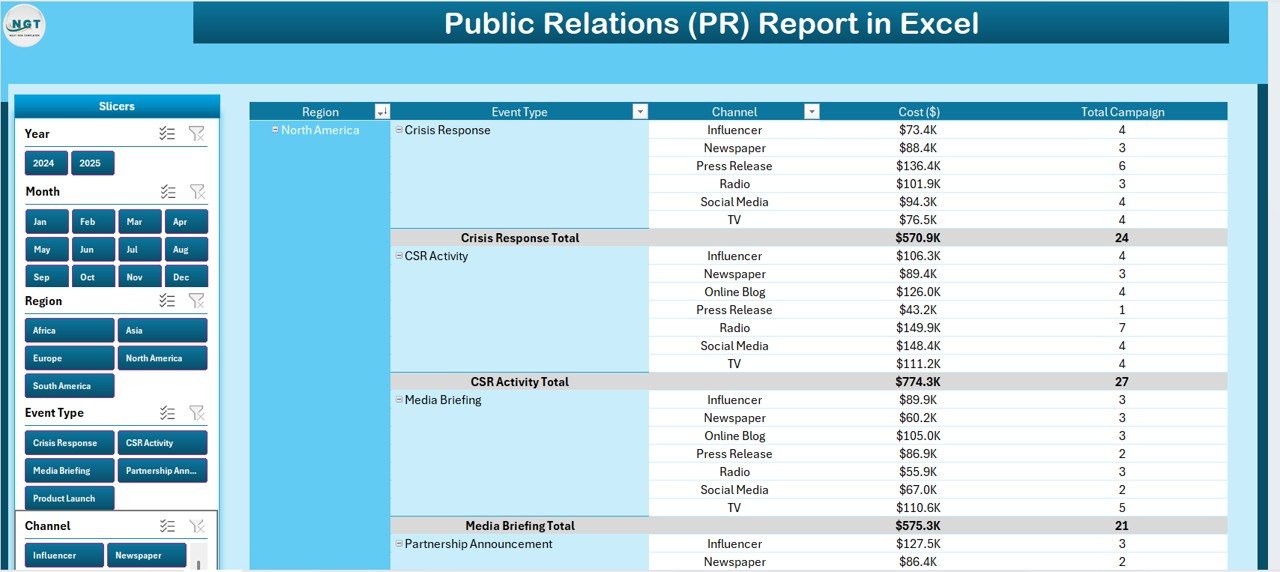
Report Page with left-side slicer and information table
2. Report Page
The Report Page is built for client decks, retainer reports, and PR audits. A left-side slicer drives a campaign-level information table that you can filter by any combination of channel, region, event type, and time period. Use it to pull a clean, filtered list of campaigns to drop into a client review or month-end deliverable.
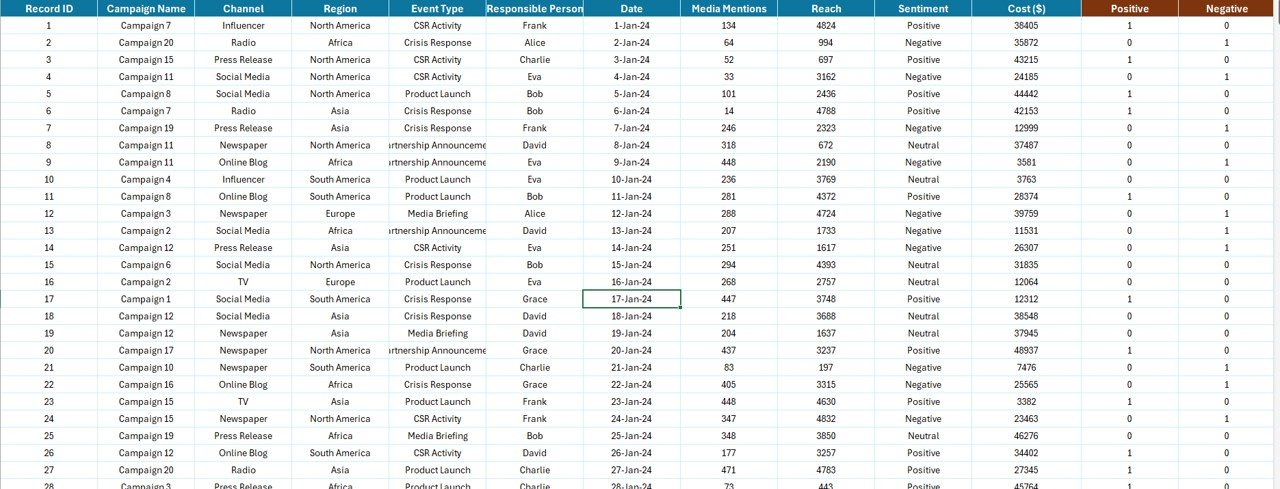
Data Sheet — replace sample campaign data here
3. Data Sheet
This is the only sheet you actively edit. Paste your campaign-level data into the same column structure as the sample (Campaign ID, Date, Channel, Region, Event Type, Cost, Sentiment, Reach, Placements). Keep the column headers identical — every pivot table in the Support sheet depends on them.
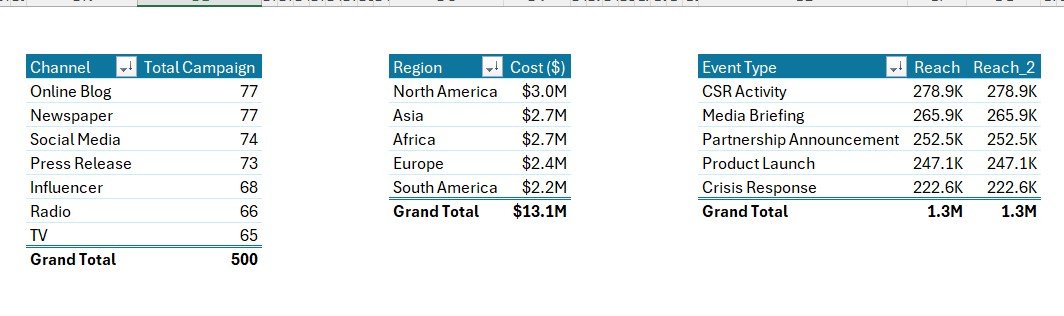
Support Sheet with pivot tables driving every chart
4. Support Sheet
The Support sheet holds every pivot table that feeds the Summary Page cards and charts. After you update the Data sheet, click Data → Refresh All in the Excel ribbon and every pivot recalculates. In production, hide this sheet — your team only needs to see the Summary Page and Report Page. (Microsoft has a good primer on building PivotTables in Excel if you’d like a refresher.)
Public Relations (PR) Report in Excel vs. Google Sheets Equivalent vs. Cision / Meltwater — Feature Comparison
| Feature | Public Relations (PR) Report in Excel | Google Sheets equivalent | Cision / Meltwater |
|---|---|---|---|
| Cost | $7.99 one-time | ~$10 one-time template | $7,000–$24,000 / year |
| Platform | Microsoft Excel (desktop) | Google Sheets (browser) | Web SaaS |
| Works offline | ✅ Yes | ❌ Requires internet | ❌ Requires internet |
| Setup time | Under 10 minutes | ~15 minutes | 2–4 weeks onboarding |
| Customizable KPIs & charts | ✅ Fully editable | ✅ Editable | ❌ Fixed reports |
| Per-user licence fees | None — share freely | None | $500+ per seat / month |
| Embargoed data stays local | ✅ Yes | ❌ Cloud (Google servers) | ❌ Vendor cloud |
| Year-1 cost at 5 PR users | $7.99 | ~$10 | $7,000 – $24,000+ |
| Channel & region breakdown | ✅ Pre-built | Needs rebuild | ✅ Pre-built |
For comms teams that want channel, region, and sentiment visibility without paying $7,000+ per year in media-monitoring fees, the Public Relations (PR) Report in Excel sits in the sweet spot.
Who Should Use This Template
Perfect for:
- Solo PR consultants reporting to 3–10 retainer clients each month.
- In-house PR managers at 50–500-person companies preparing monthly board reports.
- Boutique PR agencies (3–20 staff) running multi-region campaigns without an enterprise SaaS budget.
- Comms teams reconciling campaign cost against placements and sentiment for quarterly reviews.
- Marketing managers who own PR as one channel and want a clean cost-per-region view.
Not a fit if:
- You need real-time media monitoring, journalist databases, or distribution wires (use Cision or Meltwater).
- You’re a global enterprise comms team with 100+ outlets and AI sentiment scoring requirements.
- You don’t have a Microsoft Excel licence — try the PR Outreach Calendar in Google Sheets instead.
Real-World Use Cases
Anika runs a 6-person boutique PR agency in London. Each month she opens the Public Relations (PR) Report and shows her 8 retainer clients exactly which campaigns generated positive coverage, broken down by channel and region. The Cost by Region chart helped her spot that EMEA campaigns were delivering 2x the placements per dollar versus North America, so she shifted budget and grew her agency margin by roughly 14% in one quarter — without buying a Cision seat.
Marcus is the in-house Head of Comms at a 200-person SaaS company in Austin. He uses the Region by Event Type chart to plan the next quarter’s product launches and trade shows, and the Positive Campaign % chart to brief the CEO before every board meeting. He saved roughly $14,000 in his first year by replacing his Cision seat with this $7.99 template — without losing reporting fidelity. The board now expects this exact view each quarter.
Sara is a solo PR consultant managing 4 startup clients from Toronto. She needs polished monthly reports for client decks, but she can’t justify $588+/month for SaaS at her current revenue. The Public Relations (PR) Report gives her the Cost by Month and Channel-mix charts she needs, runs entirely offline on her MacBook, and cost her $7.99 once. She uses the Report Page slicers to pull a per-client view in seconds.
Advantages of the Public Relations (PR) Report in Excel
- Cost — $7.99 one-time versus $7,000–$24,000/year for enterprise media-monitoring SaaS.
- Speed — under 10 minutes from download to first chart, no IT involvement.
- Privacy — embargoed campaign data and pre-launch briefings stay on your device.
- Customisability — every KPI, slicer, chart, and column header can be renamed, restyled, or extended.
- Shareability — email the .xlsx file to anyone with Excel; no per-user licence cost.
- Audit trail — Excel files can be version-controlled, archived, and reopened years later. SaaS reports often disappear when subscriptions lapse.
Opportunities for Improvement
To be straightforward: this template is a reporting tool, not a media-monitoring suite. It does not ingest press clippings automatically, scan news outlets in real time, or generate journalist contact lists. If your PR programme requires those capabilities, you’ll still want a Cision, Meltwater, or Muck Rack subscription — and you can still use this template alongside those tools to produce a clean, branded monthly client deliverable that doesn’t require a SaaS login to read.
The template also assumes you can categorise campaign sentiment manually. If you want automated sentiment analysis, that requires a separate tool. The Positive Campaign % chart simply visualises whatever sentiment label you assign in the Data sheet.
Best Practices
- Keep the Data sheet column headers identical to the sample. Pivot tables fail silently if a header is renamed.
- Use consistent category names (e.g., always “EMEA”, never “Europe” or “Emea”) so pivots don’t split a single category into multiple rows.
- Click Data → Refresh All after every Data-sheet update — pivots do not auto-recalculate on edit.
- Hide the Support sheet before sharing externally. Right-click the tab → Hide.
- Save monthly snapshots as separate files (e.g., PR_Report_2026-04.xlsx). Excel files version beautifully; SaaS reports do not.
- For year-over-year comparisons, paste a year of data into the Data sheet and use the slicer to switch between years rather than maintaining separate files.
Explore Relevant Templates
- Public Relations KPI Scorecard in Excel — Traffic-light status against monthly PR targets, complementary to this report.
- Corporate Communications Dashboard in Power BI — Power BI version for larger comms teams that need interactive drill-downs.
- Public Relations (PR) Outreach Calendar in Google Sheets — Plan media outreach 12 weeks ahead.
- Administration Report in Excel — Same Excel report format applied to admin operations.
- Mental Health Services Report in Excel — Same report format adapted for clinical practices.
Frequently Asked Questions
What KPIs does the Public Relations (PR) Report in Excel track?
The Public Relations (PR) Report tracks 5 headline KPIs on the Summary Page — shown as card visuals — plus 5 interactive charts covering Positive Campaign %, Total Campaign by Channel, Cost by Region, Region by Event Type, and Cost by Month. All metrics auto-update when you refresh the pivot tables.
How does this compare to Cision or Meltwater?
Cision and Meltwater charge roughly $7,000–$24,000 per year per seat for full media-monitoring suites. The Public Relations (PR) Report in Excel is a $7.99 one-time purchase with no per-user fees and works offline. It does not replace real-time media monitoring or journalist databases — it replaces the monthly summary report.
How long does setup take?
Setup takes under 10 minutes. Open the .xlsx file, paste your campaign-level data into the Data sheet (keep the column headers identical), then click Data → Refresh All. Every card, chart, and slicer on the Summary Page updates automatically. No formulas to edit.
Does this template work on Mac Excel?
Yes. The Public Relations (PR) Report in Excel is built entirely with pivot tables and slicers — no VBA, no macros — so it runs identically on Windows Excel and Mac Excel 2016 or later. No internet connection is required, and no add-ins need installing.
Can I add my own channels, regions, or event types?
Yes. Add new channels, regions, event types, or sentiment categories to the Data sheet. After adding rows, click Data → Refresh All in the ribbon. Every pivot table on the Support sheet picks up the new categories and updates the Summary Page charts automatically.
Is embargoed campaign data safe with this template?
Data stays on your device. The Public Relations (PR) Report in Excel doesn’t connect to any cloud service, API, or external database — useful when handling embargoed press releases or unannounced campaign briefs. For full enterprise security, encrypt the file and control access through OneDrive or SharePoint permissions.
Can I share the report with clients?
Yes. Email the .xlsx file or share via OneDrive, Dropbox, or SharePoint. There’s no per-user licence — clients and account managers can open and filter the report freely with any Microsoft Excel installation. Hide the Support sheet first to keep the file clean.
About the Author
Built by PK — Microsoft Certified Professional with 15+ years of Excel, Google Sheets, and Power BI experience. Founder of NextGenTemplates, reaching 300K+ subscribers across YouTube channels (@PK-AnExcelExpert, @NextGenTemplates, @NeoTechNavigators). Every template is hand-built and tested before release.
Conclusion
The Public Relations (PR) Report in Excel is the cleanest way to summarise PR campaign performance for clients, leadership, or board reviews — without paying SaaS prices. Five KPIs, five charts, a slicer-driven Report Page, and a hidden Support sheet that does the math invisibly behind the scenes. Replace the sample data, click Refresh All, and you have a polished, presentation-ready report in under 10 minutes.
👉 Click here to Purchase the Public Relations (PR) Report in Excel
✅ Instant download · One-time payment · No subscription
🎥 Visit our YouTube channel for step-by-step Excel tutorials: YouTube.com/@PK-AnExcelExpert
📅 Last updated: April 2026