The Plumbing Contractor Dashboard in Power BI tracks 5 headline KPIs and 12 DAX-driven visuals across 5 interactive report pages — Overview, Job Analysis, Technician Performance, Financial Tracking, and Client & Marketing. The .pbix file takes under 10 minutes to set up and costs $17.99 one-time, compared with $49–$398 per technician per month for SaaS field-service platforms like ServiceTitan, Jobber, or Housecall Pro.
If you run a plumbing business, manage a multi-tech shop, or consult for trades operators, this Power BI dashboard gives you instant visibility into revenue, material cost, technician performance, payment status, and referral ROI — without the subscription, per-tech fees, or vendor lock-in of full field-service software. This post walks through every page, every visual, who it’s built for, and how it stacks up against both Tableau / Qlik builds and turnkey SaaS platforms.

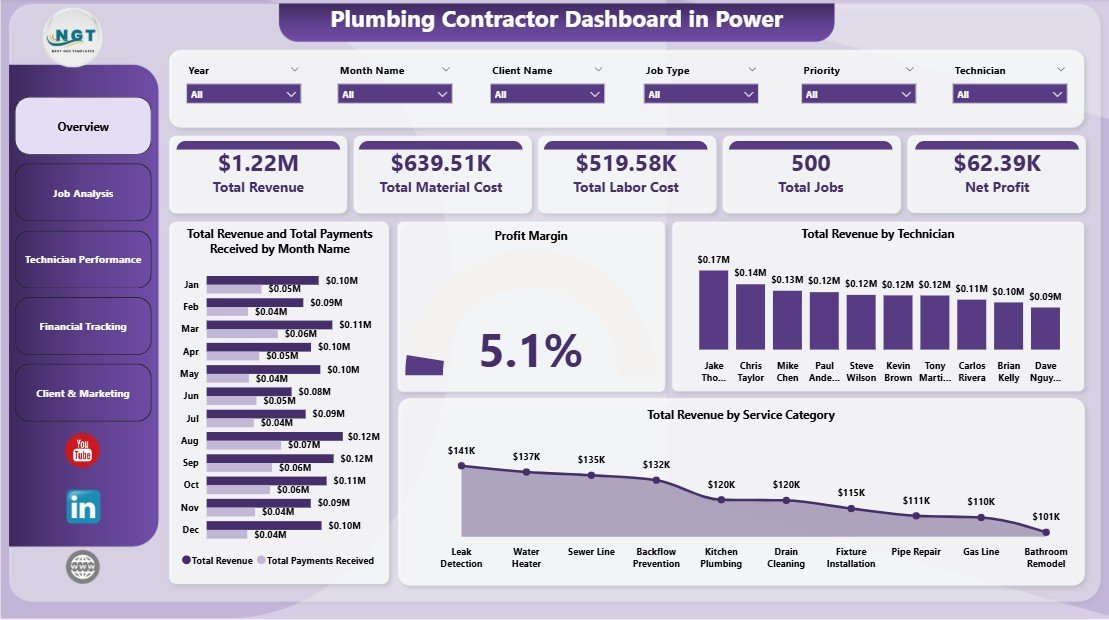
Plumbing Contractor Dashboard in Power BI — Overview Page
Key Features of the Plumbing Contractor Dashboard in Power BI
- 5 dedicated report pages — Overview, Job Analysis, Technician Performance, Financial Tracking, and Client & Marketing, each answering a different owner question.
- 5 executive KPI cards on the Overview page — Total Revenue, Total Material Cost, Total Labor Cost, Total Jobs, and Net Profit.
- 12 DAX-driven visuals spread across the 5 pages, each anchored to a Power BI measure that recalculates on Refresh.
- Cross-page slicers — filter every page by technician, service category, location, priority, or payment status with synced selections.
- Profitability analysis — Profit Margin and Profit Margin by Referral Source visuals expose which marketing channels deliver profit, not just calls.
- Technician performance view — Avg Customer Rating by Technician, Completed Jobs by Technician, and Net Profit by Month for monthly 1-on-1s and bonus calculations.
- Editable star-schema data model — connect the .pbix to your Excel, CSV, or SQL job log; refresh and visuals update automatically.
- Free Power BI Desktop — runs locally without a Power BI Pro license; Pro is only required to publish to the Power BI Service.
For the data connection and DAX fundamentals used in this dashboard, see the Microsoft Power BI fundamentals documentation.
Dashboard Pages Explanation
Page 1 — Overview
The Overview page is the owner’s weekly snapshot. Five KPI cards at the top show Total Revenue, Total Material Cost, Total Labor Cost, Total Jobs, and Net Profit at a glance. Below the cards, four visuals go deeper: Total Revenue and Total Payments Received by Month Name exposes the gap between billed and collected revenue (your AR exposure trend), Profit Margin shows the headline profitability ratio, Total Revenue by Technician shows revenue contribution per crew member, and Total Revenue by Service Category answers “what kind of work is paying the bills?”. Cross-page slicers at the top let you filter every visual at once.
Overview Page
Page 2 — Job Analysis
The Job Analysis page answers operational questions in three visuals. Total Jobs by Location shows geographic distribution — useful when deciding where to open the next service area or concentrate marketing dollars. Total Jobs by Priority shows the split between Emergency, High, Medium, and Low priority calls; a high emergency ratio is a leading indicator of deferred maintenance among your customer base. Total Revenue by Technician closes the loop on Page 1 by ranking revenue contribution and helping owners spot under-performing or over-extended crew.
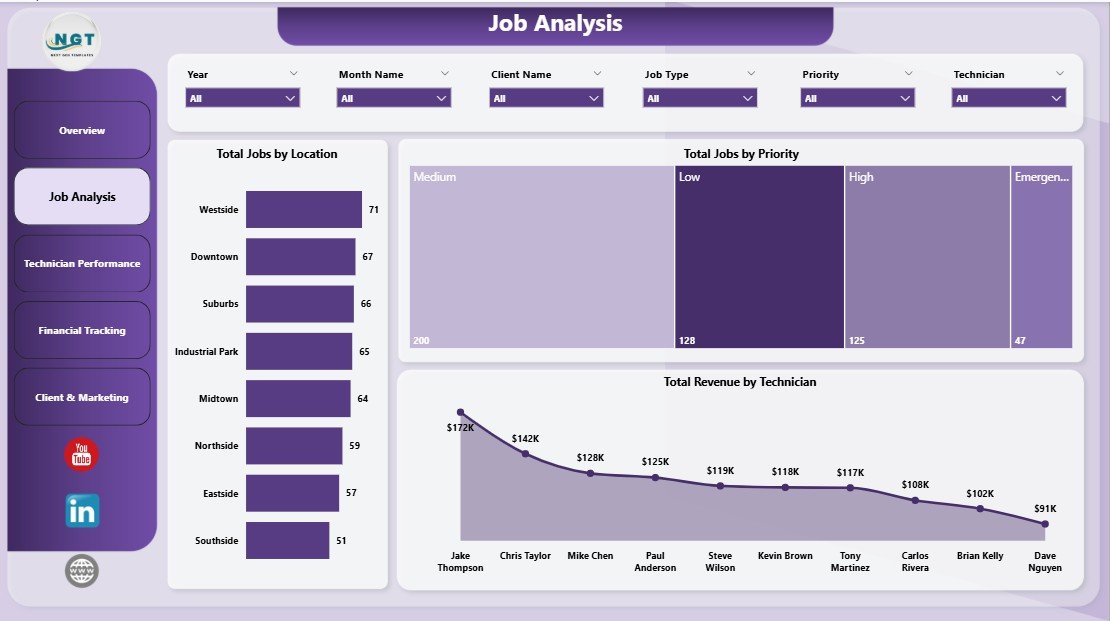
Job Analysis
Page 3 — Technician Performance
This is the page owners use for monthly 1-on-1s, quarterly bonus calculations, and training plans. Avg Customer Rating by Technician is the customer-experience scorecard — a tech with high revenue and a 3.2/5 rating is a coaching opportunity, not a bonus candidate. Completed Jobs by Technician is the throughput view (cross-reference with revenue per tech to spot underutilization). Net Profit by Month rolls up the entire P&L into a 12-month trend so you can see whether the year is heading the right direction before the books are closed.
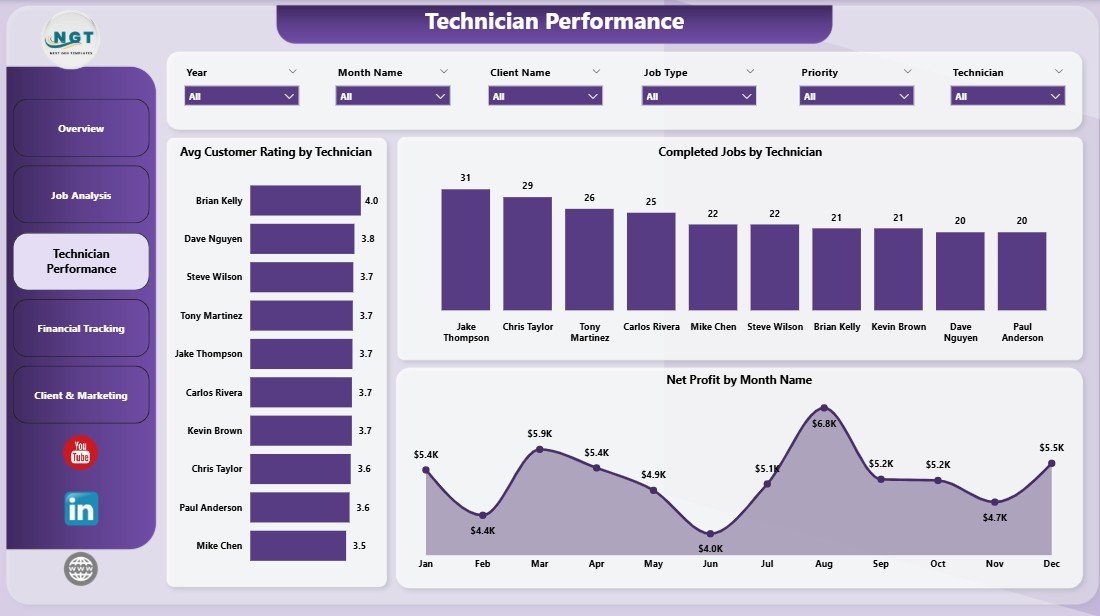
Technician Performance
Page 4 — Financial Tracking
The Financial Tracking page is where you find the money leaks. Total Revenue and Total Material Cost by Job Type tells you which categories are margin-rich and which need repricing or to be dropped from the bid sheet. Profit Margin by Referral Source ties every marketing channel to actual delivered profit — if Google LSA brings in 40% of jobs but only 22% of profit margin, you have a pricing problem on those leads. Total Revenue by Payment Status (Paid / Pending / Overdue) is your weekly AR call list — anything in Overdue gets a Tuesday-morning follow-up.
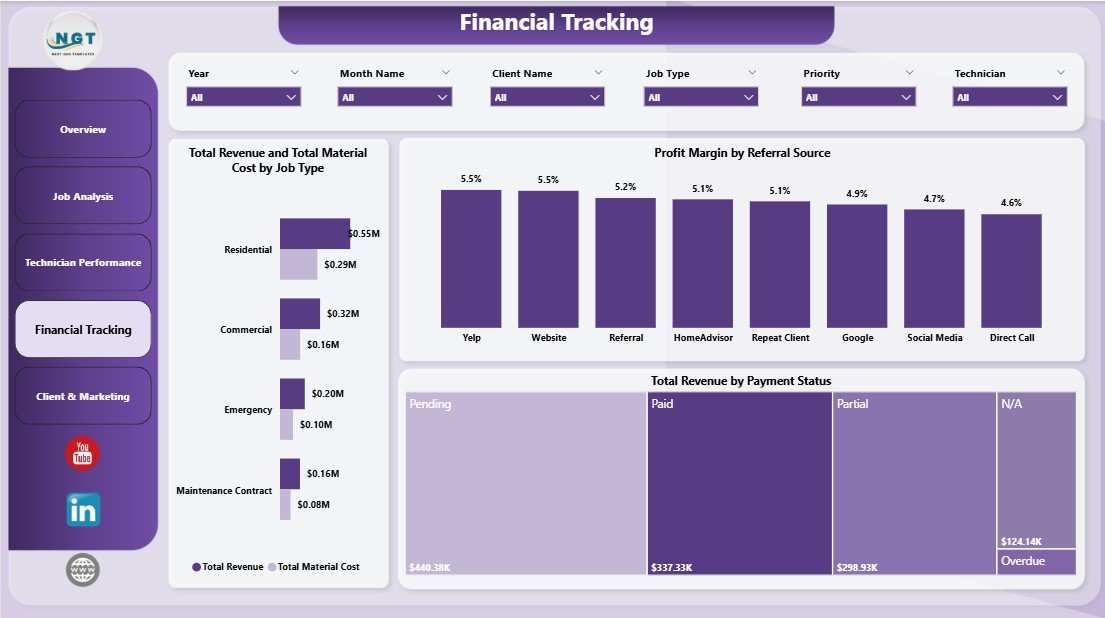
Financial Tracking
Page 5 — Client & Marketing
The Client & Marketing page closes the loop on Page 4. Total Revenue by Referral Source helps you decide whether the Yelp ad, the Google LSA, or Nextdoor referrals are actually paying off in absolute revenue terms. Total Labor Cost by Location shows where labor cost is stacking up across your service territories. Total Labor Cost by Month Name is the budget reality-check against the Net Profit trend on Page 3 — if labor cost is climbing faster than revenue, the next bid sheet needs a price adjustment.
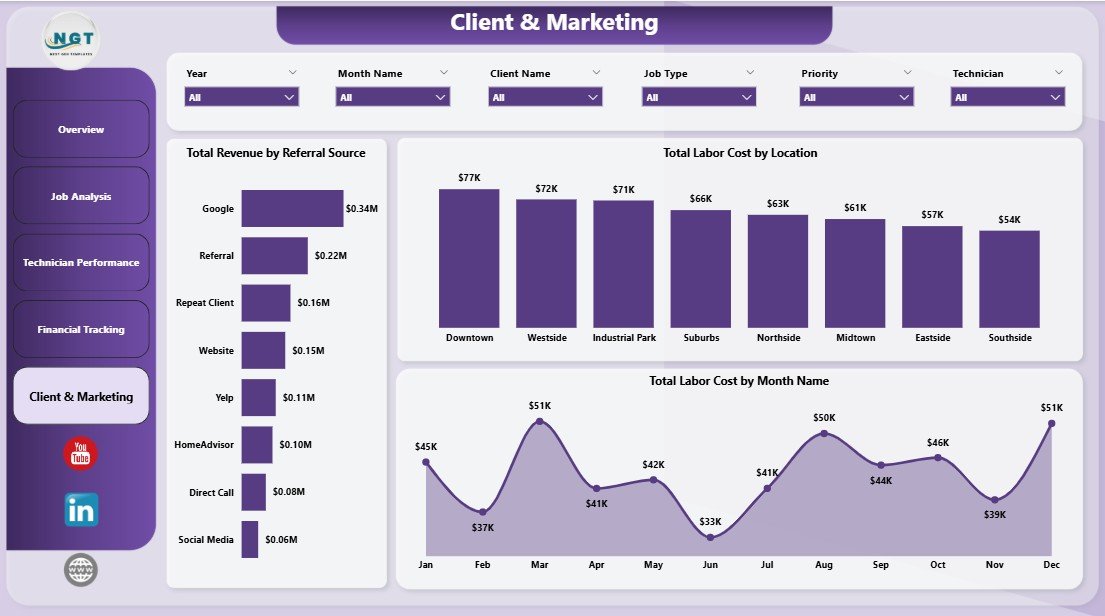
Client & Marketing
Plumbing Contractor Dashboard in Power BI vs. Tableau / Qlik vs. ServiceTitan / Jobber — Feature Comparison
| Feature | Plumbing Contractor Dashboard in Power BI | Tableau / Qlik Equivalent | ServiceTitan / Jobber / Housecall Pro |
|---|---|---|---|
| Cost | $17.99 one-time | $70–$120 / user / month + build cost | $49–$398 / user / month |
| Platform | Free Power BI Desktop | Tableau Desktop / Qlik Sense | Cloud SaaS |
| Setup time | Under 10 minutes | Days to weeks (consultant build) | 2–6 weeks onboarding |
| Customizable visuals | ✅ Fully editable DAX & visuals | ✅ Fully editable | Limited to vendor schema |
| Cross-page slicers | ✅ Native sync slicers | ✅ Filter actions | ✅ Built-in |
| Per-user fees | None — share the .pbix | $70–$120 per user / month | $49–$398 per technician / month |
| Year-1 cost at 5 users | $17.99 | $4,200–$7,200+ | $2,940–$23,880 |
| Mobile dispatch app | ❌ Power BI mobile (read-only) | ❌ Read-only mobile | ✅ Native iOS/Android |
For plumbing contractors who want owner-level Power BI visibility into revenue, technician performance, profit margin, and AR — without paying $49–$398 per technician per month for a full field-service platform — the Plumbing Contractor Dashboard in Power BI sits in the sweet spot.
Who Should Use This Template
Perfect for:
- Independent plumbing contractors and 2–25 technician shops who already log jobs in Excel, CSV, or QuickBooks
- Plumbing business owners who want a Power BI weekly KPI review without hiring a BI consultant
- Office managers and dispatchers who need to slice job data by technician, location, service category, or priority
- Trades-business consultants who need a client-ready Power BI reporting template for plumbing engagements
Not a fit if:
- You run a multi-location plumbing franchise and need real-time mobile dispatch with GPS routing
- You need integrated invoicing, payments, and customer messaging — that is what ServiceTitan and Jobber are built for
- You have never tracked job-level data and have no historical records to load into the Power BI model
Real-World Use Cases
Mark runs an 8-technician plumbing shop in Phoenix. He used to spend Sunday evenings building a job summary in Excel to brief his lead tech on Monday morning. With the Plumbing Contractor Dashboard in Power BI, he points the .pbix at his QuickBooks export, clicks Refresh, and walks into the Monday huddle with the Technician Performance page on a tablet. The Avg Customer Rating chart became the single most useful tool in his quarterly bonus conversation — every tech now knows exactly where they stand. Total time from raw export to printed brief: about 3 minutes.
Lisa is the office manager at a 3-tech residential plumbing company in Denver. She needed a way to flag unpaid invoices without buying ServiceTitan at $300/month per seat. The Financial Tracking page’s “Total Revenue by Payment Status” visual now drives her Tuesday-morning AR follow-up call list, and the “Profit Margin by Referral Source” chart helped the owner kill a $400/month Yelp ad spend that wasn’t pulling its weight. Savings paid for the dashboard 22 times over in the first month alone.
Raj is an independent consultant for trades businesses across Texas. He uses the Plumbing Contractor Dashboard as a 30-minute discovery deliverable for new plumbing clients. He loads the client’s last 6 months of jobs into the Power BI data model, exports the Overview and Technician Performance pages to PDF, and the conversation about where to invest moves much faster. He charges $750 for the discovery, the dashboard cost him $17.99 — the math is good.
Advantages of the Plumbing Contractor Dashboard in Power BI
- Zero subscription: $17.99 one-time vs. $588–$4,776 per technician per year for ServiceTitan-tier platforms.
- Owner-level visibility in 10 minutes: point Get Data at your job log, refresh, done.
- No vendor lock-in: it’s a .pbix file. You own it. Edit any DAX measure, add any field, change any visual, share it with your accountant.
- Cross-page slicers: select a technician once and every page filters in sync — much faster than Excel slicers per sheet.
- Free Power BI Desktop: no Power BI Pro license required for local use or PDF export.
- Star-schema data model: every visual auto-rebuilds on Refresh. No broken formulas when you add rows or columns.
Opportunities for Improvement
To be balanced — this dashboard is a reporting layer, not an operations platform. There are a few things it doesn’t do, and it’s worth being upfront about them:
- No mobile dispatch app. Power BI mobile is read-only. If you need GPS-routed job assignment with live status updates from techs in the field, you need ServiceTitan, Jobber, or Housecall Pro. The dashboard reports on jobs after they’re logged; it doesn’t run them.
- No integrated invoicing or payments. You’ll still create invoices in QuickBooks (or your AR tool of choice) and log payment status into your data source manually. The dashboard reads what you record; it doesn’t generate or collect.
- Power BI Desktop is Windows-only. Mac users can view published reports through the Power BI web service or mobile app, but editing requires a Windows machine. For Mac-native editing, use the Plumbing Contractor Dashboard in Excel or Google Sheets instead.
- Manual data refresh on Desktop. To get scheduled refresh, you’ll need a Power BI Pro license and to publish to Power BI Service with a gateway. Local-only use means clicking Refresh manually before each review cycle.
Best Practices
- Update weekly, not monthly: the AR follow-up workflow only works if Payment Status is current within 7 days.
- Standardize source columns: the data model expects technician, service category, job type, hours, revenue, material cost, payment status, customer rating, location, and referral source. Renaming columns breaks the model.
- Add custom fields at the right of the source dataset, refresh the Power BI model, and drag the new field into any visual via the Fields pane. Don’t insert columns in the middle.
- Export the Overview and Financial Tracking pages to PDF as your monthly investor or owner report — the layout is presentation-ready.
- Use cross-page slicers for client meetings: filter to one technician or service category to make the conversation specific.
- Save monthly snapshots of the .pbix file. Year-over-year trend analysis is much easier when you have monthly archives.
Explore Relevant Templates
If you’re a trades or field-service business, these templates from our Power BI Dashboard library pair naturally with the Plumbing Contractor Dashboard in Power BI:
- 👉 Plumbing Contractor Dashboard in Excel — same template, Excel platform. Use this if your office team prefers Excel pivots and slicers over the Power BI data model.
- 👉 HVAC Service Dashboard in Power BI — sister trade. Same DAX architecture, different equipment categories. Useful if you also offer HVAC service or partner with one.
- 👉 Moving Company Dashboard in Power BI — another field-service vertical with similar revenue, crew, and customer rating analytics.
- 👉 Laundromat Dashboard in Power BI — small-business operations dashboard if you run an adjacent service business.
- 👉 Car Dealership Dashboard in Power BI — adjacent SMB Power BI dashboard with revenue, salesperson, and customer analysis pages.
Frequently Asked Questions
What KPIs does the Plumbing Contractor Dashboard in Power BI track?
The Plumbing Contractor Dashboard in Power BI tracks 5 headline KPIs on the Overview page — Total Revenue, Total Material Cost, Total Labor Cost, Total Jobs, and Net Profit — plus 12 supporting visuals across Job Analysis, Technician Performance, Financial Tracking, and Client & Marketing pages. All metrics update automatically when you refresh the data model with your own job log.
Do I need Power BI Pro or a paid Microsoft license?
No. The Plumbing Contractor Dashboard in Power BI runs in Power BI Desktop, which is free from Microsoft. You only need Power BI Pro if you want to publish reports to the Power BI Service for browser-based team sharing. Local use, PDF export, and all 5 report pages work fully in the free Desktop version on Windows.
How does this compare to ServiceTitan or Jobber?
ServiceTitan and Jobber are full-stack field-service platforms with mobile dispatch, payments, CRM, and customer messaging at $49–$398 per technician per month. The Plumbing Contractor Dashboard in Power BI is a $17.99 one-time analytics layer for plumbing owners who already track jobs elsewhere and want a clean weekly KPI view they fully own and customize.
How long does setup take?
Setup takes under 10 minutes. Open the .pbix in Power BI Desktop, point Home → Get Data at your existing job log (Excel, CSV, or SQL), and click Refresh. All 5 report pages, KPI cards, and visuals rebuild automatically against your live data — no DAX edits or visual changes required.
Can I add custom fields to the Plumbing Contractor Dashboard?
Yes. Add new columns to your source dataset, refresh the Power BI model, and drag the new fields into any visual via the Fields pane. The Plumbing Contractor Dashboard in Power BI is fully customizable — every DAX measure, visual, and slicer is editable in Power BI Desktop.
Is this a one-time purchase or a subscription?
One-time payment of $17.99. You get instant download, full .pbix file ownership, lifetime access, and no per-user fees. There is no subscription, no recurring charges, and no expiration date on the Plumbing Contractor Dashboard in Power BI.
Does this work on Mac?
Power BI Desktop runs on Windows only, so editing the .pbix requires a Windows machine. Mac users can view published reports through the Power BI web service or mobile app once the dashboard is published from a Windows desktop. For Mac-native editing of the same dashboard logic, see the Plumbing Contractor Dashboard in Excel.
About the Author
Built by PK — Microsoft Certified Professional with 15+ years of Excel, Google Sheets, and Power BI experience. Founder of NextGenTemplates, reaching 300K+ subscribers across YouTube channels. Every template is hand-built and tested before release.
Conclusion
The Plumbing Contractor Dashboard in Power BI gives plumbing business owners and operations managers a production-ready Power BI analytics layer for a one-time $17.99 — a fraction of what ServiceTitan, Jobber, or a custom Tableau build would cost in year one. Five report pages, 5 KPIs, 12 DAX-driven visuals, cross-page slicers, and full data ownership, all running in free Power BI Desktop. It’s not a dispatch app and it doesn’t replace your invoicing tool — but for the weekly Monday-morning KPI review, the monthly tech 1-on-1, and the quarterly marketing-budget conversation, it’s the cleanest Power BI tool we’ve built for the trade.
👉 Click here to Purchase the Plumbing Contractor Dashboard in Power BI
✅ Instant download · One-time payment · No subscription · Lifetime access
🎥 For Power BI video tutorials, visit Youtube.com/@PK-AnExcelExpert.
📅 Last updated: April 2026