If you run a contract manufacturing operation, you already know the pain: 14 spreadsheets for 14 clients, weekly status decks nobody reads, and a CFO asking why last quarter’s margin looked better on paper than in the bank. The Contract Manufacturing Dashboard in Power BI replaces that mess with one refreshable model — 5 pages, 5 headline KPIs, 13+ interactive visuals, and cross-page slicers that filter every view the moment you click.
📊 The dashboard tracks Total Qty Produced, Total Production Cost, Total Defects, Total Contracts, and Total Contract Value at the top level, then drills into Production Analysis, Client Performance, Quality & Delivery, and Financial Overview pages. Setup takes under 10 minutes once you point Power Query at your data source. Built for OEM manufacturers, private-label producers, and mid-market job shops who do not want to pay $179–$399 per month for Katana or MRPeasy.

Key Features of Contract Manufacturing Dashboard in Power BI
This Power BI dashboard tracks 5 headline KPIs across 5 analytical pages with 13+ pre-built visuals. Every visual is interactive, every slicer is cross-page, and every DAX measure is unlocked for editing. You can connect it to 100+ native Power BI data sources including SQL Server, Azure SQL, Dynamics 365, SAP, Oracle, Snowflake, and REST APIs — or keep it simple with an Excel or CSV source. Publish to Power BI Service and your team sees the same numbers, updated on the refresh schedule you set.
Unlike SaaS manufacturing platforms, this template is a one-time $17.99 purchase with fully editable DAX and unlimited viewers via Power BI Service — no per-user licensing trap.
Dashboard Pages Explanation
1. Overview Page
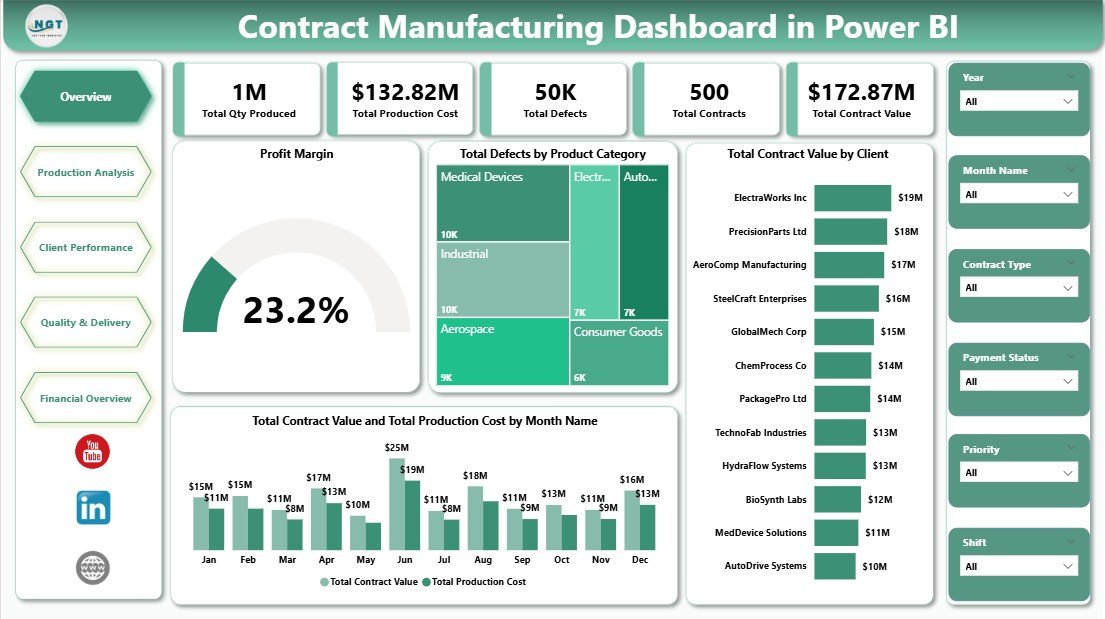
The landing page is the executive view. Five KPI cards at the top — Total Qty Produced, Total Production Cost, Total Defects, Total Contracts, and Total Contract Value — summarise the state of the plant in one glance. Below the cards, a Profit Margin visual gives the single-number read on contract profitability. Total Defects by Product Category highlights which SKUs are eating into quality targets. Total Contract Value by Client exposes concentration risk across top accounts. The Total Contract Value and Total Production Cost by Month Name combo chart overlays revenue against cost of goods so margin trends are obvious month over month. Slicers on the left filter all visuals instantly.
Overview Page
2. Production Analysis
This page is for production managers and shift supervisors. Total Qty Produced by Shift tells you whether the day, evening, or night shift is carrying the plant — useful when incentive bonuses are on the table. Total Contracts by Client ranks accounts by volume so the top 5 get the attention they deserve. Total Contracts by Priority separates rush orders from standard and deferred ones, which is the single most useful view when a planner is sequencing the floor for the coming week.
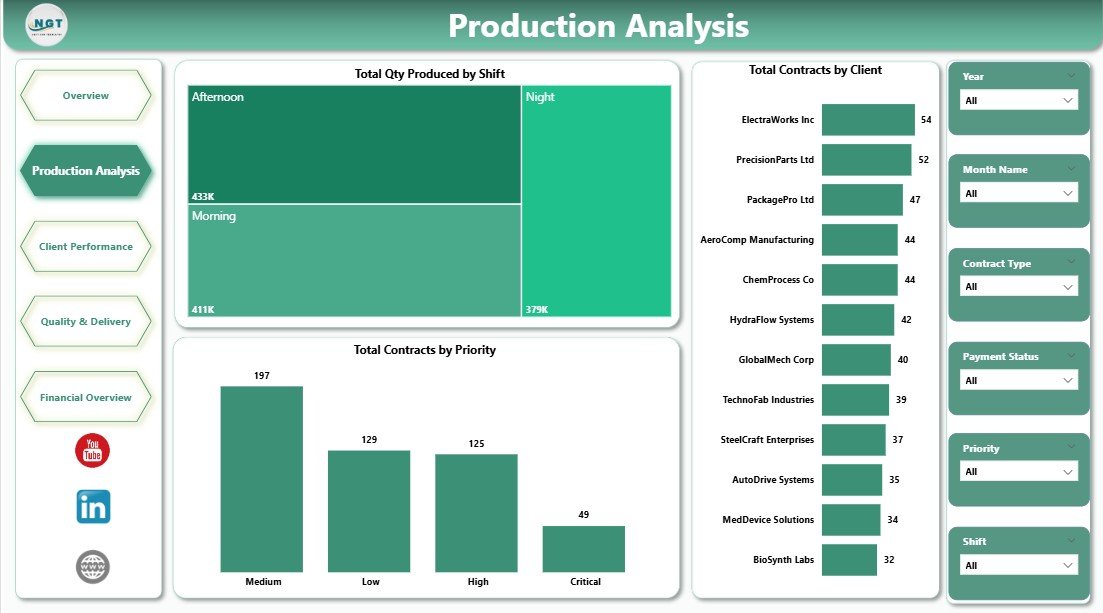
Production Analysis
3. Client Performance
Built for the customer scorecard conversation. Total Contract Value by Contract Type breaks the book down into Fixed Price, Cost Plus, and Time & Material — critical when negotiating renewals because cost-plus deals behave differently to fixed-price ones. Avg Quality Score by Client quietly tells you which accounts are getting the cleanest output from the floor, and which are not. Avg Quality Score by Product Category surfaces the category-level quality pattern that usually hides inside the client view.
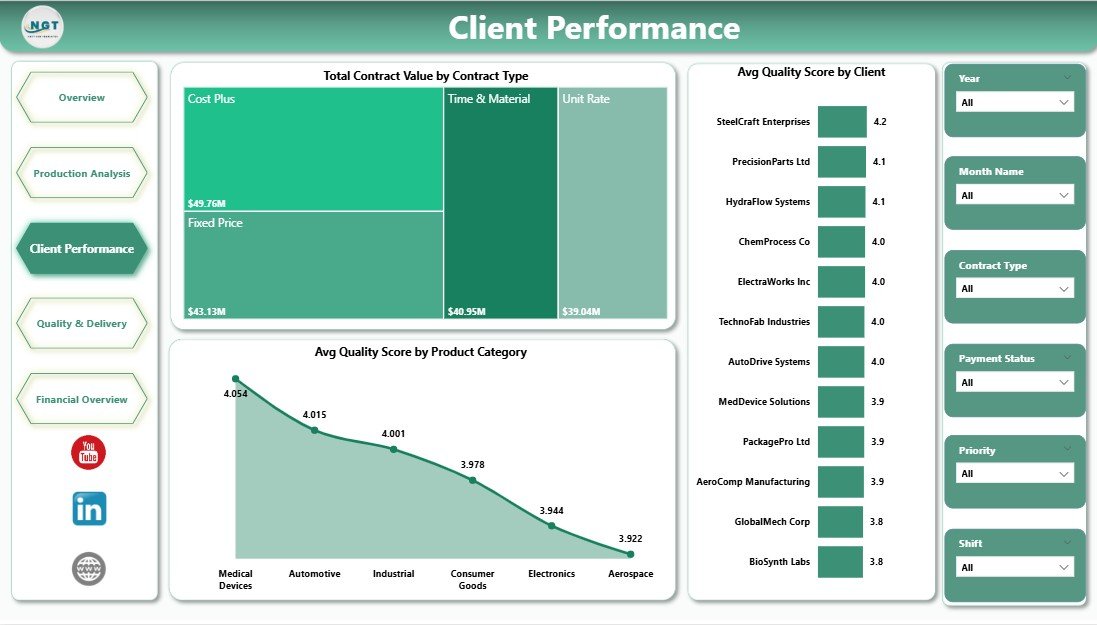
Client Performance
4. Quality and Delivery
The plant-floor and logistics view. Total Defects by Manufacturing Line pinpoints underperforming lines without arguing about who is to blame — the data does the talking. Total Contracts by Delivery Status splits the book into On-Time, Delayed, In-Transit, and Completed shipments so the logistics coordinator has a single place to check before the Monday stand-up. Net Profit by Month Name closes the loop by showing how quality and delivery performance flow through to the P&L.
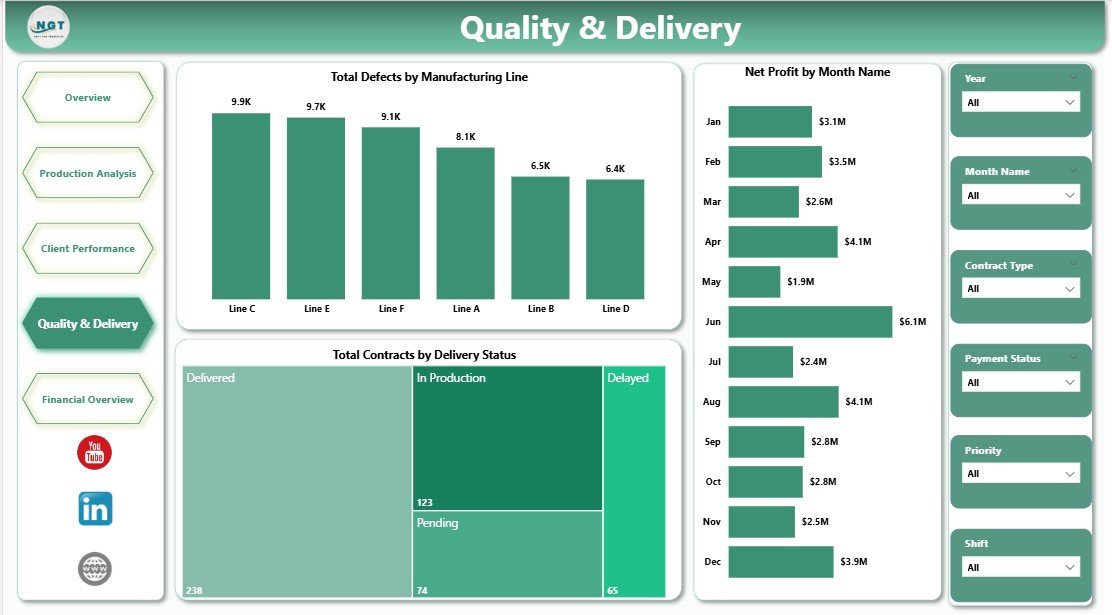
Quality and Delivery
5. Financial Overview
The CFO’s page. Total Contract Value and Total Production Cost by Year gives the multi-year trend you cannot get from a single spreadsheet. Net Profit by Client ranks accounts by contribution margin — the 80/20 cut that drives the next round of pricing renegotiations. Total Contract Value and Total Production Cost by Product Category surfaces which SKU families are genuinely margin accretive versus dilutive. Filter by year and watch the story unfold.
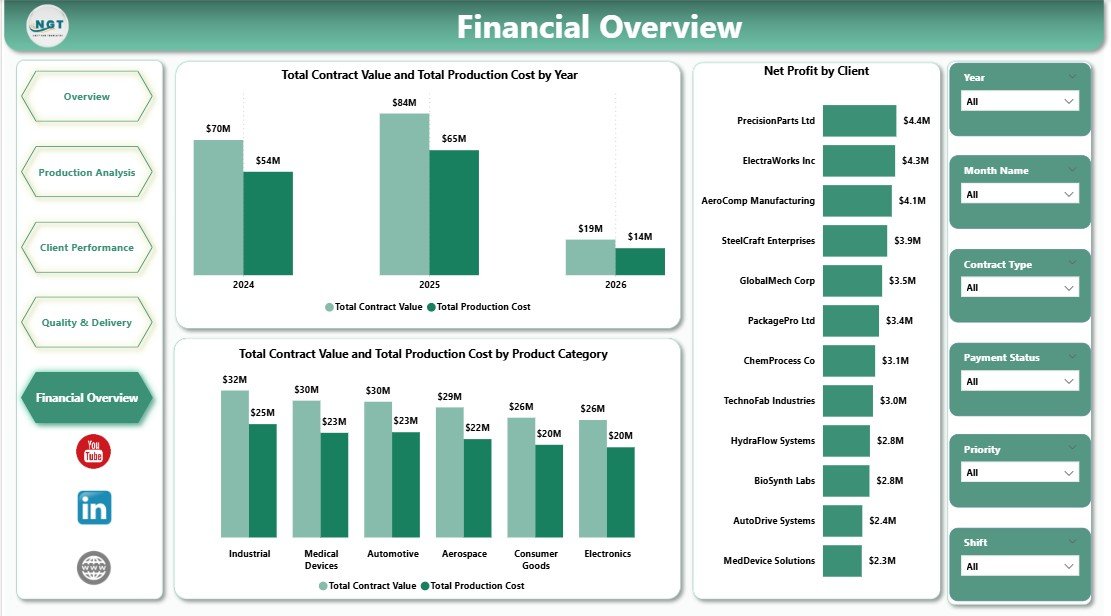
Financial Overview
Contract Manufacturing Dashboard in Power BI vs. Excel Dashboard vs. Paid SaaS — Feature Comparison
| Feature | Contract Manufacturing Dashboard in Power BI | Excel Manufacturing Dashboard | Paid SaaS (Katana / MRPeasy / NetSuite) |
|---|---|---|---|
| Cost | $17.99 one-time | $10–20 one-time | $179–999 / user / month |
| Platform | Power BI Desktop (free) | Microsoft Excel | Proprietary SaaS |
| Setup time | Under 10 minutes | Under 10 minutes | 2–8 weeks |
| Cross-page slicers | ✅ Native | Pivot slicer workaround | ✅ |
| Row-level security for clients | ✅ Power BI Service | ❌ | ✅ |
| Mobile access | ✅ Power BI mobile app | Limited (Excel mobile) | ✅ |
| Refresh from SQL / Azure / API | ✅ Native connectors | Power Query required | ✅ |
| Customizable DAX measures | ✅ Fully editable | Formulas only | ❌ Locked |
| Year-1 cost at 5 users | $17.99 | $10–20 | $10,700–$60,000 |
For contract manufacturers that want analytical depth without paying Katana or NetSuite prices, this Power BI dashboard sits in the sweet spot.
Who Should Use This Template
Perfect for:
- Contract manufacturing plant managers running 20–500 active OEM contracts per quarter
- Operations directors at private-label and white-label producers who need a single pane of glass across clients, lines, and shifts
- CFOs and controllers at mid-market job shops chasing contract-level margin visibility without SAP pricing
- Production planners sequencing rush vs standard priority contracts across multiple lines
- Small-to-mid OEM suppliers replacing ad-hoc Excel reports with a single refreshable Power BI model
Not a fit if:
- You run 10,000+ SKU enterprise manufacturing with SAP S/4HANA-grade ERP needs
- You are a process manufacturer (chemicals, pharma) requiring batch genealogy and 21 CFR Part 11 compliance
- Your team does not use Windows or Mac — Power BI Desktop is Windows-first (Mac users need Power BI Service in browser)
Real-World Use Cases
Raj runs a 3-line contract electronics plant in Pune serving 14 OEM clients. He uses this dashboard to track contract value against production cost by month, identify which clients have the highest defect rates, and publish the dashboard to Power BI Service so his shift supervisors see the same KPIs on the plant-floor tablet. Before the dashboard, the same view took his finance analyst 6 hours every Monday. Now it refreshes automatically at 6 AM.
Elena is the COO of a private-label cosmetics manufacturer in New Jersey producing for 22 indie beauty brands. She uses the Client Performance page to review Avg Quality Score by Client and Contract Value by Contract Type in every quarterly business review. Last quarter she spotted margin erosion on three cost-plus deals a full month before renewal conversations started — enough lead time to reprice without drama.
Daniel is a controller at a custom metal components job shop in Cleveland. He refreshes the Financial Overview page every Monday morning, comparing Net Profit by Client and year-over-year Contract Value vs Production Cost. The 80/20 cut surfaces the same 4 accounts driving 70% of contribution margin every quarter — which is what his annual pricing renegotiations are built around.
Advantages of Contract Manufacturing Dashboard in Power BI
💡 One-time $17.99 vs $10,700+/year for SaaS — The cost delta over 3 years is roughly the price of a second plant tablet.
💡 Multi-user access without per-user fees — Publish to Power BI Service once; every viewer with Power BI Free or Pro can see the dashboard on desktop, mobile, or embedded in Teams.
💡 DAX measures are editable — Add Defect Rate %, Throughput per Shift, OEE, or any other measure your ops team wants without asking a vendor for a feature request.
💡 Refreshes from live data — Schedule a nightly refresh from your ERP (SAP, Dynamics 365, NetSuite) or database. No copy-paste, no stale numbers.
💡 Works with the tools you already pay for — Microsoft 365, Azure, Teams integration is native.
Opportunities for Improvement
The dashboard is built for contract manufacturing specifically — it does not cover MRP (Material Requirements Planning) or shop-floor control (SFC) workflows that a full MES would provide. If your operation needs real-time WIP tracking to the work-center level, this dashboard is an analytics layer on top, not a replacement for MES. You will also want to extend the data model if you need supplier performance metrics (on-time-in-full from vendors), which the current schema does not include by default.
Best Practices
🔹 Set up incremental refresh on the contracts table once you exceed 500K rows — Power BI’s incremental refresh policy will keep performance tight.
🔹 Enable Row-Level Security (RLS) in Power BI Service if you want to share the dashboard with individual clients — each client sees only their own rows.
🔹 Create a shared Power BI theme file so brand colors, fonts, and chart defaults stay consistent when you add new pages.
🔹 Document your DAX measures with descriptions so the next analyst who inherits the model can actually read it.
🔹 Use bookmarks to save different slicer combinations (Top 10 clients, Q4 only, Night Shift only) for fast executive reviews.
Explore Relevant Templates
💎 Save 40% — Get the Manufacturing Excellence Bundle — 8 Premium Templates (Excel + Power BI) for $79.99 instead of buying individually.
Also available as: Contract Manufacturing Dashboard in Excel — same analytical content rebuilt with pivot tables and slicers for Excel-first teams.
Related picks from our Power BI catalog:
- Textiles & Apparel Manufacturing Dashboard in Power BI
- Preventive Maintenance Dashboard in Power BI
- Moving Company Dashboard in Power BI
- Succession Planning KPI Dashboard in Power BI
Browse more Power BI Dashboard Templates and the full Manufacturing Templates catalog.
Frequently Asked Questions
What KPIs does the Contract Manufacturing Dashboard in Power BI track?
The Contract Manufacturing Dashboard in Power BI tracks 5 headline KPIs — Total Qty Produced, Total Production Cost, Total Defects, Total Contracts, and Total Contract Value — plus derived measures including Profit Margin, Avg Quality Score, and Net Profit by Client across 13+ interactive visuals.
How long does it take to set up the Contract Manufacturing Dashboard in Power BI?
Under 10 minutes for most users. Open the .pbix file in Power BI Desktop, point Power Query to your contracts data source, click Refresh, and every page updates automatically. No DAX knowledge is required for basic use — only if you want to add custom measures.
How does the Contract Manufacturing Dashboard in Power BI compare to Katana MRP or MRPeasy?
Katana and MRPeasy start at $179–$399 per month per company and lock you into their reporting layer. The Contract Manufacturing Dashboard in Power BI is a one-time $17.99 purchase with fully editable DAX measures, unlimited viewers via Power BI Service, and no subscription lock-in.
Can I connect the Contract Manufacturing Dashboard in Power BI to my live ERP data?
Yes. Power BI supports 100+ native connectors including SQL Server, Azure SQL, Dynamics 365, SAP, Oracle, Snowflake, and REST APIs. Change the source in Power Query Editor once, then scheduled refresh in Power BI Service keeps the dashboard current without manual intervention.
Is the Contract Manufacturing Dashboard in Power BI fully editable?
Yes. Every visual, slicer, color, theme, and DAX measure is unlocked. You can rename fields, add pages, restyle the theme to match your brand, or extend the model with additional tables and relationships — no restrictions.
Do I need a paid Power BI license to use it?
No — Power BI Desktop is free from Microsoft. A Power BI Pro or Premium license is only required if you want to publish to Power BI Service for team sharing or scheduled cloud refresh. For single-user desktop use, no paid license is needed.
Is this the same as the Contract Manufacturing Dashboard in Excel?
The analytical content is aligned but the Power BI version adds cross-page slicers, editable DAX measures, row-level security, mobile app support, and scheduled refresh. The Excel version is better if your team lives in Excel; this Power BI build is better for multi-user plant rollouts with live data.
About the Author
Built by PK — Microsoft Certified Professional with 15+ years of Excel, Google Sheets, and Power BI experience. Founder of NextGenTemplates, reaching 300K+ subscribers across YouTube channels (@PK-AnExcelExpert, @NextGenTemplates). Every template is hand-built and tested before release.
Conclusion
The Contract Manufacturing Dashboard in Power BI gives contract manufacturers a single refreshable view across 5 KPIs, 5 pages, and 13+ visuals — the kind of visibility that used to cost $10,700+ per year in SaaS fees. For $17.99 one-time, you get fully editable DAX, unlimited Power BI Service viewers, and a model that refreshes straight from your ERP.
👉 Click here to Purchase the Contract Manufacturing Dashboard in Power BI
✅ Instant download · One-time payment · No subscription · Lifetime access
🎥 For step-by-step video tutorials visit Youtube.com/@PK-AnExcelExpert
📅 Last updated: April 2026