Hotel Revenue RevPAR Dashboard in Power BI is a ready-to-use reporting template for hotel owners, revenue managers, finance analysts, F&B managers, regional directors, and hospitality consultants. Hotels depend on measures such as room revenue, occupancy, operating cost, F&B revenue, profit margin, booking channel performance, and RevPAR-style capacity analysis to make faster pricing and operations decisions. When those numbers are scattered across exports, spreadsheets, and property reports, managers lose time before every review meeting.
This Power BI dashboard gives you five report pages for hotel revenue analysis: Overview, Revenue Trends, Property Mix, Guest Segment, and Room Analysis. You can open the PBIX file in Power BI Desktop, replace the sample data with your own structured hotel data, refresh the report, and start reviewing revenue, cost, occupancy, guest mix, rate plans, room types, and hotel-level performance without building every visual from scratch.
Click to Buy Hotel Revenue RevPAR Dashboard in Power BI
Key Features of Hotel Revenue RevPAR Dashboard in Power BI
- Five Power BI pages: Overview, Revenue Trends, Property Mix, Guest Segment, and Room Analysis.
- Executive cards: Total Room Revenue, Total Other Revenue, Total Operating Cost, Total Hotel Revenue, and Total F&B Revenue.
- Revenue trend views: Analyze F&B revenue by quarter, gross profit by month, and gross profit by hotel.
- Property mix analysis: Compare hotel revenue by property type and operating cost by region or guest segment.
- Guest segment review: Track occupancy rate by booking channel, profit margin by guest segment, and room revenue by rate plan.
- Room analysis: Review occupancy by property type, room revenue by room type, and available rooms by hotel.
- Interactive slicers: Filter the report quickly during revenue, operations, finance, and ownership meetings.
- Editable PBIX file: Customize visuals, measures, report pages, source connections, labels, and colors in Power BI Desktop.
Dashboard Pages Explanation
1 – Overview Page
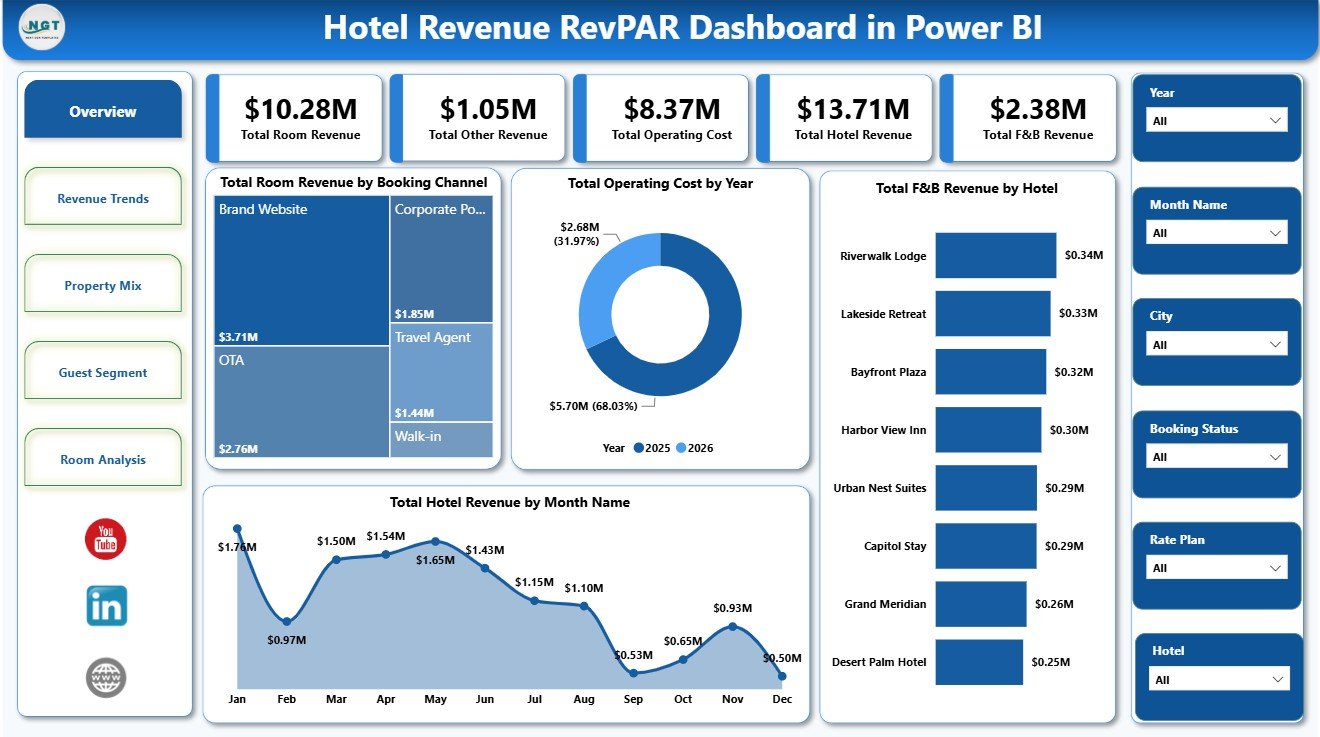
The Overview page is the executive summary of the report. The top cards show Total Room Revenue, Total Other Revenue, Total Operating Cost, Total Hotel Revenue, and Total F&B Revenue, so users can understand the major revenue and cost numbers before moving into detailed pages.
Total Room Revenue by Booking Channel: This chart compares room revenue across booking channels such as direct, OTA, corporate, agent, or partner sources. It helps revenue managers see which channels contribute the most room income.
Total Operating Cost by Year: This chart shows how operating cost changes by year. It helps finance teams review whether cost pressure is rising and whether hotel performance needs a deeper expense review.
Total F&B Revenue by Hotel: This visual compares food and beverage revenue by hotel. It helps operators identify which properties are strongest in restaurant, banquet, and service revenue.
Total Hotel Revenue by Month Name: This chart tracks hotel revenue across months. It helps teams identify seasonality, peak revenue periods, and months where pricing or marketing support may be needed.
2 – Revenue Trends
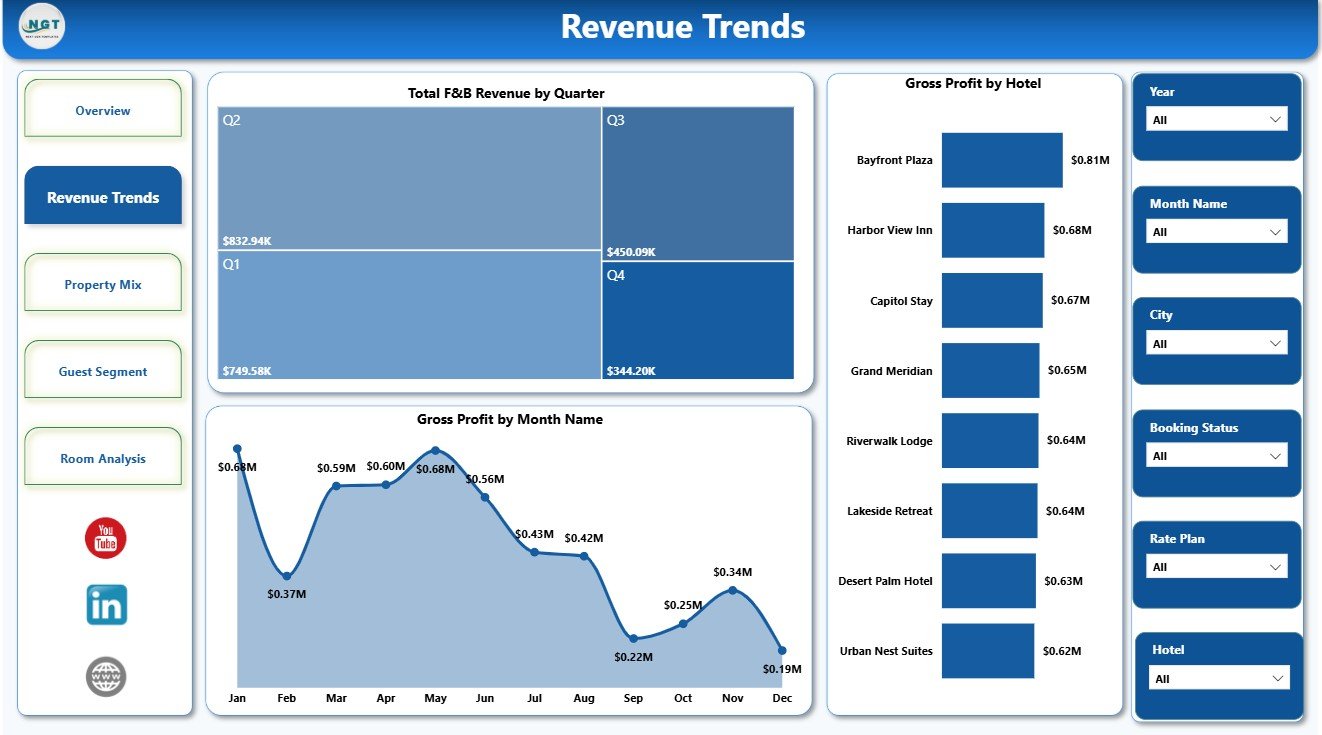
The Revenue Trends page is built for financial movement analysis across quarters, months, and hotels. It helps hotel finance and revenue teams understand how F&B revenue and gross profit are changing over time and across properties.
Total F&B Revenue by Quarter: This chart compares F&B revenue by quarter. It is useful for seasonal restaurant planning, event revenue review, banquet performance, and quarterly owner reporting.
Gross Profit by Month Name: This chart tracks gross profit month by month. It helps managers connect revenue generation with cost control and identify strong or weak profit periods.
Gross Profit by Hotel: This visual compares gross profit across hotel properties. It helps owners and regional managers see which hotels are contributing the most after direct costs.
3 – Property Mix
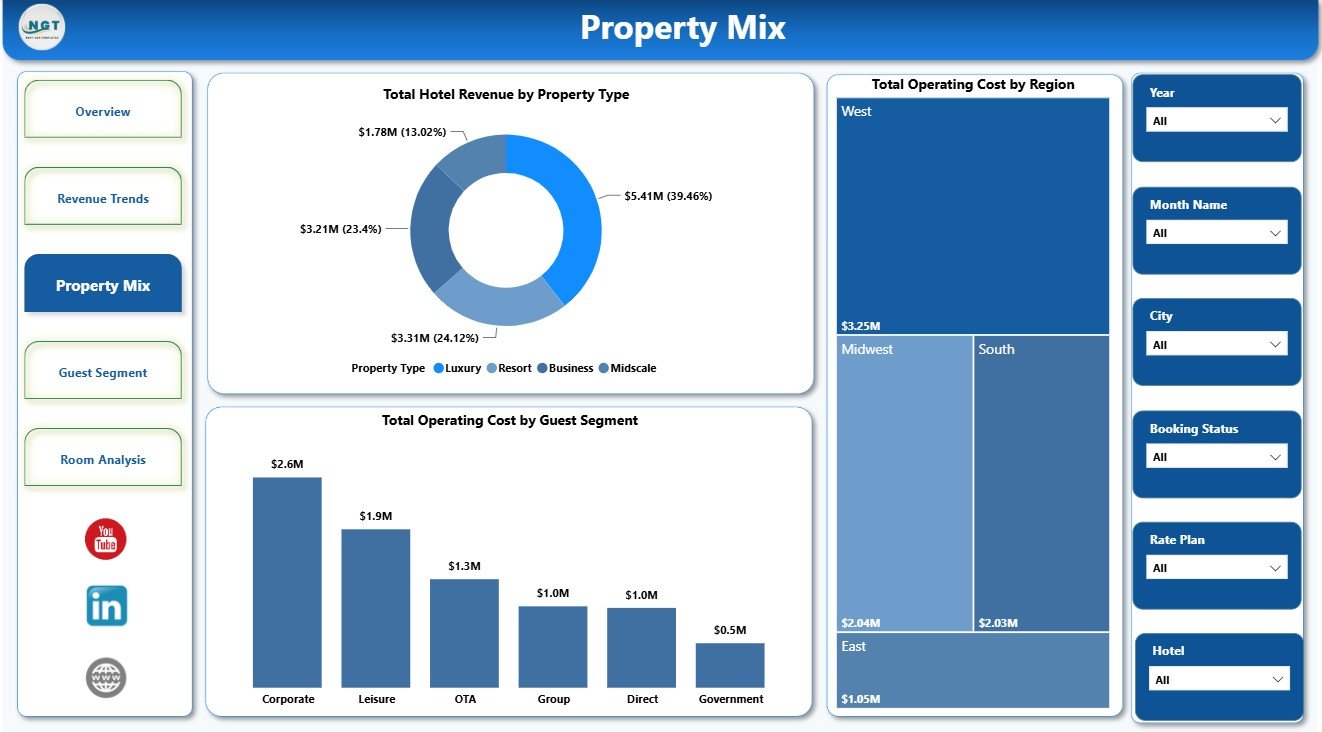
The Property Mix page explains how revenue and cost differ by property type, region, and guest segment. It is useful for hotel groups, boutique chains, regional operators, and analysts who compare performance across multiple property profiles.
Total Hotel Revenue by Property Type: This chart compares revenue by property category. It helps teams see whether resort, boutique, airport, business, extended stay, or other property types are generating stronger contribution.
Total Operating Cost by Region: This chart compares operating cost across regions. It helps finance teams identify regional cost patterns and review where cost control needs closer attention.
Total Operating Cost by Guest Segment: This chart links operating cost with guest segment. It helps managers understand whether corporate, leisure, group, or other guest types carry different cost profiles.
4 – Guest Segment
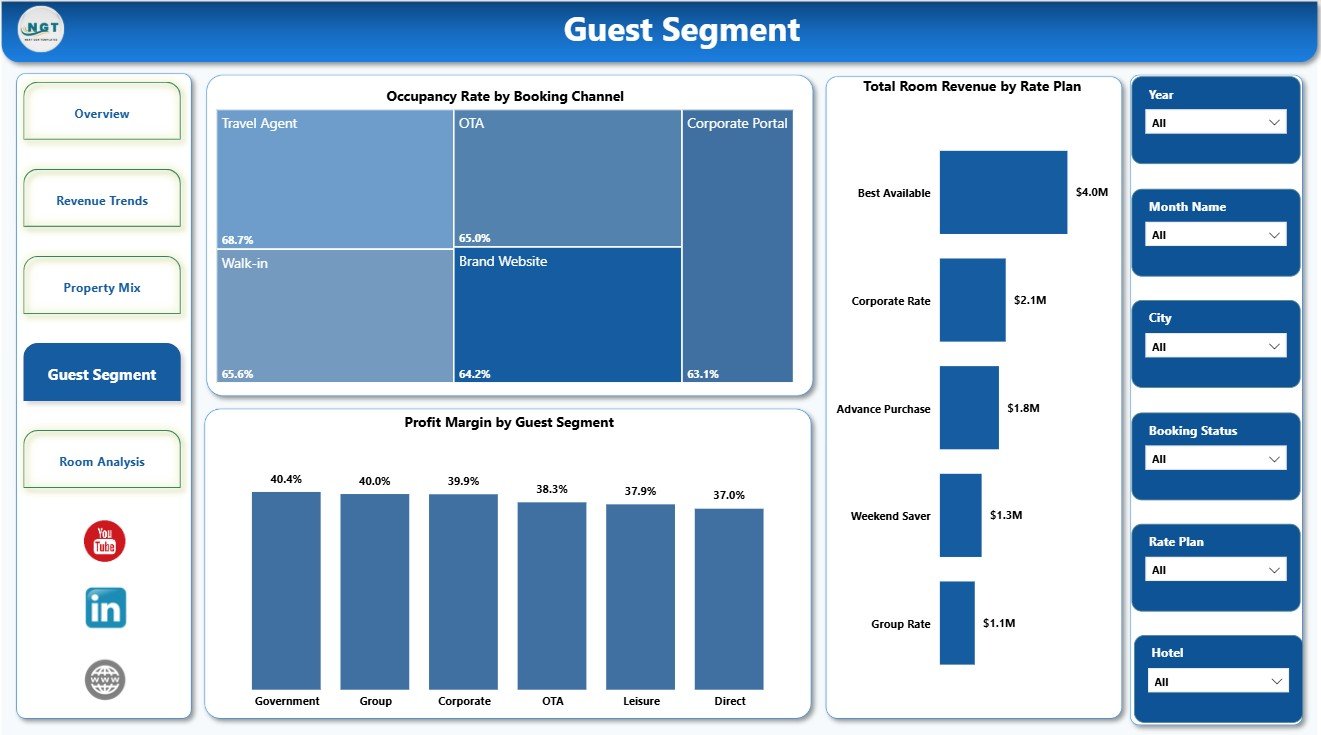
The Guest Segment page helps hotel teams understand demand quality by booking channel, guest type, and rate plan. It is useful for revenue strategy, marketing planning, and sales discussions.
Occupancy Rate by Booking Channel: This chart compares occupancy rate by booking channel. It helps managers identify which sources fill rooms more effectively and which channels may need pricing or promotional changes.
Profit Margin by Guest Segment: This chart compares profit margin by guest segment. It helps teams understand whether leisure, corporate, group, or other guests are producing healthier profitability.
Total Room Revenue by Rate Plan: This chart compares room revenue by rate plan. It helps revenue managers review package, corporate, flexible, promotional, and other rate-plan performance.
5 – Room Analysis
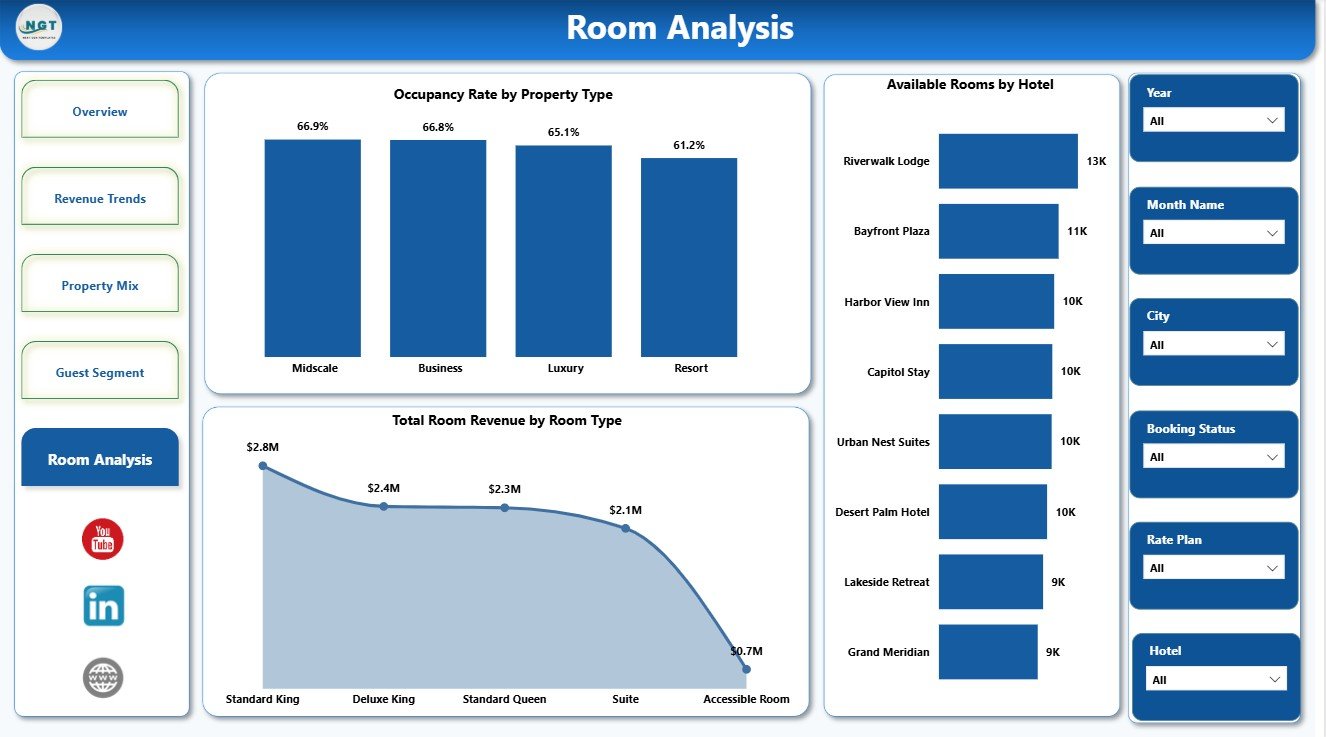
The Room Analysis page connects occupancy, room type performance, and available room capacity. It helps hotel teams review inventory use, room category demand, and property-level room availability.
Occupancy Rate by Property Type: This chart compares occupancy rate by property type. It helps teams identify where demand is strongest and where room capacity may be underused.
Total Room Revenue by Room Type: This visual compares room revenue by room category. It helps revenue managers understand which room types contribute the most to room revenue.
Available Rooms by Hotel: This chart compares available room counts by hotel. It helps operators review capacity distribution and support room inventory planning.
Hotel Revenue RevPAR Dashboard in Power BI vs. Tableau vs. Paid CRM/SaaS – Feature Comparison
| Feature | This Power BI dashboard | Tableau or Qlik alternative | Paid hotel SaaS |
|---|---|---|---|
| Cost | One-time template purchase | License cost plus dashboard build time | Monthly or annual subscription |
| Platform | Power BI Desktop and optional Power BI Service | Tableau or Qlik environment | Vendor cloud platform |
| Setup time | Open PBIX, replace data, refresh | Build model, calculations, and visuals | Implementation and onboarding |
| Real-time team collaboration | Available after publishing to Power BI Service | Available by plan | Usually included |
| Mobile access | Available through Power BI mobile/service | Available through vendor apps | Usually included |
| Customizable fields | Editable report pages, visuals, slicers, fields, and measures | Editable with BI skills | Often limited by vendor settings |
| Share with link | Possible through Power BI permissions | Possible through platform permissions | Usually login controlled |
| Year-1 cost at 5 users | Template price plus any Microsoft licensing | Usually higher once licenses and build time are included | Often hundreds or thousands |
| Hotel revenue analysis | Pre-built around room revenue, F&B, operating cost, occupancy, guest segment, property mix, and room analysis | Requires custom dashboard design | Depends on vendor reporting module |
Who Should Use This Template
This template is best for hotel owners, general managers, revenue managers, finance teams, F&B managers, regional directors, boutique hotel operators, hospitality analysts, and consultants who already have structured data and want a repeatable Power BI reporting layer.
It is not a hotel PMS, booking engine, channel manager, POS system, payment system, accounting system, or guest CRM. Use it after your hotel data has been exported, connected, cleaned, or prepared for Power BI.
Real-World Use Cases
Weekly revenue meeting: A revenue manager filters by booking channel, rate plan, room type, month, and guest segment to review room revenue and occupancy movement.
Monthly owner report: A hotel finance analyst uses Revenue Trends and Property Mix to explain hotel revenue, F&B revenue, operating cost, and gross profit movement.
Regional performance review: A regional director compares available rooms, occupancy rate, operating cost, and hotel revenue across properties and regions.
Advantages of Hotel Revenue RevPAR Dashboard in Power BI
- It gives hotel teams a ready report structure instead of a blank PBIX file.
- It connects revenue, cost, guest segment, room type, property type, booking channel, and time analysis in one dashboard.
- It can be refreshed when new hotel records are connected or added to the source data.
- It uses familiar Power BI functionality, so analysts can customize visuals and measures as reporting needs change.
- It supports recurring revenue reviews because the same metrics can be compared by month, quarter, hotel, region, property type, room type, and segment.
Opportunities for Improvement
- Add data validation before loading data so hotel names, regions, property types, booking channels, guest segments, room types, and rate plans remain consistent.
- Create clear KPI definitions for occupancy rate, RevPAR, room revenue, gross profit, operating cost, available rooms, and profit margin.
- Connect exported data from PMS, POS, booking, finance, or data warehouse sources when the team is ready for a more automated refresh workflow.
- Document any custom DAX measures added after purchase so future users understand the calculations.
Best Practices
- Keep source columns consistent with the sample structure before refreshing the report.
- Use the same hotel, region, booking channel, guest segment, rate plan, and room type names every month.
- Validate totals after replacing the sample data source with your own records.
- Use slicers during review meetings instead of duplicating pages for every segment.
- Publish to Power BI Service only after checking workspace permissions, privacy settings, and data governance requirements.
For Microsoft guidance, see Get started with Power BI Desktop.
Explore Relevant Templates
You can download the draft product here: Hotel Revenue RevPAR Dashboard in Power BI. You may also like Eco Lodges Dashboard in Power BI, Hospitality Dashboard in Power BI, Destination Management Companies Dashboard in Power BI, and Adventure Tourism Dashboard in Power BI.
Frequently Asked Questions
What is included in the Hotel Revenue RevPAR Dashboard in Power BI?
It includes five Power BI pages: Overview, Revenue Trends, Property Mix, Guest Segment, and Room Analysis, with KPI cards, slicers, and charts for revenue, cost, occupancy, room type, guest segment, booking channel, rate plan, hotel, property type, region, month, and quarter.
Do I need Power BI Desktop?
Yes. Power BI Desktop is required to open and edit the PBIX file. Power BI Service is optional if you want browser sharing, workspace access, or scheduled refresh.
Can I use my own hotel data?
Yes. Replace or connect the sample source with your structured hotel data, then refresh the report.
Can I customize the visuals?
Yes. You can edit report pages, fields, colors, labels, slicers, visuals, DAX measures, and data connections in Power BI Desktop.
Is this a property management system?
No. It is a reporting dashboard template, not a PMS, booking engine, POS, channel manager, payment tool, accounting system, or CRM.
Can I publish it online?
Yes. You can publish the report to Power BI Service if your Microsoft account, workspace permissions, and data governance rules support publishing.
About the Author
Built by PK – Microsoft Certified Professional with 15+ years of Excel, Google Sheets, and Power BI experience. Founder of NextGenTemplates, reaching 300K+ subscribers across YouTube channels. Every template is hand-built and tested before release.
Conclusion
The Hotel Revenue RevPAR Dashboard in Power BI gives hotel teams a practical way to review room revenue, other revenue, operating cost, total hotel revenue, F&B revenue, occupancy rate, profit margin, booking channels, rate plans, guest segments, property types, regions, room types, available rooms, gross profit, and monthly trends in one editable report. It is a strong fit when you already have structured hotel data and need a faster way to turn it into recurring management insight.
For more tutorials, visit YouTube.com/@PKAnExcelExpert.
Last updated: July 22, 2026