Export promotion councils often manage applications, participation fees, grants, market activity, council performance, approval rates, and export leads across multiple spreadsheets or disconnected reports. The Export Promotion Councils Dashboard in Power BI gives teams a ready Power BI reporting file with 5 report pages, 5 high-level KPI cards, 16+ analytical visuals, and slicer-based filtering for faster monthly and quarterly reviews.
This dashboard is designed for export councils, trade promotion agencies, government export departments, chambers of commerce, sector councils, grant teams, and analysts who need to review Total Participation Fee, Total Participants, Total Grant Value, Total Export Lead Value, Total Applications, export value, approval rate, markets, sectors, regions, event types, funding trends, and compliance in one Power BI report.
Click here to purchase Export Promotion Councils Dashboard in Power BI
Key Features of Export Promotion Councils Dashboard in Power BI
- 5 Power BI report pages: Overview, Council Analysis, Market Insights, Funding Trend, and Compliance.
- 5 KPI cards: Total Participation Fee, Total Participants, Total Grant Value, Total Export Lead Value, and Total Applications.
- Multiple slicers: Filter council, market, sector, region, status, event, month, quarter, and year views quickly.
- Council-level analytics: Compare export value, approval rates, target markets, and application volume.
- Funding and compliance views: Review applications by status, export value by quarter, participation fee by month, approval rate by region, and grant value by event type.
- Editable .pbix file: Customize visuals, colors, data fields, report pages, and measures in Power BI Desktop.
For users new to publishing or sharing Power BI reports, Microsoft provides official guidance in Microsoft Power BI documentation.
Dashboard Pages Explanation
1. Overview Page
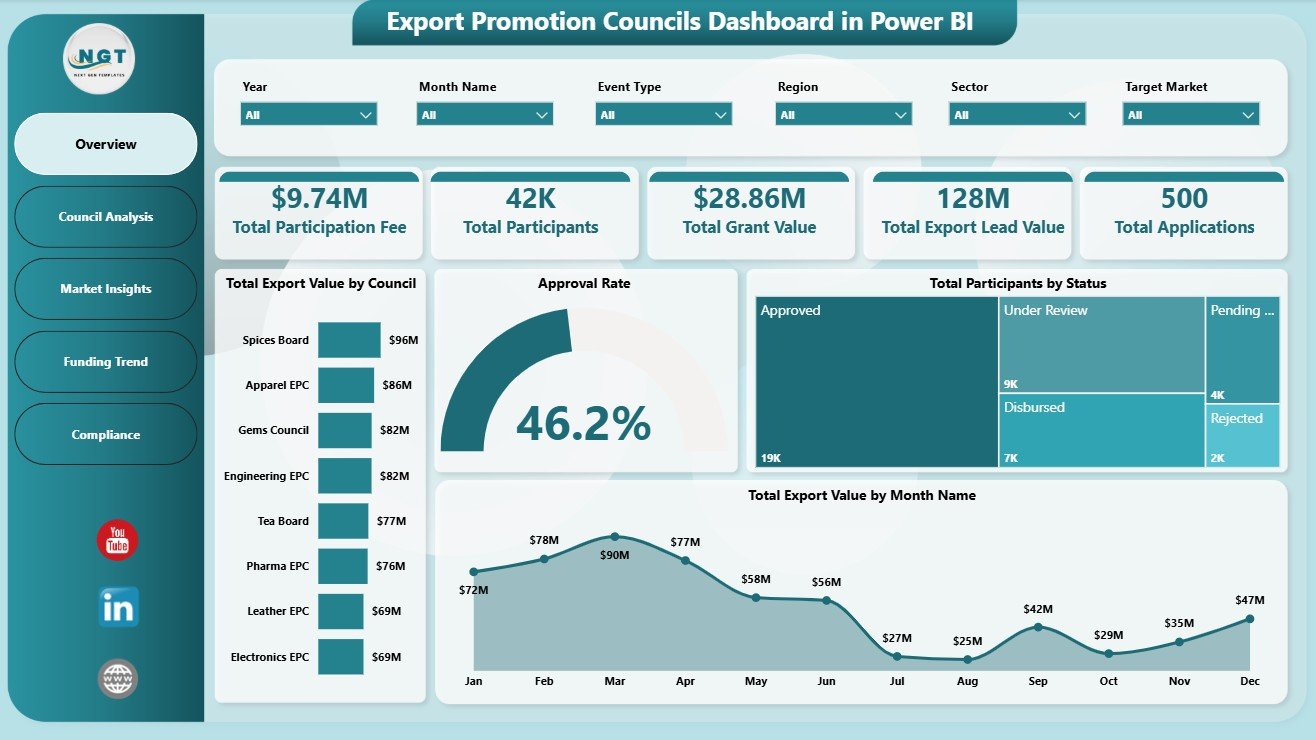
The Overview Page gives a leadership-level summary of export promotion performance. The top cards show Total Participation Fee, Total Participants, Total Grant Value, Total Export Lead Value, and Total Applications, helping users understand program scale, funding, engagement, application volume, and export pipeline value at a glance.
Total Export Value by Council: This chart compares export value across councils and highlights which councils are contributing the strongest results. It helps leaders prioritize follow-up, recognize high-performing councils, and spot underperforming areas.
Approval Rate by Overall Applications: This visual explains how effectively applications convert into approvals. It is useful for reviewing process quality, application readiness, and approval bottlenecks.
Total Participants by Status: This chart separates participant counts by status so teams can understand active, completed, pending, rejected, or other groups. It helps operational teams monitor participation movement quickly.
Total Export Value by Month Name: This trend shows monthly export value movement. It helps analysts identify seasonality, campaign impact, and months that need deeper investigation.
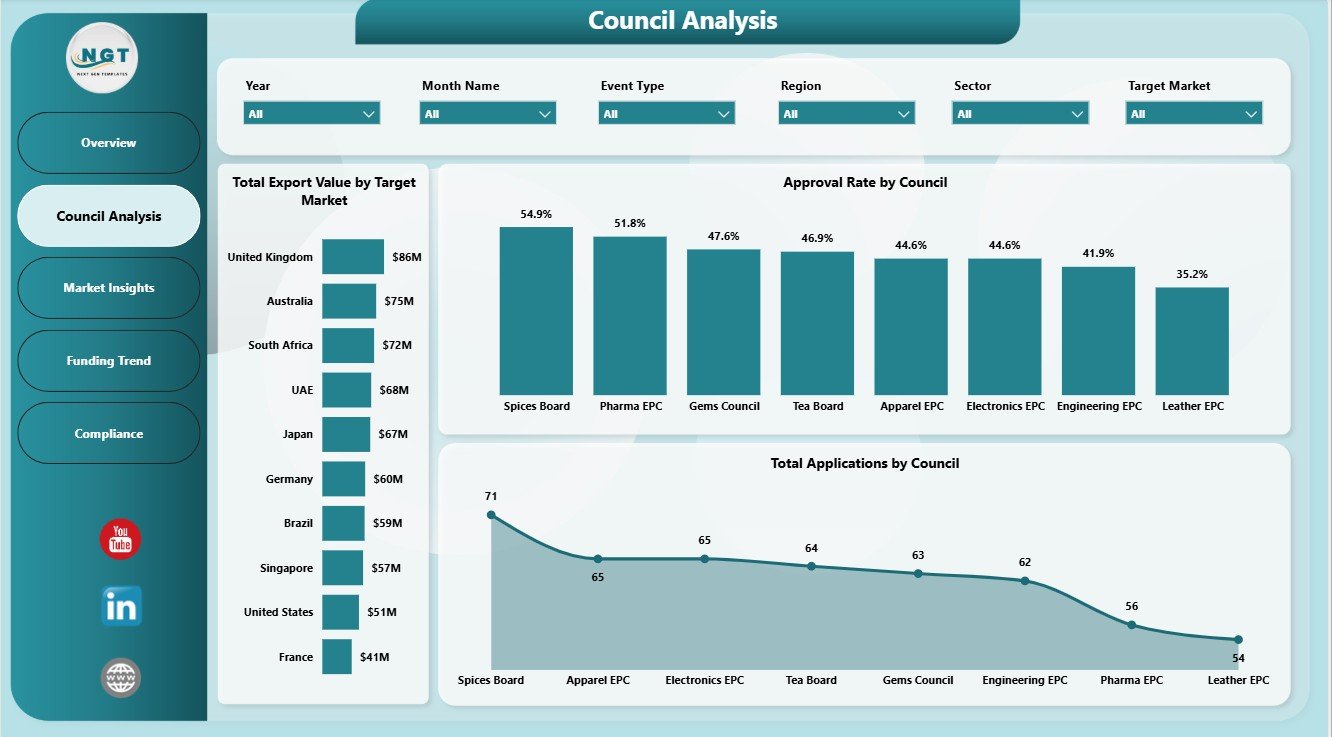
2. Council Analysis
The Council Analysis page focuses on council-level performance and market reach. Total Export Value by Target Market shows which international markets are generating the most value. Approval Rate by Council compares approval performance across councils, while Total Applications by Council shows workload and demand by council.
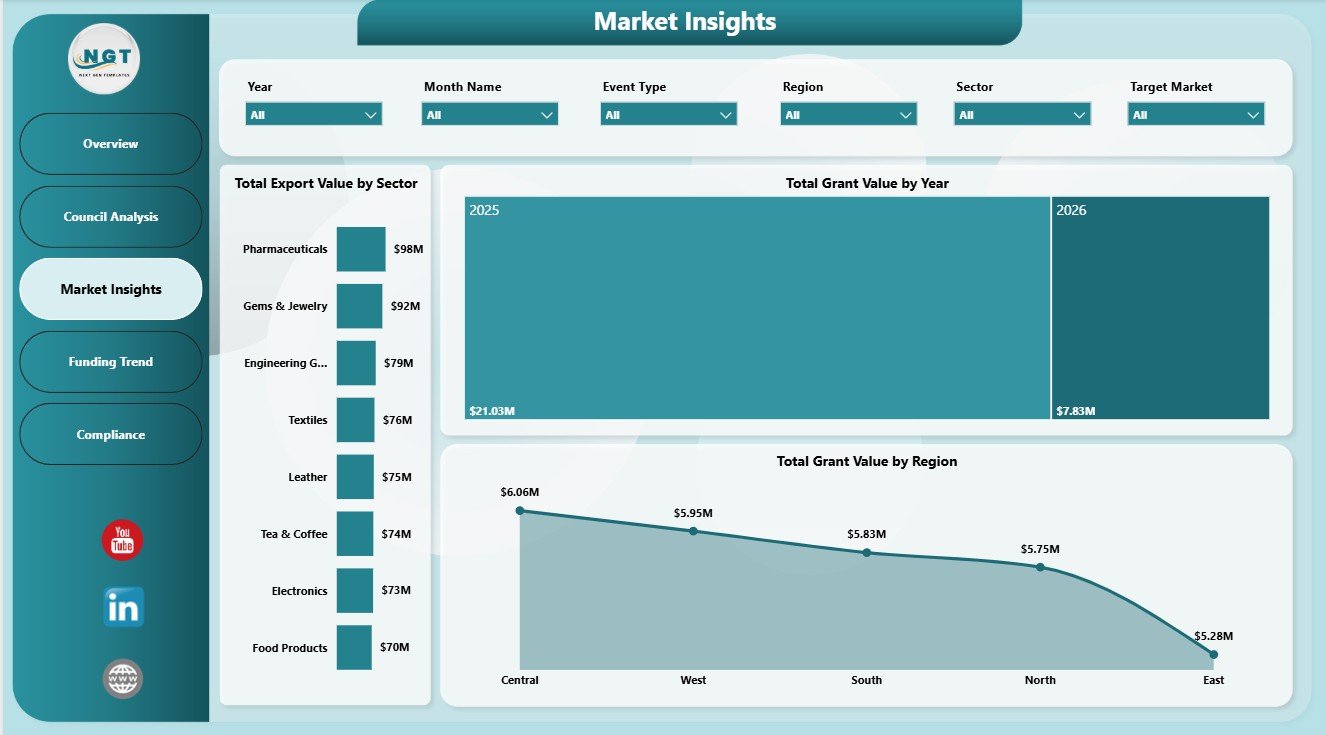
3. Market Insights
The Market Insights page explains where export promotion outcomes are concentrated. Total Export Value by Sector helps identify sectors producing the highest value. Total Grant Value by Year shows long-term funding movement, and Total Grant Value by Region helps compare regional grant allocation.
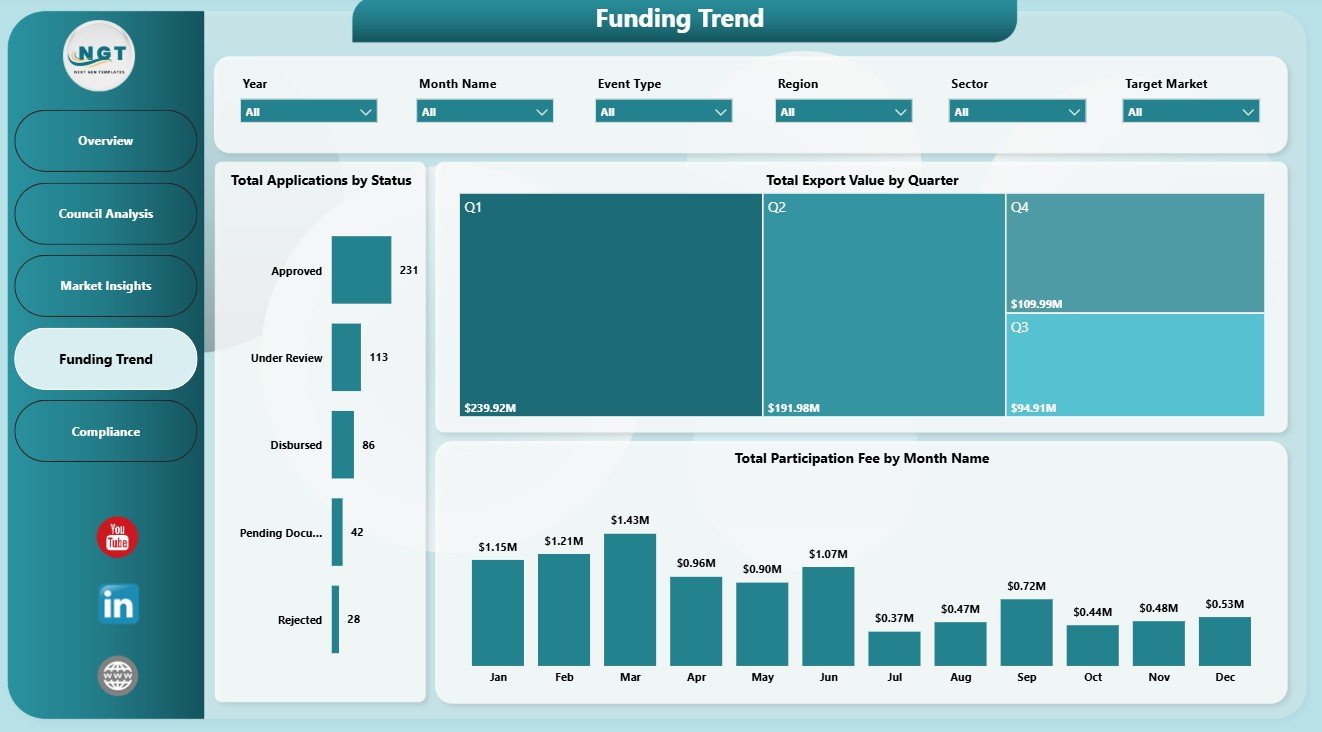
4. Funding Trend
The Funding Trend page is built for funding, application, and time-based review. Total Applications by Status summarizes application movement. Total Export Value by Quarter helps users compare quarterly results, while Total Participation Fee by Month Name shows monthly fee patterns.
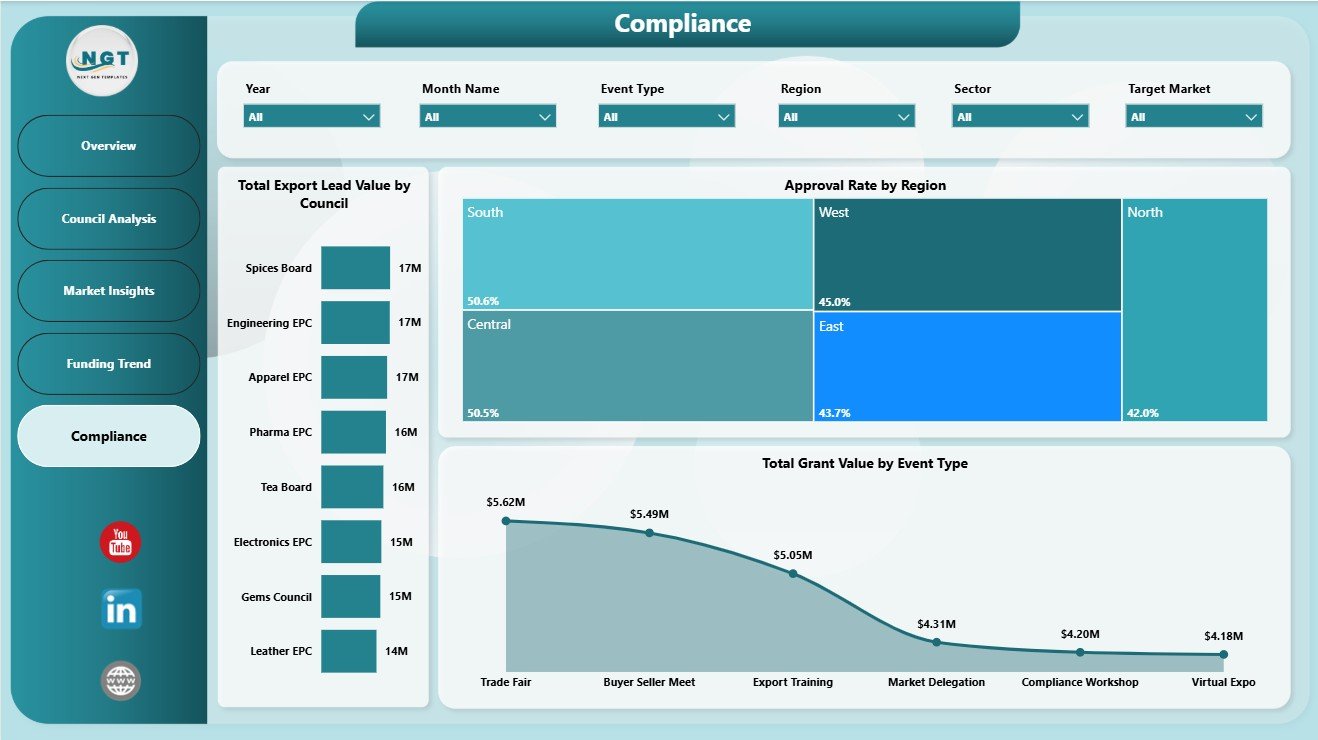
5. Compliance
The Compliance page connects export lead value, approval rates, regions, grant value, and event types. Total Export Lead Value by Council shows pipeline opportunity by council. Approval Rate by Region highlights regional processing effectiveness, and Total Grant Value by Event Type shows which activities receive the most funding support.
Export Promotion Councils Dashboard in Power BI vs. Tableau vs. Paid CRM/SaaS – Feature Comparison
| Feature | This Power BI Dashboard | Tableau Alternative | Paid CRM/SaaS |
|---|---|---|---|
| Cost | $17.99 one-time | Requires Tableau license or build effort | Monthly or annual subscription |
| Platform | Power BI Desktop | Tableau Desktop or Cloud | Vendor cloud platform |
| Setup time | Replace source data and refresh | Build or adapt a workbook | Onboarding and configuration |
| Real-time team collaboration | Available through Power BI Service setup | Available through Tableau Cloud | Usually included by license |
| Mobile access | Available after publishing | Available after publishing | Usually included |
| Customizable fields | Editable model and visuals | Editable if you own the workbook | Limited by vendor settings |
| Share with link | Available through Power BI Service | Available through Tableau Cloud | Login controlled |
| Year-1 cost at 5 users | $17.99 plus any Microsoft licensing | License and development cost | Often hundreds or thousands |
| Export promotion analytics | 5 ready report pages | Requires custom build | Depends on plan and configuration |
Who Should Use This Template
This template is useful for export promotion councils, trade promotion agencies, government export departments, chambers of commerce, sector councils, grant managers, program managers, compliance reviewers, and analysts who need recurring Power BI reporting. It is especially helpful when the same metrics must be reviewed each month across councils, markets, regions, sectors, statuses, and event types.
It is not designed to replace a live application portal, grant disbursement system, CRM, trade compliance platform, or automated case management workflow. It works best as a reporting layer for structured export promotion data.
Real-World Use Cases
Export council program manager: A program manager uses the Overview and Council Analysis pages before monthly reviews to explain participation fees, participants, grant value, applications, export value, and approval rates.
Trade data analyst: An analyst refreshes the Power BI file each month and uses Market Insights to identify high-value sectors, target markets, grant movement, and regional funding distribution.
Compliance and funding lead: A funding lead uses Funding Trend and Compliance pages to connect application status, quarterly export value, approval rate, grant value, event type, and export lead value before governance meetings.
Advantages of Export Promotion Councils Dashboard in Power BI
- It saves time compared with building a Power BI report from scratch.
- It keeps council, market, funding, compliance, and overview reporting in one file.
- It gives leaders fast views of participation fees, participants, grant value, lead value, and applications.
- It supports interactive filtering through slicers, making review meetings easier.
- It can be customized in Power BI Desktop as reporting needs evolve.
Opportunities for Improvement
Larger organizations can extend the report by connecting it to a governed data warehouse, adding role-level security, introducing automated refresh, adding beneficiary-level detail, tracking exporter size, connecting policy programs, or publishing the report through Power BI Service for controlled online sharing.
Best Practices
- Keep council, sector, region, market, event type, and status names consistent.
- Validate Total Applications, Total Grant Value, and Total Export Lead Value after every refresh.
- Use slicers during meetings to answer stakeholder questions without creating separate reports.
- Refresh the file after source data changes and keep a backup copy before major edits.
- Publish to Power BI Service only after checking access permissions and data sensitivity.
Explore Relevant Templates
- Export Promotion Councils Dashboard in Power BI
- Export Promotion Councils Dashboard in Excel
- Export Promotion Councils KPI Dashboard in Excel
- Power BI Dashboard Templates
Frequently Asked Questions
What KPI cards are included?
The Overview Page includes Total Participation Fee, Total Participants, Total Grant Value, Total Export Lead Value, and Total Applications.
How many Power BI pages are included?
The dashboard includes five report pages: Overview, Council Analysis, Market Insights, Funding Trend, and Compliance.
Can I use my own export promotion council data?
Yes. Replace or connect the source data with your own structured records, then refresh the report in Power BI Desktop.
Do I need advanced Power BI skills?
No. The basic workflow is to open the .pbix file, replace the sample data, and refresh. Advanced users can edit measures, relationships, visuals, and slicers.
Can this dashboard be published online?
Yes. You can publish it to Power BI Service if you have the required Microsoft account and licensing. Sharing permissions are controlled in your Power BI workspace.
Is the report editable?
Yes. The .pbix file is editable, so users can modify visuals, fields, colors, calculations, slicers, and report pages.
About the Author
Built by PK – Microsoft Certified Professional with 15+ years of Excel, Google Sheets, and Power BI experience. Founder of NextGenTemplates, reaching 300K+ subscribers across YouTube channels. Every template is hand-built and tested before release.
Conclusion
The Export Promotion Councils Dashboard in Power BI helps trade promotion teams convert participation fees, participants, grants, export leads, applications, councils, sectors, markets, regions, funding trends, and compliance records into clear visual reporting. With 5 report pages, KPI cards, slicers, and editable Power BI visuals, it gives teams a practical reporting layer without starting from a blank file.
Click here to purchase Export Promotion Councils Dashboard in Power BI.
Visit our YouTube channel for Excel and Power BI dashboard tutorials.
Last updated: June 10, 2026.