The Pet Care Services Dashboard in Excel is a ready-to-use workbook for pet grooming salons, daycare centers, boarding businesses, pet trainers, veterinary service support teams, and multi-location pet care operators. It includes 7 worksheet tabs, 4 high-level KPI cards, multiple slicers, and 18 focused chart views covering revenue, cost, net profit, satisfaction, staff productivity, service mix, locations, booking channels, repeat clients, and follow-ups. Instead of spending hours rebuilding monthly reports, you can update the Data Sheet, click Refresh All, and review the complete dashboard inside Microsoft Excel.
This dashboard is useful when your booking or POS system can export service records, but does not give you a clean management dashboard. It turns those raw rows into visual analysis for owners, managers, consultants, and team leads who need practical monthly decisions without a recurring SaaS subscription.
Click here to purchase Pet Care Services Dashboard in Excel
Key Features of Pet Care Services Dashboard in Excel
The Pet Care Services Dashboard in Excel is built around the way service-based pet businesses review performance: top-line revenue, cost control, service demand, staff contribution, satisfaction, and repeat client behavior. The Overview page gives the high-level snapshot, while the Service Mix, Location View, Staff Analysis, and Client Trends pages answer more specific management questions.
- 4 KPI cards: Total Revenue, Net Profit, Total Records, and Avg. Satisfaction Score.
- 18 chart views: Built across service, staff, location, client, cost, and revenue analysis pages.
- Multiple slicers: Filter dashboard views quickly without rebuilding pivot tables.
- Excel-based workflow: Replace sample rows, keep the same data format, and refresh all pivots.
- Staff and follow-up tracking: Compare revenue, cost, satisfaction, follow-ups, and repeat client percentage by employee.
- Location and booking channel review: Understand which branches and booking sources contribute most to revenue and completion.
- Support Sheet included: Pivot tables power the charts dynamically and can be hidden after setup.
Dashboard Pages Explanation
1. Overview Page
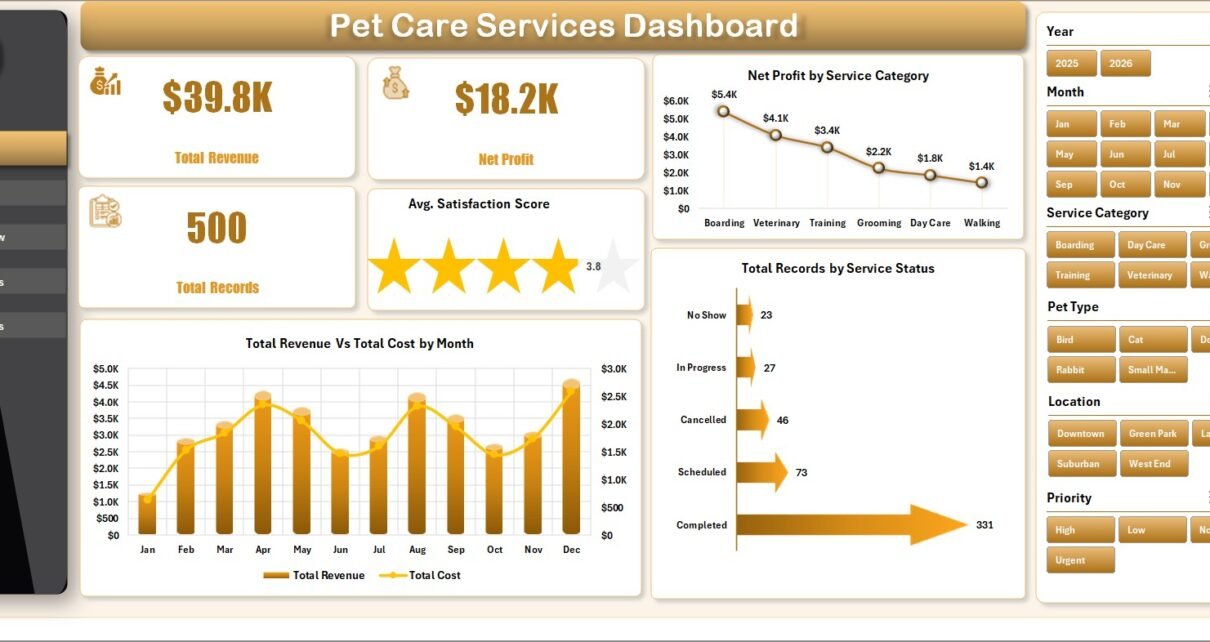
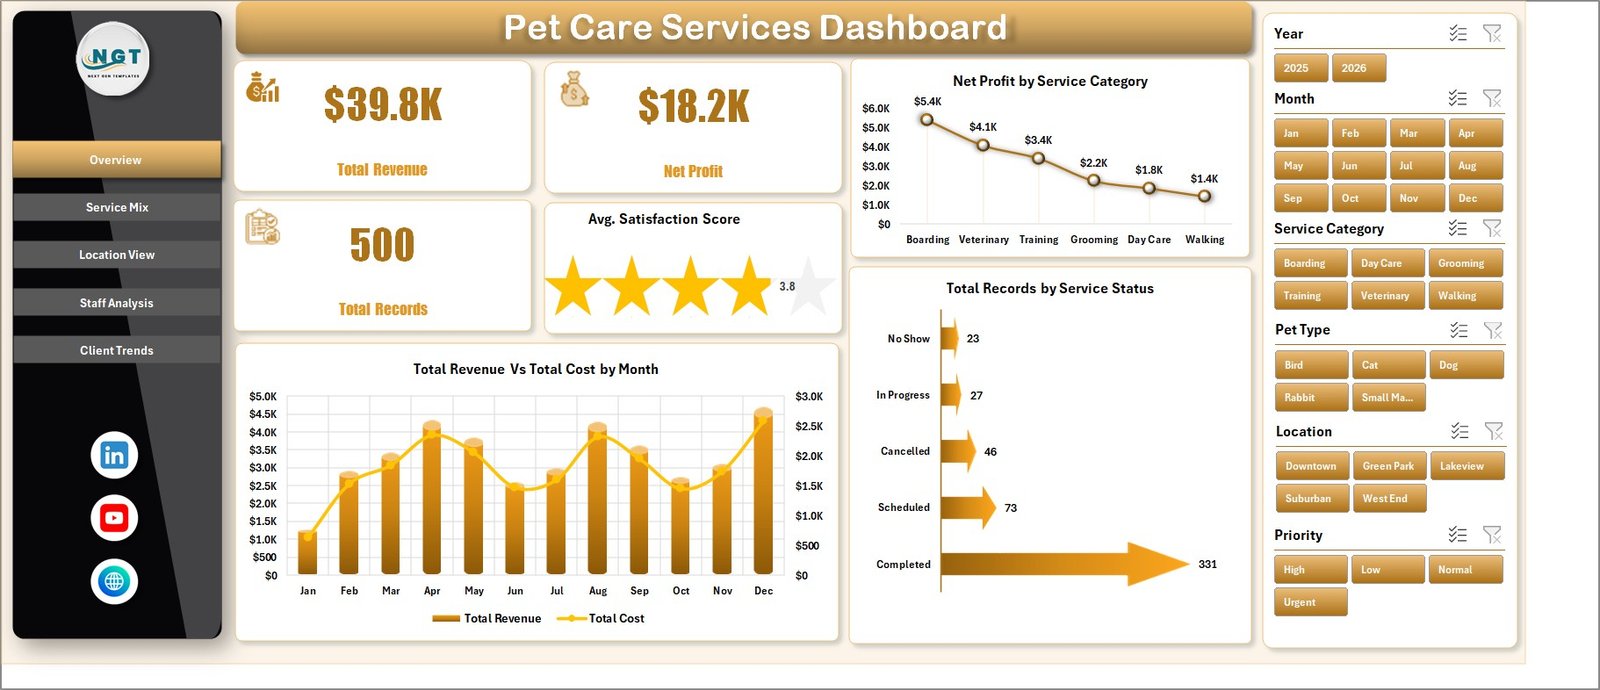
The Overview page is the command center of the workbook. At the top, it shows Total Revenue, Net Profit, Total Records, and Avg. Satisfaction Score so you can check overall business performance before drilling into details.
Net Profit by Service Category highlights which service categories generate the strongest bottom-line contribution. Use it to compare grooming, daycare, boarding, training, wellness, or other service groups based on your data.
Total Revenue vs. Total Cost by Month compares monthly income against monthly cost. It helps you identify seasonality, margin compression, and months where revenue growth may be matched by rising expenses.
Total Records by Service Status shows how records are distributed by completion, cancellation, pending, or other statuses in your dataset. It is useful for understanding service throughput and operational backlog.
Pet Care Services Dashboard in Excel
2. Service Mix
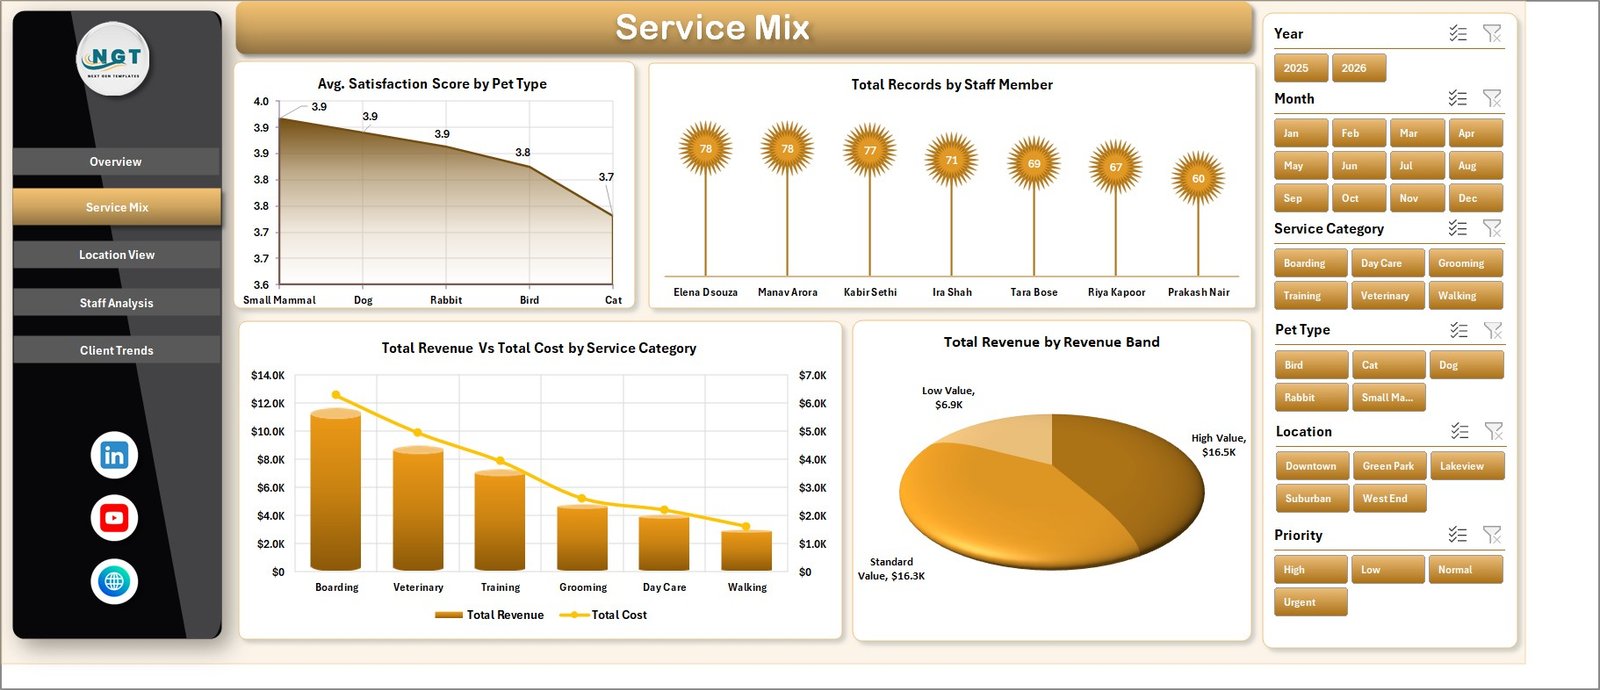
The Service Mix tab helps managers understand how demand, satisfaction, revenue, and cost differ across pets, staff, categories, and revenue bands.
Avg. Satisfaction Score by Pet Type shows which pet types receive the strongest customer satisfaction results. This can guide service training, customer communication, and service package design.
Total Records by Staff Member compares workload volume across team members. It helps identify whether appointments or service records are balanced across staff.
Total Revenue vs. Total Cost by Service Category compares income and delivery cost by category. Use it to see which services are high-revenue, high-cost, or margin-friendly.
Total Revenue by Revenue Band groups revenue into bands, making it easier to understand whether business volume is concentrated in low-ticket, mid-ticket, or high-ticket service records.
Service Mix
3. Location View
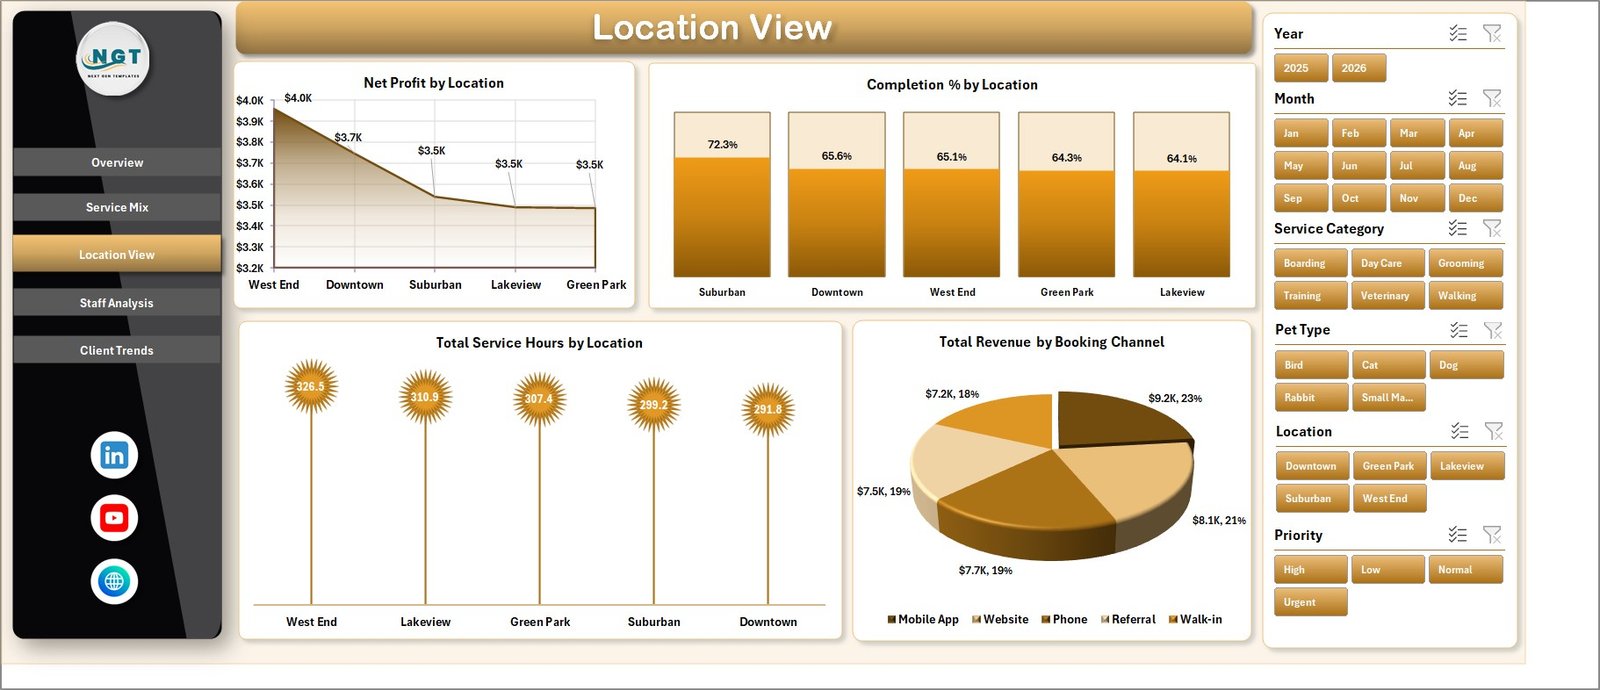
The Location View tab is designed for businesses with branches, service areas, clinics, stores, or operating locations.
Net Profit by Location identifies which locations produce the strongest profit after costs. It supports branch-level review and expansion planning.
Completion % by Location compares how successfully each location completes scheduled or recorded services. Low completion can point to staffing, capacity, booking, or operational issues.
Total Service Hours by Location shows service effort by branch or location. Compare it with revenue and profit to understand productivity and capacity usage.
Total Revenue by Booking Channel shows which channels drive income. Use this to compare walk-in, phone, website, app, referral, or partner channels if those fields exist in your data.
Location View
4. Staff Analysis
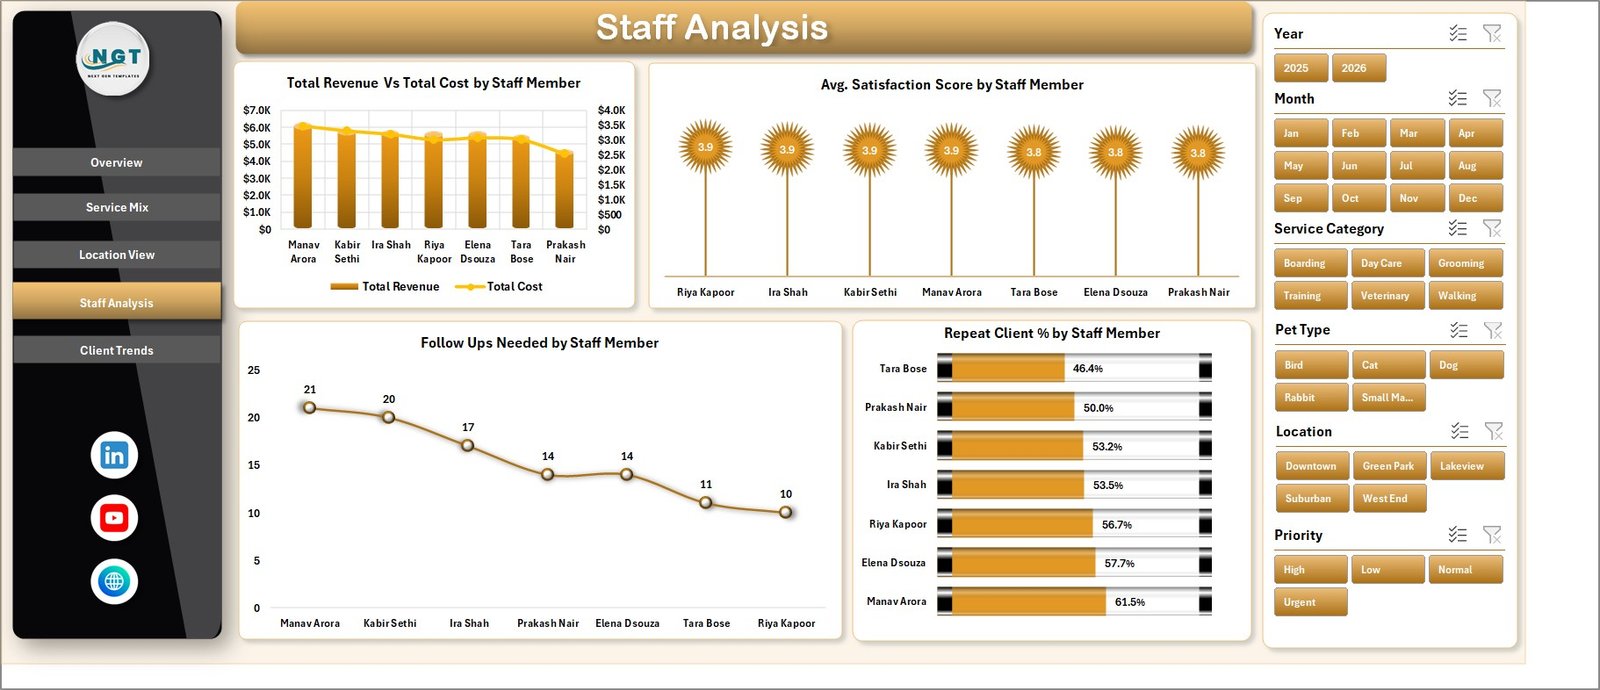
The Staff Analysis tab gives managers a practical view of employee contribution, cost, satisfaction, follow-up workload, and repeat client performance.
Total Revenue vs. Total Cost by Staff Member compares each staff member’s revenue contribution against related service cost. This is helpful for coaching, scheduling, and service assignment decisions.
Avg. Satisfaction Score by Staff Member shows customer experience by employee. Managers can recognize strong performers and identify where service training may help.
Follow Ups Needed by Staff Member tracks follow-up workload by person. This helps prevent missed client follow-ups and supports better after-service communication.
Repeat Client % by Staff Member shows which staff members are associated with stronger repeat client behavior. It can reveal service quality, rapport, and client retention patterns.
Staff Analysis
5. Client Trends
The Client Trends tab is built for long-term review across years and quarters.
Total Revenue vs. Total Cost by Year compares annual revenue and cost trends. It helps owners understand whether the business is scaling with healthy margins.
Repeat Client % by Quarter shows client loyalty trends across the year. A falling repeat client rate can signal service quality issues, weak follow-up, or competitive pressure.
Total Records by Repeat Client compares records by repeat-client status. It helps you understand how much of your activity comes from returning clients versus one-time clients.
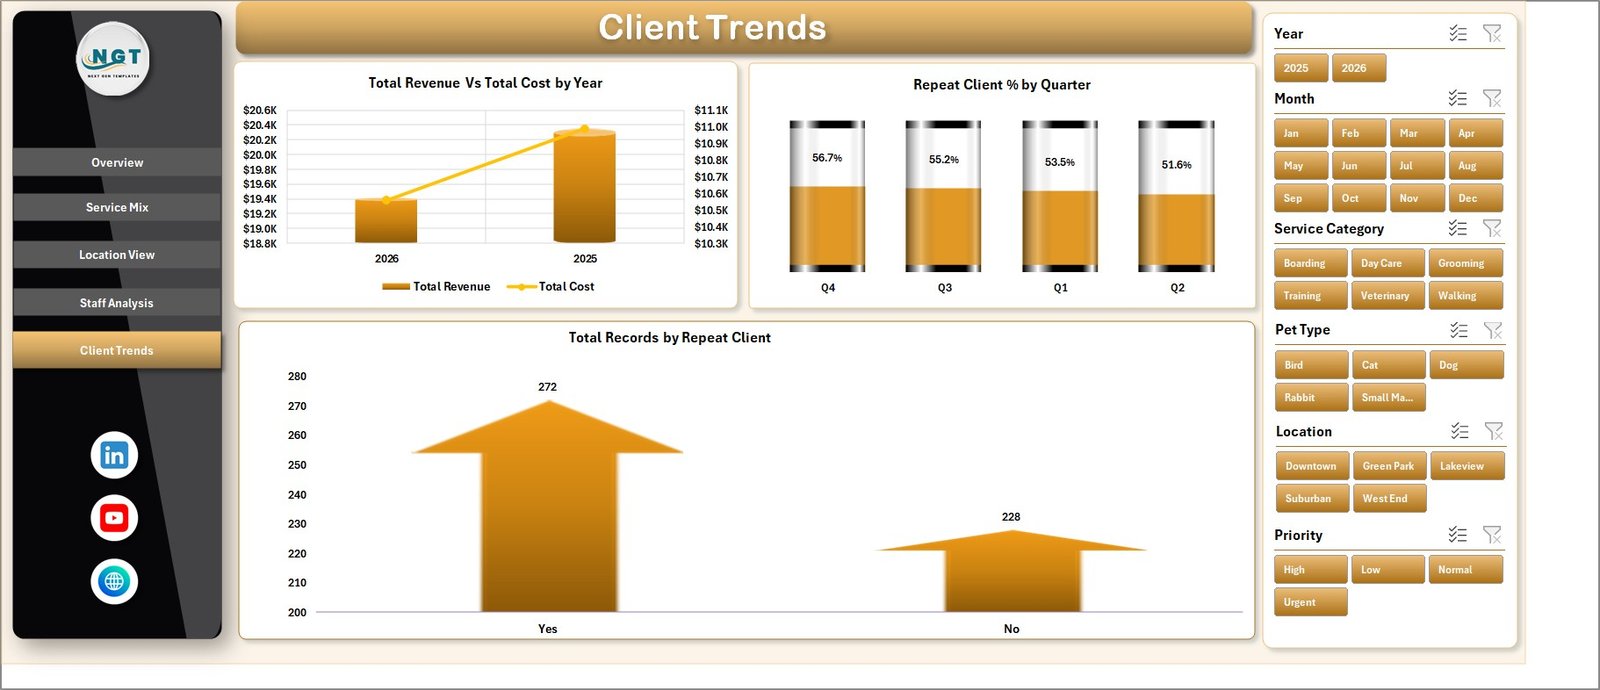
Client Trends
6. Data Sheet Tab
The Data Sheet is where you add your data in the same format as the sample records. Keep the column structure unchanged so slicers, formulas, pivot tables, and charts continue working correctly.

Data Sheet tab
7. Support Sheet
The Support Sheet contains multiple pivot tables used to create the dashboard dynamically. After updating the Data Sheet, go to the Excel Ribbon, open the Data tab, and click Refresh All. All pivots and charts will refresh. You can keep this sheet hidden after setup, but do not delete it.

Support sheet tab
Pet Care Services Dashboard in Excel vs. Google Sheets vs. Paid CRM/SaaS – Feature Comparison
| Feature | Pet Care Services Dashboard in Excel | Google Sheets Dashboard | Paid Pet Care SaaS |
|---|---|---|---|
| Cost | $17.99 one-time | Low cost but usually manual to build | Monthly or annual subscription |
| Platform | Microsoft Excel | Browser-based spreadsheet | Vendor-hosted web app |
| Setup time | Replace sample data and refresh | Build formulas, pivots, sharing, and charts | Vendor onboarding and setup |
| Real-time team collaboration | Best through OneDrive or SharePoint | Native collaboration | Usually included |
| Mobile access | Depends on Excel and file storage setup | Strong mobile access | Usually included |
| Customizable fields | Editable workbook and data table | Editable but requires manual chart updates | Often limited by vendor plan |
| Share with link | Possible through Microsoft 365 storage | Native link sharing | Vendor-controlled access |
| Year-1 cost at 5 users | Template price plus existing Excel costs | Your build time and maintenance | Often hundreds or thousands per year |
| Pet service analytics | Included for services, staff, locations, clients | Must be built manually | Depends on plan and export options |
Who Should Use This Template
This template is best for pet grooming salons, dog daycare providers, boarding centers, pet training businesses, veterinary support service teams, franchise managers, and consultants who need a repeatable Excel reporting format. It is especially useful for teams that already export service records from another system but need a cleaner monthly dashboard.
It is not a booking system, payment processor, medical record system, or live customer portal. Use it for reporting and decision support, not for regulated veterinary documentation or operational scheduling.
Real-World Use Cases
Meera runs a grooming salon. She reviews Net Profit by Service Category and Total Revenue by Revenue Band each month to decide which grooming packages should be promoted.
James manages two pet daycare locations. He checks Completion % by Location and Total Service Hours by Location to balance staff coverage and improve appointment completion.
Priya advises a boarding business. She uses Repeat Client % by Quarter and Follow Ups Needed by Staff Member to improve retention and client communication.
Advantages of Pet Care Services Dashboard in Excel
The biggest advantage is speed. The workbook already includes the dashboard pages, cards, charts, slicers, data sheet, and support pivots. You do not need to design the reporting structure from scratch.
The second advantage is ownership. Because this is an Excel file, you can customize labels, chart colors, formulas, and data fields as your business grows. It also avoids per-user subscription fees for teams that only need periodic reporting.
Opportunities for Improvement
This dashboard depends on a structured data table. If your source system exports messy or incomplete records, you may need to clean your data before analysis. The workbook is also file-based, so real-time team collaboration depends on how you store and share the Excel file. Future versions could include more automated data import, client lifetime value metrics, and separate pages for marketing campaigns or package-level profitability.
Best Practices
Keep one clean source file for each reporting period and always preserve the Data Sheet column structure. Before refreshing, check for blank dates, missing service categories, incorrect cost entries, and inconsistent staff names. Use the same spelling for locations, booking channels, pet types, and staff members so slicers group records correctly.
For official Excel guidance on refreshing data and working with workbook data connections, see Microsoft Excel Help and Training.
Explore Relevant Templates
You can compare this template with the related Pet Care Business Dashboard in Excel, Pet Care Business Dashboard in Power BI, and Pet Care Services KPI Dashboard in Excel. For more Excel reporting templates, browse the Excel Dashboard Templates category on NextGenTemplates.
Frequently Asked Questions
What does the Pet Care Services Dashboard in Excel track?
It tracks Total Revenue, Net Profit, Total Records, Avg. Satisfaction Score, service categories, monthly revenue and cost, service status, pet type, staff member, revenue bands, locations, completion percentage, service hours, booking channels, yearly trends, quarterly repeat client percentage, and follow-ups.
Can I use my own data?
Yes. Add your own records in the Data Sheet using the same column layout. Then use Data > Refresh All in Excel to update the pivot tables and dashboard charts.
Do I need advanced Excel knowledge?
No. Basic Excel skills are enough to update the data sheet, use slicers, and refresh the workbook. Advanced users can customize charts and formulas if needed.
Can I hide the Support Sheet?
Yes. The Support Sheet can be hidden after setup, but it should not be deleted because it contains the pivot tables that power the dashboard.
Is this dashboard suitable for multiple locations?
Yes. The Location View tab includes Net Profit by Location, Completion % by Location, and Total Service Hours by Location, making it useful for multi-location pet care businesses.
Is this a pet care booking system?
No. It is a reporting dashboard. It does not replace booking, billing, POS, veterinary records, or customer messaging software.
About the Author
Built by PK – Microsoft Certified Professional with 15+ years of Excel, Google Sheets, and Power BI experience. Founder of NextGenTemplates, reaching 300K+ subscribers across YouTube channels. Every template is hand-built and tested before release.
Conclusion
The Pet Care Services Dashboard in Excel gives pet service businesses a clear way to convert daily records into usable management insight. With seven workbook tabs, four KPI cards, interactive slicers, and focused charts for service mix, locations, staff, and client trends, it is a practical reporting tool for owners and managers who want better decisions without rebuilding reports every month.
Click here to purchase Pet Care Services Dashboard in Excel
Last updated: July 23, 2026.
Watch Excel and dashboard tutorials on YouTube.com/@PK-AnExcelExpert.