Performance Management Dashboard in Excel is a ready-to-use Excel dashboard template for HR managers, department heads, business owners, team leads, and performance analysts who want to turn review data into clear management insights. Performance reviews can involve ratings, tasks, training hours, recognition, absences, goals, managers, departments, priorities, and status tracking. When all of that stays in raw spreadsheets, review meetings become slow and subjective.
This Excel workbook gives you seven sheets: Overview, Dept Analysis, Manager View, Goal Insights, Trend Analysis, Data, and Support. Replace the sample rows in the Data sheet, refresh the pivots, and use the dashboard pages to review actual scores, ratings, tasks completed, coaching rate, goal attainment, training hours, recognition, and trends without building the charts from scratch.
Click to Buy Performance Management Dashboard in Excel

Key Features of Performance Management Dashboard in Excel
- Seven Excel sheets: Overview, Dept Analysis, Manager View, Goal Insights, Trend Analysis, Data, and Support.
- Executive KPI cards: Total Actual Score, Avg. Performance Rating, Total Tasks Completed, Total Training Hours, and Total Recognition.
- Department analysis: Compare performance rating, coaching rate, goal attainment, and training hours by department and manager.
- Manager review page: Track tasks completed, average rating, absence days, and actual score by goal category.
- Goal insights: Review task completion percentage, actual score by year, recognition by task band, and records by priority.
- Trend analysis: Monitor goal attainment by quarter, performance rating by review cycle, and training hours by month.
- Refreshable Excel model: Update the Data sheet, click Refresh All, and allow pivot-backed charts and slicers to update.
Dashboard Pages Explanation
1 – Overview Page
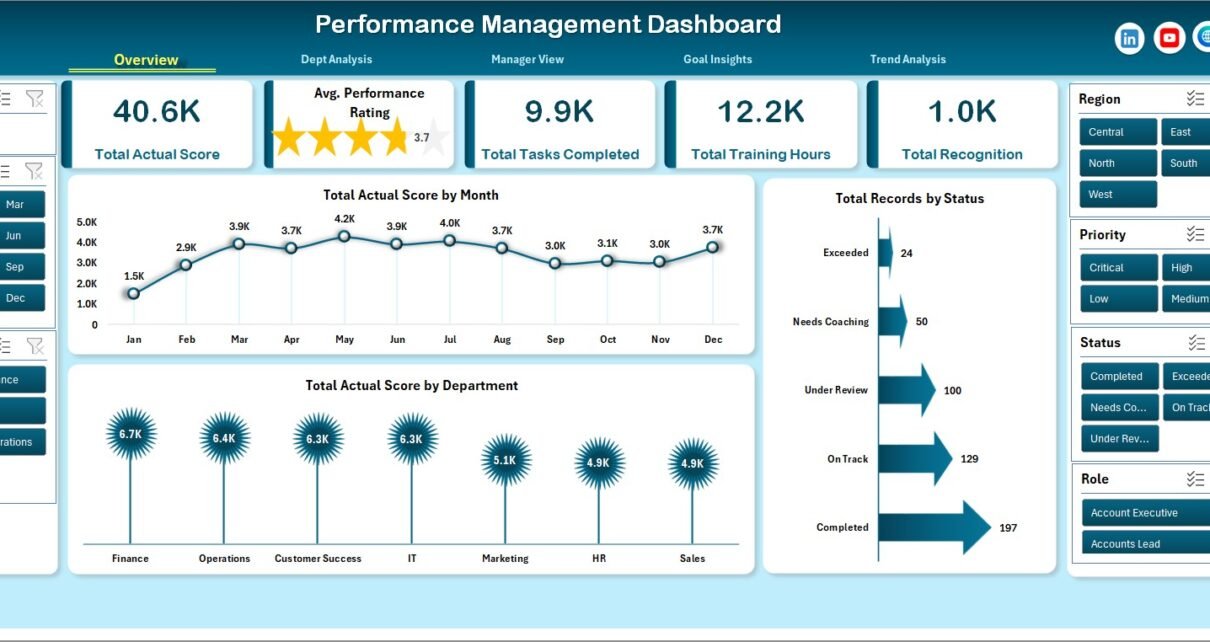
The Overview page is the high-level summary for performance review meetings. It shows Total Actual Score, Avg. Performance Rating, Total Tasks Completed, Total Training Hours, and Total Recognition at the top so decision makers can understand the overall position before reviewing detailed pages.
Total Actual Score by Month: This chart tracks actual score movement across months. It helps HR and managers see whether performance results are improving, declining, or staying flat over time.
Total Actual Score by Department: This chart compares actual performance score across departments. It highlights teams that are performing strongly and departments that may need extra coaching or review support.
Total Records by Status: This chart groups performance records by their current status. It helps users quickly identify review completion, pending actions, or workflow backlog depending on the status labels used in the data.
2 – Dept Analysis
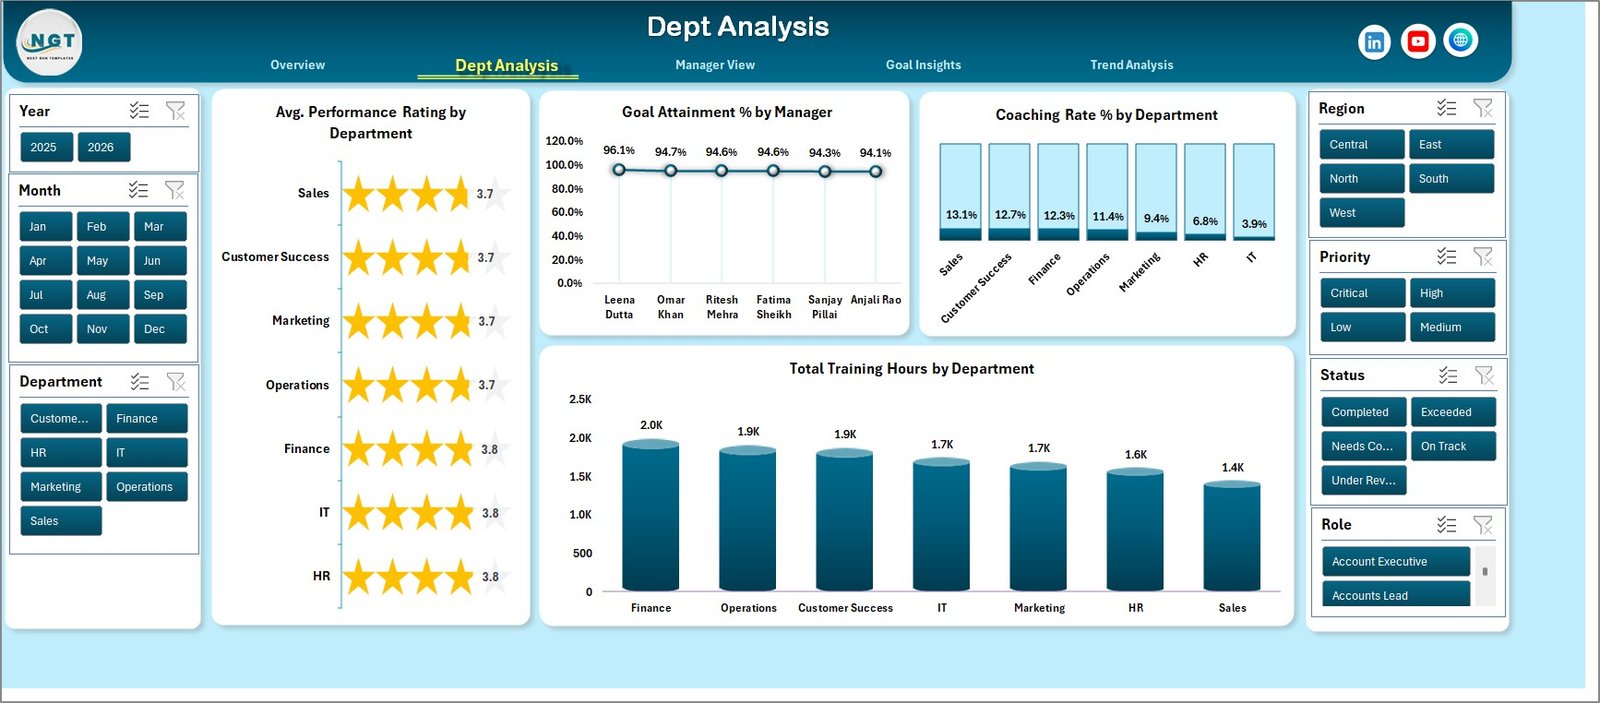
The Dept Analysis sheet focuses on department-level and manager-linked performance results. It is useful when HR leaders want to compare departments fairly instead of relying only on individual review notes.
Avg. Performance Rating by Department: This chart compares average performance rating across departments. It helps identify teams with consistently high ratings and departments where performance standards may need review.
Goal Attainment % by Manager: This chart compares goal attainment percentage by manager. It helps leadership review which managers are helping teams convert targets into measurable results.
Coaching Rate % by Department: This chart shows coaching rate percentage by department. It helps HR understand where coaching activity is concentrated and whether underperforming areas are receiving enough support.
Total Training Hours by Department: This chart compares total training hours across departments. It helps connect learning investment with performance improvement discussions.
3 – Manager View
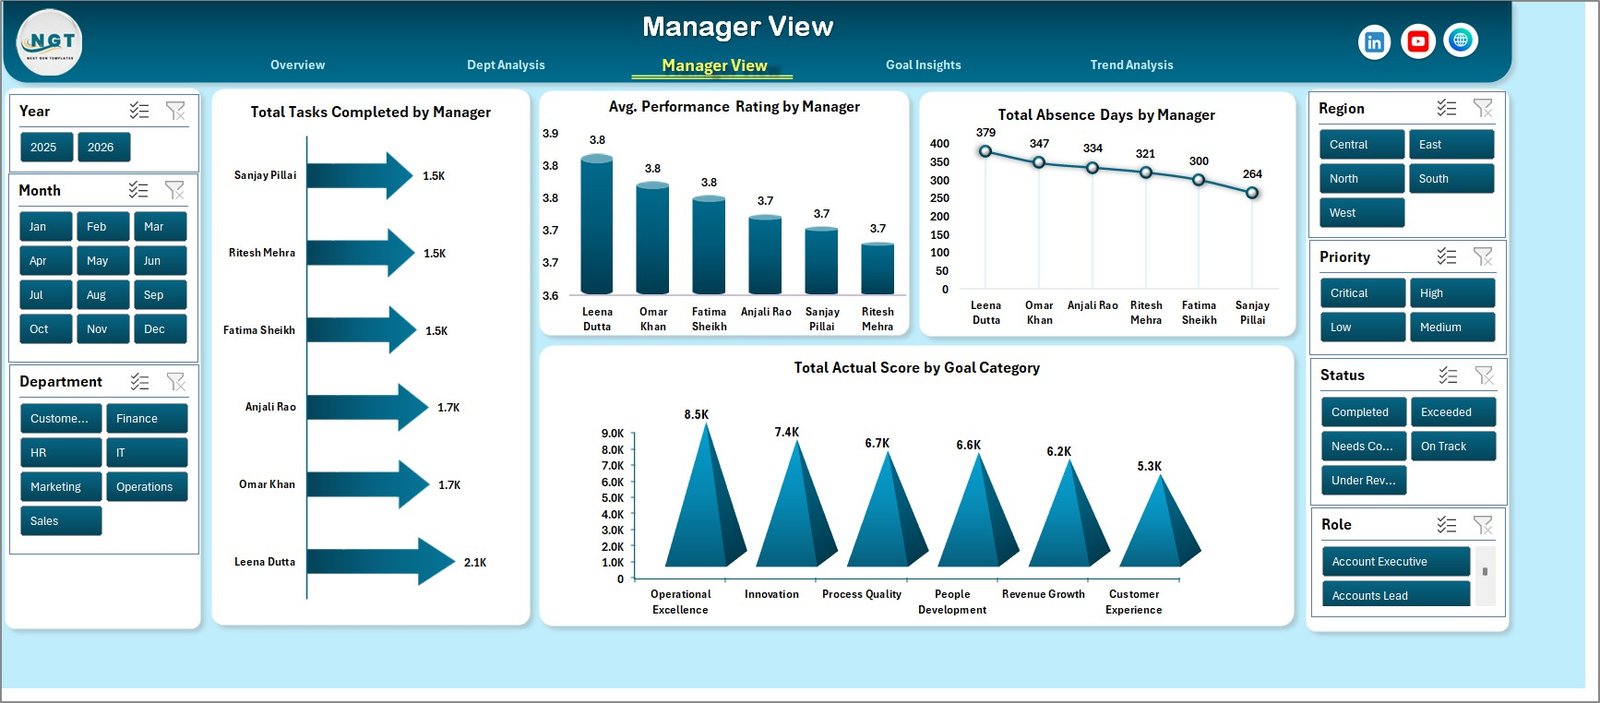
The Manager View sheet gives a manager-wise lens on performance outcomes. It is useful for leadership reviews, manager coaching discussions, and identifying differences in task completion, rating patterns, absence days, and goal category results.
Total Tasks Completed by Manager: This chart compares task completion totals by manager. It helps teams understand where execution volume is strongest and where follow-up may be required.
Avg. Performance Rating by Manager: This chart compares average rating by manager. It helps leadership review manager-level performance distribution and spot unusually high or low rating patterns.
Total Absence Days by Manager: This chart summarizes absence days by manager group. It helps connect attendance behavior with performance discussions when absence data is part of the review model.
Total Actual Score by Goal Category: This chart compares actual score by goal category. It helps identify whether results are stronger in operational, behavioral, learning, customer, or other goal areas used in the data.
4 – Goal Insights
The Goal Insights page connects score, completion, recognition, and priority. It is designed for teams that want to move beyond one rating number and understand how goals are being completed across categories and review periods.
Task Completion % by Goal Category: This chart shows completion percentage by goal category. It helps managers see which types of goals are being completed well and which need clearer ownership.
Total Actual Score by Year: This chart compares total actual score by year. It is useful for annual review conversations and performance trend comparison across calendar years.
Total Recognition by Task Band: This chart compares recognition by task band. It helps HR see whether recognition is aligned with task complexity, effort bands, or other groupings in the data.
Total Records by Priority: This chart groups records by priority. It helps review whether high-priority goals and tasks are receiving enough attention during the performance cycle.

5 – Trend Analysis
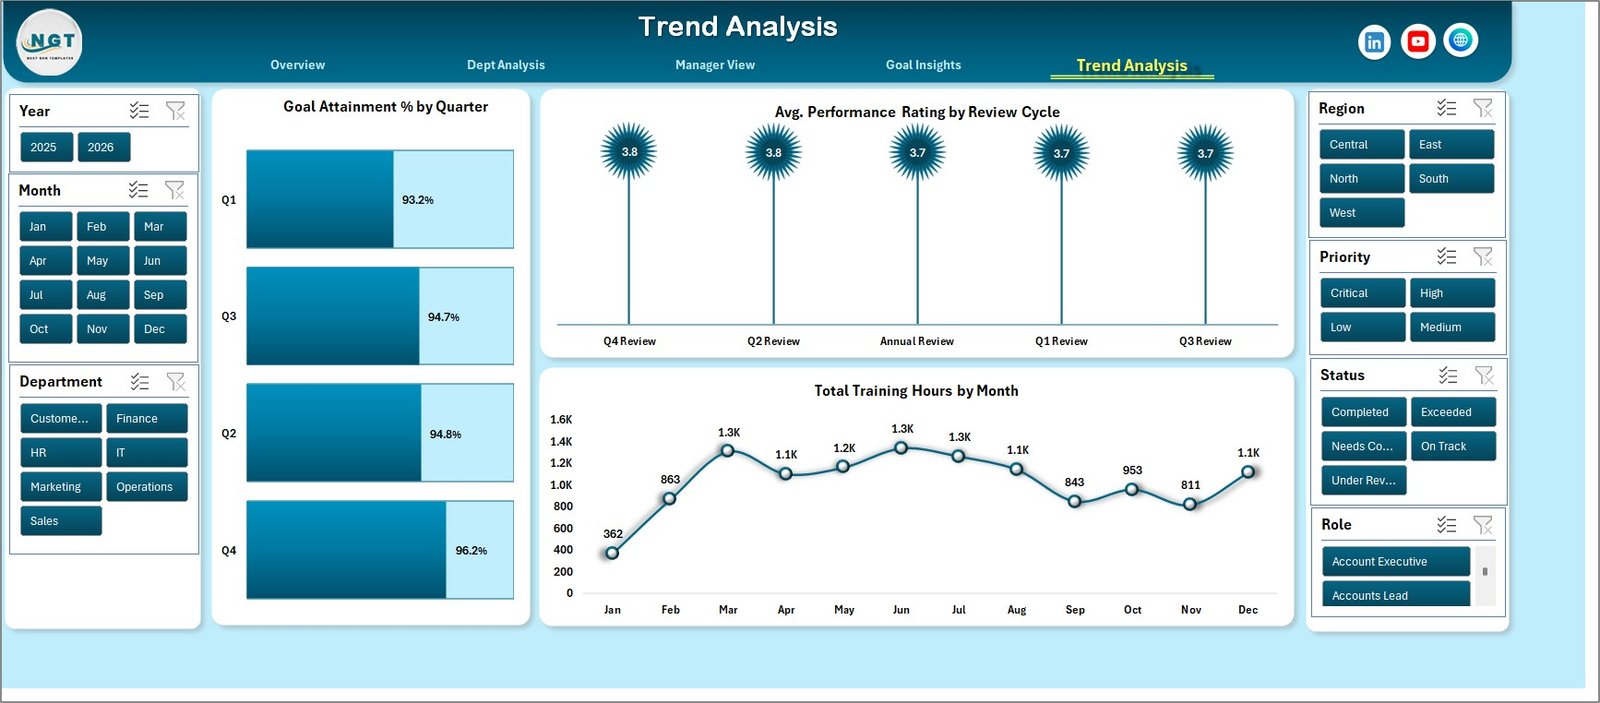
The Trend Analysis sheet is built for period-over-period review. It helps managers and HR leaders understand whether performance management activity is improving across quarters, review cycles, and months.
Goal Attainment % by Quarter: This chart tracks quarterly goal attainment. It helps teams see whether goal delivery is improving as the year progresses.
Avg. Performance Rating by Review Cycle: This chart compares rating across review cycles. It helps identify whether ratings are changing after coaching, training, or process improvements.
Total Training Hours by Month: This chart tracks monthly training hours. It helps HR connect learning activity with performance improvement over time.
6 – Data Sheet Tab
The Data sheet is where you add your own performance records in the same format as the sample data. Keep the column structure consistent, paste new rows carefully, and refresh the workbook after updating the data.

7 – Support Sheet
The Support sheet contains multiple pivot tables used to create the dashboard dynamically. After updating the Data sheet, go to the Data tab in the Excel Ribbon and click Refresh All. All pivots and charts will refresh, and you can keep this sheet hidden.

Performance Management Dashboard in Excel vs. Google Sheets vs. Paid CRM/SaaS – Feature Comparison
| Feature | This Excel dashboard | Google Sheets alternative | Paid HR SaaS |
|---|---|---|---|
| Cost | One-time template purchase | Free if built manually | Monthly or annual subscription |
| Platform | Microsoft Excel | Browser-based spreadsheet | Vendor cloud platform |
| Setup time | Replace sample data and refresh pivots | Build formulas, pivots, charts, and layout yourself | Implementation and onboarding |
| Real-time team collaboration | Best for one file owner or shared workbook process | Strong cloud collaboration | Usually included |
| Mobile access | Limited compared with cloud apps | Available through Google Sheets app | Usually included |
| Customizable fields | Editable data columns, pivots, and charts | Editable with spreadsheet skills | Often limited by plan or admin settings |
| Share with link | Possible through OneDrive or SharePoint | Built in | Login controlled |
| Year-1 cost at 5 users | Template price only | Your build time | Often hundreds or thousands |
| Performance dashboard pages | Pre-built Overview, Dept Analysis, Manager View, Goal Insights, and Trend Analysis | Requires custom build | Depends on vendor reporting module |
Who Should Use This Template
This template is best for HR managers, department heads, people operations teams, small business owners, consultants, and analysts who already maintain structured performance management data and need an Excel reporting layer for recurring review meetings.
It is not a full HRIS, payroll tool, employee self-service portal, approval workflow system, or real-time multi-user performance management platform. Use it when the goal is analysis and reporting, not employee-facing software automation.
Real-World Use Cases
Quarterly review meeting: An HR manager filters the Overview and Dept Analysis pages to discuss actual scores, ratings, recognition, coaching rate, and training hours by department.
Manager coaching review: A department head opens Manager View to compare tasks completed, absence days, and goal category score by manager before planning coaching support.
Performance improvement tracking: A consultant uses Goal Insights and Trend Analysis to show whether goal attainment, review cycle ratings, and training hours are moving in the right direction.
Advantages of Performance Management Dashboard in Excel
- It turns raw performance records into visual pages that are easier to review in meetings.
- It separates input data, dashboard pages, and support pivots so the workbook is easier to maintain.
- It gives both manager-level and department-level analysis in the same file.
- It includes trend views for quarterly, monthly, yearly, and review cycle reporting.
- It works in Excel, so teams can customize charts, pivots, slicers, and fields as their review model changes.
Opportunities for Improvement
- Standardize employee, department, manager, goal category, status, priority, and review cycle names before refreshing the workbook.
- Document how performance rating, actual score, coaching rate, goal attainment, recognition, and task bands are calculated in your organization.
- Protect formula and pivot areas before sharing the workbook with users who only need to enter data.
- Use OneDrive or SharePoint if more than one stakeholder needs file access, but keep a clear file owner for data quality.
Best Practices
- Keep the Data sheet column structure unchanged.
- Use consistent names for departments, managers, statuses, priorities, and goal categories.
- Refresh all pivots after every data update.
- Check the Overview totals before using detailed sheets in a meeting.
- Hide the Support sheet after setup so end users focus on dashboard pages.
For official Microsoft guidance on refreshing PivotTables, see Refresh PivotTable data.
Explore Relevant Templates
You can download the product here: Performance Management Dashboard in Excel. You may also like Performance Management KPI Dashboard in Excel, Employee Master and Record Data Entry System in Excel, Employee Turnover Dashboard in Excel, and Employee Disciplinary Action Tracker in Excel.
Frequently Asked Questions
What is included in the Performance Management Dashboard in Excel?
It includes Overview, Dept Analysis, Manager View, Goal Insights, Trend Analysis, Data, and Support sheets with KPI cards, slicers, charts, data entry structure, and pivot-backed support tables.
Can I replace the sample data?
Yes. Replace the sample records in the Data sheet while keeping the same format, then click Refresh All from the Excel Data tab.
Does the workbook use pivot tables?
Yes. The Support sheet contains multiple pivot tables used to create the dashboard dynamically.
Can I hide the Support sheet?
Yes. After setup, you can keep the Support sheet hidden and use Refresh All after updating the Data sheet.
Is this a full HR software system?
No. It is an Excel dashboard template for performance reporting and analysis, not a full HRIS, employee login portal, payroll system, or approval workflow tool.
What software do I need?
You need Microsoft Excel. Microsoft 365 or a recent desktop version of Excel is recommended for the best slicer, chart, and pivot experience.
About the Author
Built by PK – Microsoft Certified Professional with 15+ years of Excel, Google Sheets, and Power BI experience. Founder of NextGenTemplates, reaching 300K+ subscribers across YouTube channels. Every template is hand-built and tested before release.
Conclusion
The Performance Management Dashboard in Excel helps teams move from scattered review data to structured performance conversations. With cards for actual score, rating, tasks completed, training hours, and recognition, plus department, manager, goal, trend, data, and support sheets, it gives HR and managers a practical workbook for recurring performance review analysis.
For more Excel dashboard tutorials, visit Youtube.com/@PKAnExcelExpert.