In today’s fast-paced academic and training environments, tracking progress across multiple projects isn’t just beneficial—it’s essential. Whether you’re managing curriculum development, teacher training, or institutional growth initiatives, having a clear view of timelines and key metrics can be a game-changer. That’s exactly where an Education and Learning Project Timeline KPI Dashboard in Excel comes into play.
In this comprehensive guide, you’ll learn everything about this ready-to-use dashboard—from its benefits and structure to best practices and FAQs. Whether you’re an educator, school administrator, or project manager, this tool can help you stay on top of every milestone with confidence and clarity.
Click to Purchases Education and Learning Project Timeline KPI Dashboard in Excel
What is an Education and Learning Project Timeline KPI Dashboard?
A KPI (Key Performance Indicator) Dashboard for education and learning timelines is an interactive Excel template that allows you to track project progress, performance targets, and completion metrics. Designed specifically for academic settings, this dashboard helps you visualize monthly and yearly performance, spot delays, and compare progress against targets.
Rather than juggling multiple spreadsheets, this dashboard consolidates everything you need—targets, actuals, trends, and definitions—in one easy-to-use Excel workbook.
Key Features of the Project Timeline KPI Dashboard
Let’s break down the core structure of this dashboard. The template includes 7 powerful worksheet tabs, each designed with a specific purpose:
Home Sheet – The Navigation Hub
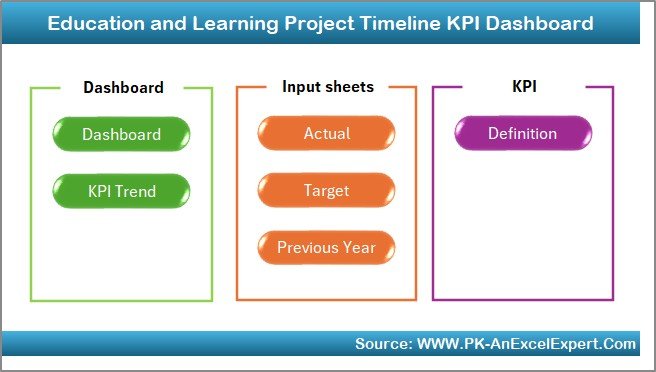
The Home sheet acts like the control center. It includes 6 clickable buttons that navigate to the most important sections of the workbook, making it user-friendly and intuitive for all users.
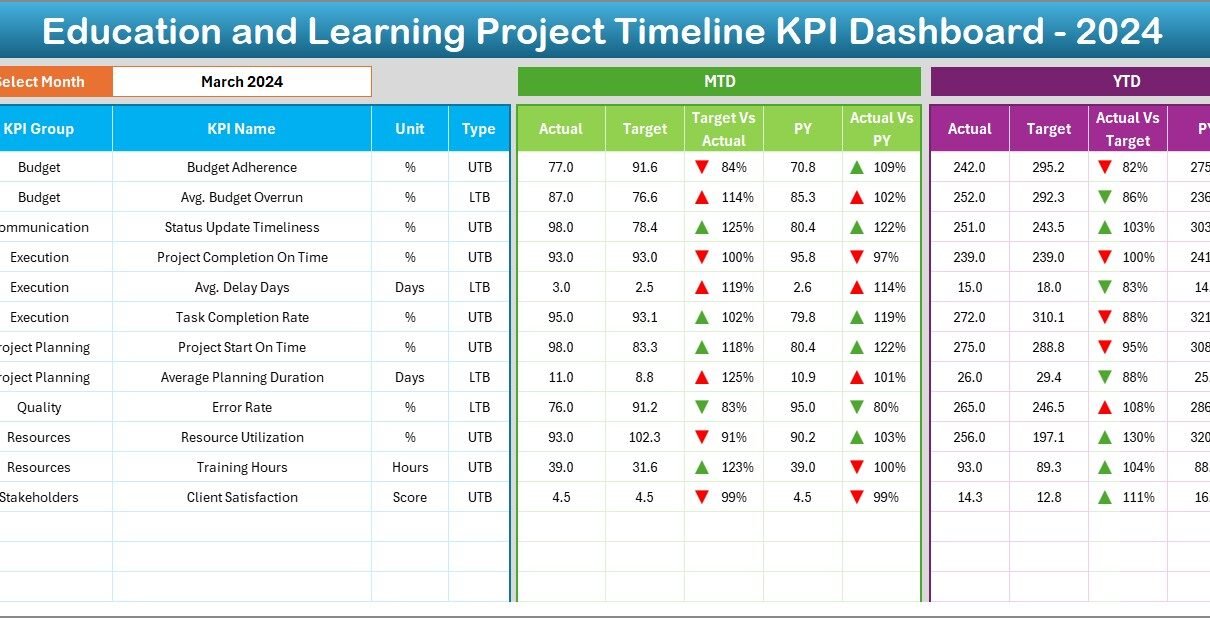
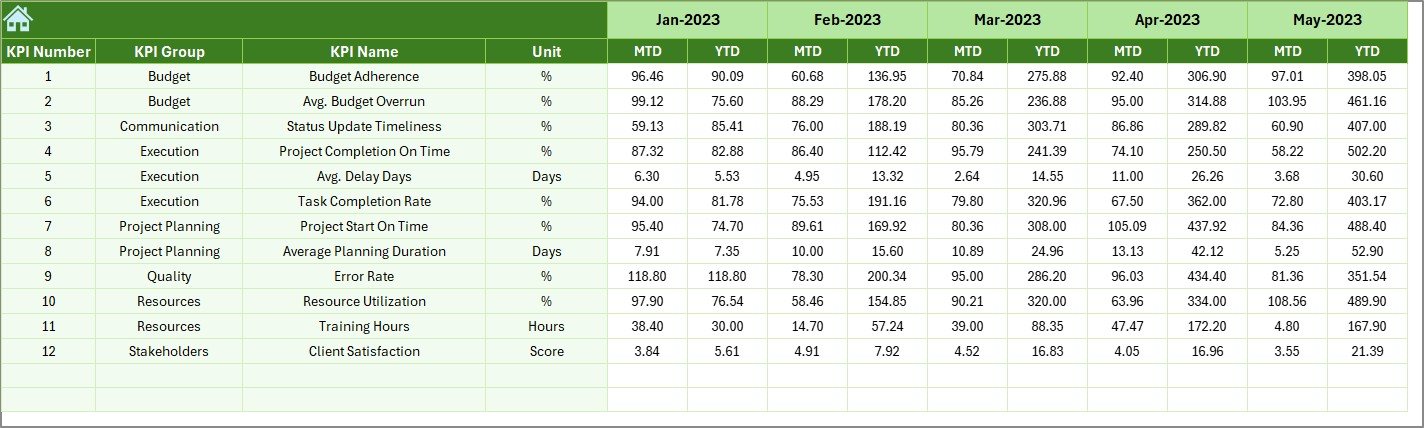
Dashboard Sheet – The Visual Summary
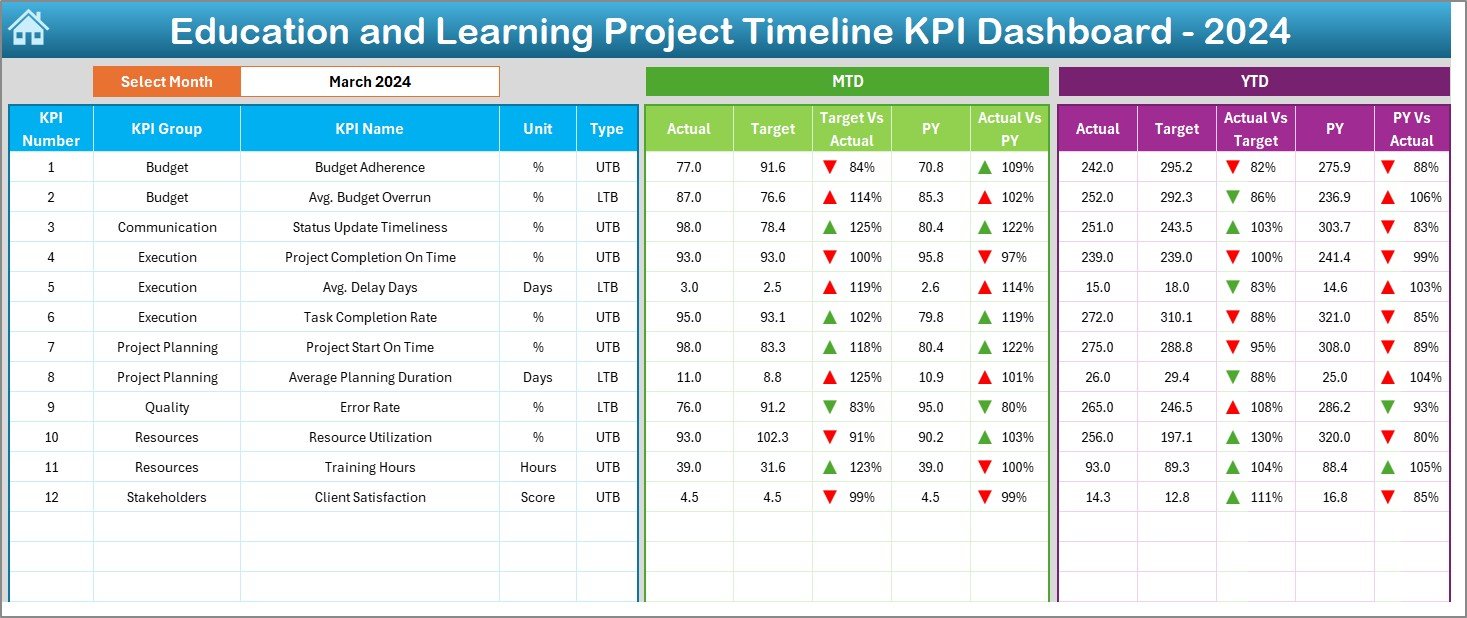
This is the heart of the KPI dashboard. From this tab:
-
Select a month using the dropdown in cell D3
-
View MTD (Month-To-Date) and YTD (Year-To-Date) data
-
Instantly compare Actuals, Targets, and Previous Year (PY) data
-
Visual indicators (arrows) show whether you’re on track or off-track
KPI Trend Sheet – Analyze Progress Over Time
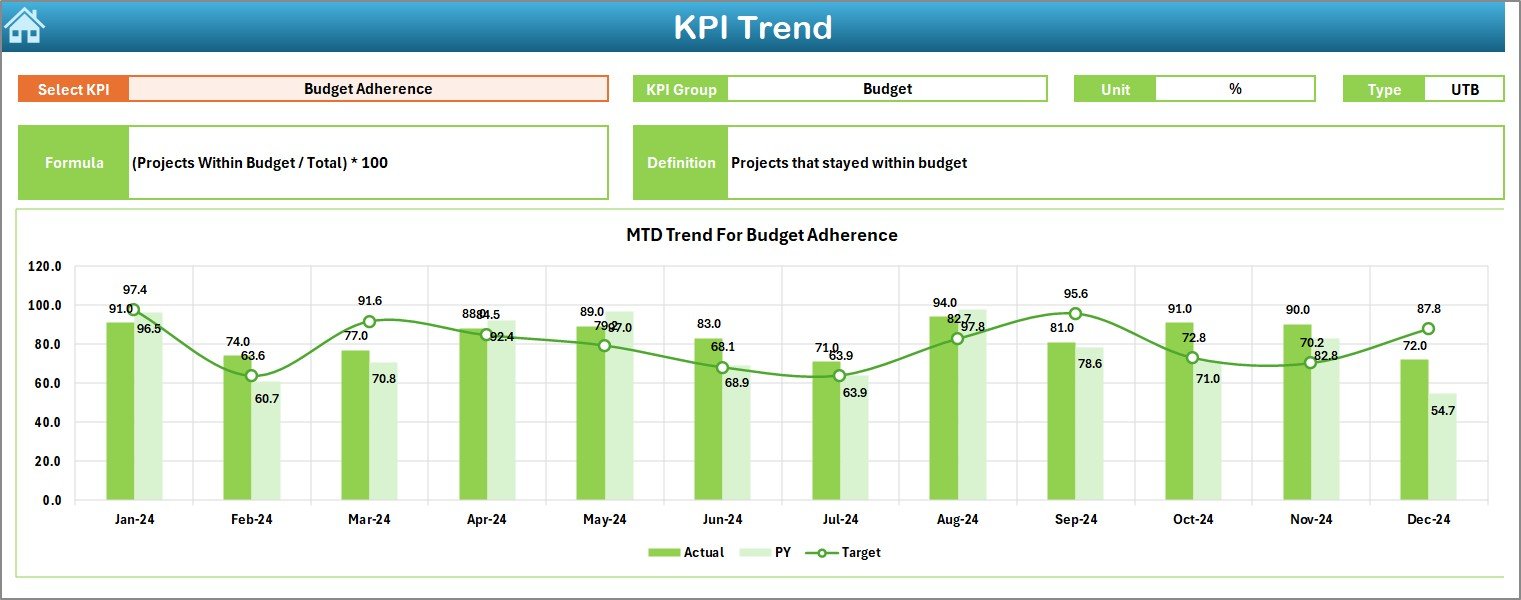
In this dynamic tab:
-
Choose a KPI from the dropdown in cell C3
Review a detailed breakdown including:
Click to Purchases Education and Learning Project Timeline KPI Dashboard in Excel
- KPI Name
- KPI Group
- Unit of Measurement
- Type (UTB or LTB)
- Formula and Definition
-
Analyze MTD and YTD trends with engaging visual charts
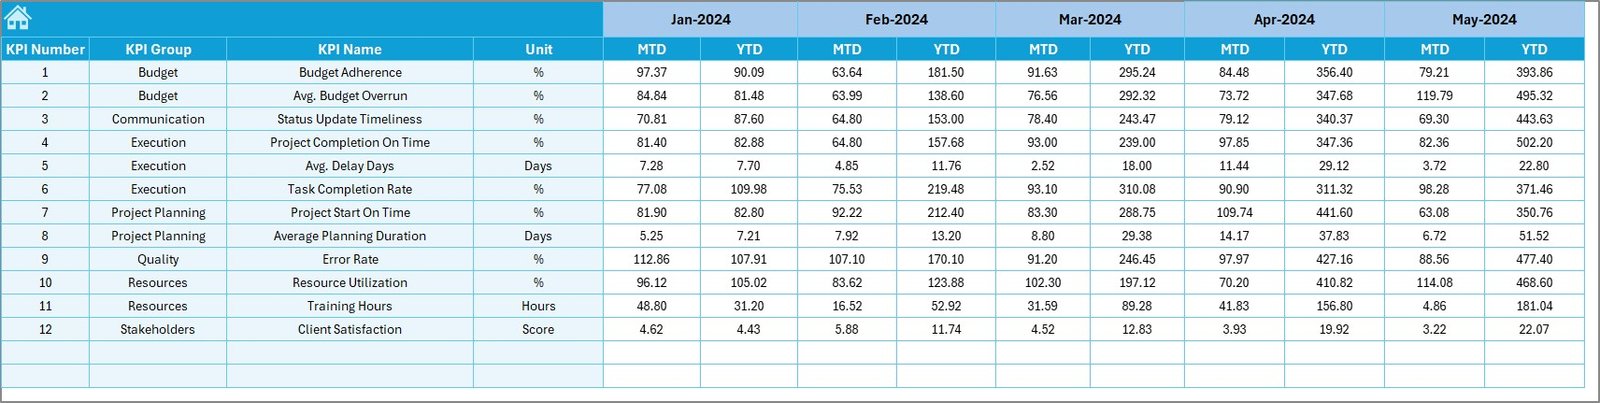
Actual Numbers Input – Input Your Data
Use this tab to input the actual performance numbers. You only need to set the starting month in cell E1, and the dashboard automatically adjusts to reflect changes.
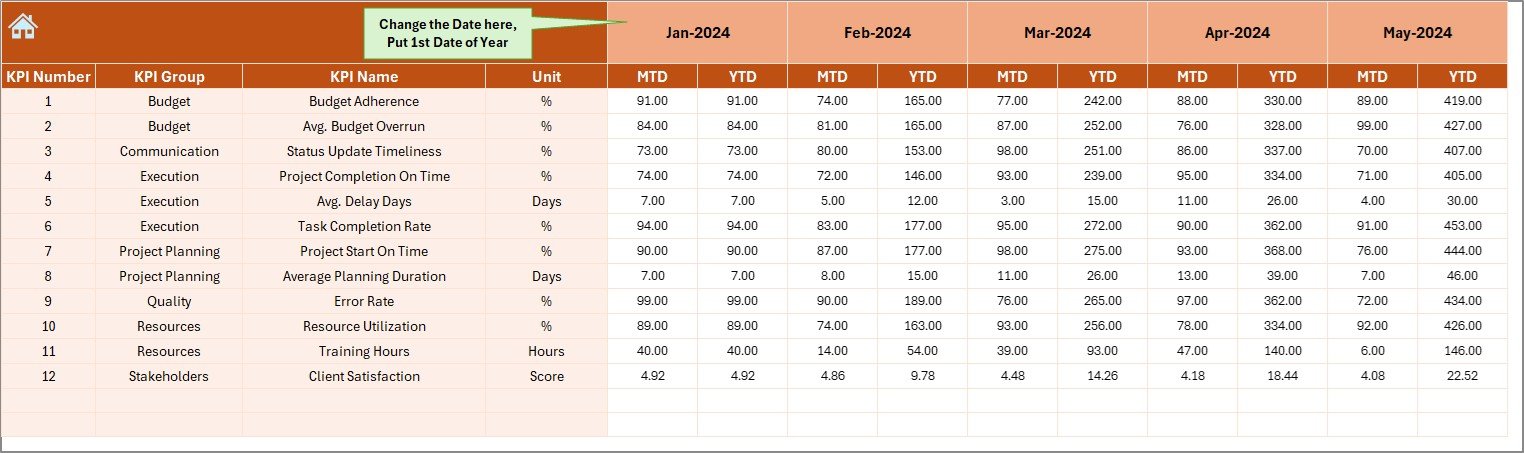
Target Sheet – Set Monthly and Annual Goals
Record both MTD and YTD target values for each KPI by month. This helps track project goals effectively.
Previous Year Numbers – Benchmarking Tool
Enter previous year values here to evaluate current performance against historical data, enabling trend analysis and better forecasting.
KPI Definition Sheet – Reference for Clarity
Click to Purchases Education and Learning Project Timeline KPI Dashboard in Excel
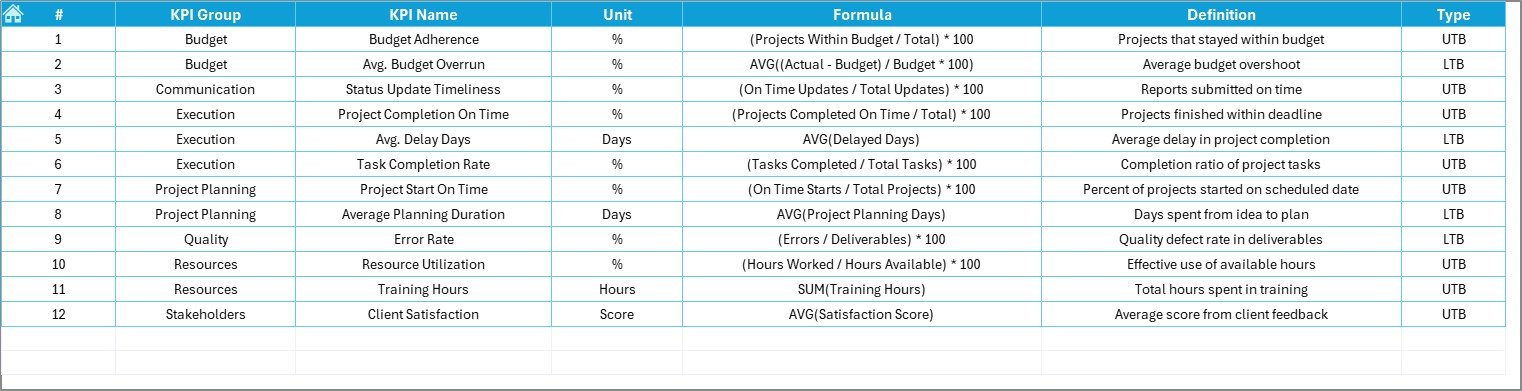
This is your glossary. Each KPI entry includes:
-
KPI Name
-
Group
-
Unit
-
Formula
-
Clear definition
Advantages of Using This KPI Dashboard in Excel
Now that we’ve reviewed the layout, let’s explore why this tool is so powerful:
📊 Centralized Performance Tracking
Track all your KPIs in one location—no more scattered files or manual compilation.
⏱ Real-Time Timeline Insights
See exactly where you stand every month with MTD and YTD metrics and how they compare to targets and previous years.
📈 Interactive Charts and Visual Feedback
Conditional formatting (like up and down arrows) makes it easy to spot improvements or issues at a glance.
📘 Clear KPI Documentation
With the built-in definitions sheet, your team can stay aligned on what each KPI means and how it’s calculated.
📥 Easy Data Entry
The input structure is simple and intuitive. Whether it’s current performance or target setting, data entry takes minutes.
🔁 Historical Comparison
The ability to compare performance against previous years makes this a powerful benchmarking and improvement tool.
Best Practices for the Education and Learning Project Timeline KPI Dashboard
Click to Purchases Education and Learning Project Timeline KPI Dashboard in Excel
To make the most of this dashboard, follow these recommended practices:
1. Keep KPI Definitions Clear and Concise
Use short formulas and definitions in the KPI Definition sheet. This helps all users understand the indicators quickly.
2. Update Data Monthly
Don’t wait until year-end. Set a monthly reminder to input MTD/YTD actuals and track progress regularly.
3. Use Consistent Units
Ensure that each KPI follows the same unit of measurement throughout the dashboard (e.g., % for completion rate, days for delay).
4. Stick to SMART KPIs
Make sure your KPIs are Specific, Measurable, Achievable, Relevant, and Time-bound for more actionable insights.
5. Train Your Team
Even though the dashboard is simple, a quick walkthrough with your team ensures smooth usage and data accuracy.
6. Benchmark with Previous Year Data
Utilize the “Previous Year Numbers” sheet consistently. This provides powerful comparative analysis that highlights real progress.
💡 Tips for Customizing This Dashboard
-
Change KPI Groups based on your institution’s priorities (e.g., STEM programs, E-learning initiatives).
-
Insert Logo and Theme Colors on the Home sheet to match your brand.
-
Add New Charts to highlight problem areas or success stories.
-
Include Conditional Formatting rules to visually flag underperforming KPIs.
Why Use Excel for KPI Tracking in Education?
You might be wondering—why Excel when there are so many online tools available? Here’s why Excel remains a favorite:
✅ Universal Tool
Almost everyone already has Excel installed, so there’s no need for special software.
🛠 Highly Customizable
Unlike rigid platforms, you can tailor this Excel dashboard to your exact needs—without writing a single line of code.
📂 Offline Accessibility
Work without internet access and still have full dashboard functionality.
💰 Cost-Effective
No subscriptions. One-time setup gives you full ownership of the tool.
Conclusion
Managing multiple educational projects can get overwhelming. But with the Education and Learning Project Timeline KPI Dashboard in Excel, you gain structure, clarity, and control. This tool empowers educators and administrators to make informed decisions, stay aligned with goals, and ensure nothing slips through the cracks.
The dashboard is more than just a template—it’s a strategic companion for anyone involved in educational project management.
So, if you want your projects to run on time, stay within budget, and exceed expectations—this is the dashboard you need.
Frequently Asked Questions (FAQs)
1. Who can use this Project Timeline KPI Dashboard?
Anyone managing educational initiatives—school administrators, academic coordinators, project managers, or consultants—can use this dashboard to monitor timelines and performance.
2. Can I customize the KPIs in the dashboard?
Yes! You can edit the KPI Definition sheet to add or modify KPIs based on your institution’s specific needs.
3. How often should I update the data?
It’s best to update the dashboard monthly. Just add MTD and YTD values to the input sheets and watch the dashboard update automatically.
4. Is Excel enough for managing educational projects?
Absolutely. Excel provides flexibility, visual power, and simplicity—all key ingredients for managing small to medium-scale projects efficiently.
5. What makes this dashboard better than using multiple spreadsheets?
Instead of jumping between different files, this dashboard brings all project timeline KPIs into one centralized, interactive, and automated file.
6. Can I share this dashboard with my team?
Click to Purchases Education and Learning Project Timeline KPI Dashboard in Excel
Yes. You can share the Excel file via email or shared drives. Make sure only authorized team members update the data to maintain accuracy.
Visit our YouTube channel to learn step-by-step video tutorials