The Contract Manufacturing Dashboard in Excel tracks 5 executive KPIs — Total Contract Value, Total Production Cost, Total Qty Produced, Avg. Quality Score, and Total Records — across 5 interactive analysis pages powered by 15+ charts and multiple slicers. Setup takes under 10 minutes, every chart refreshes automatically from pivot tables, and it replaces $99-450/user/month MRP SaaS subscriptions like Katana and MRPeasy with a single $17.99 one-time purchase.
🌍 Join 8,400+ teams in 40+ countries using NextGenTemplates to replace paid SaaS manufacturing tools with one-time-purchase templates. ✅ Instant download · One-time payment · No subscription.
Contract Manufacturing Dashboard
Introduction
Contract manufacturers and OEM partners live between two worlds — they own the plant floor but don’t own the product, meaning every decision has to balance contract economics against production reality. Most MRP software is built for brand-owners, not contract shops, and the gap between what a plant manager actually needs to see and what Katana or MRPeasy charges $450 per user per month to show is where this dashboard earns its keep.
The Contract Manufacturing Dashboard in Excel is built for that exact use case: track contract value and production cost side-by-side, flag defect hotspots by line, monitor delivery status per client, and reconcile net profit per OEM partner — all inside a single Excel file. In this guide, we walk through every page, every KPI, and every chart, and we’ll show how this template stacks up against Google Sheets alternatives and paid MRP SaaS.
Key Features of Contract Manufacturing Dashboard in Excel
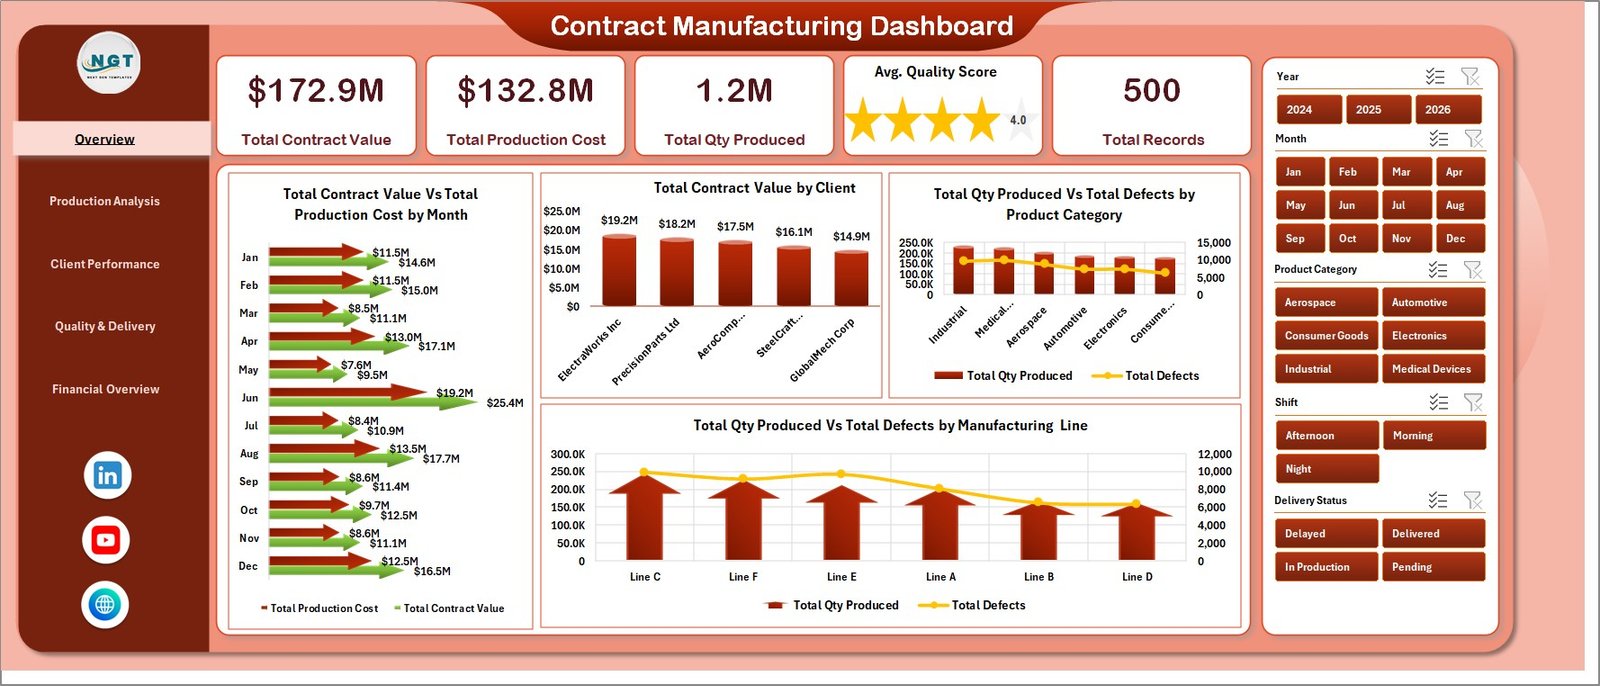
📊 5 Executive KPI Cards at the top of the Overview page: Total Contract Value, Total Production Cost, Total Qty Produced, Avg. Quality Score, and Total Records. These summarize your entire production book in a single glance.
🎛️ Multi-Slicer Filtering across every page. Slicers let you filter by Client, Product Category, Manufacturing Line, Shift, and Payment Status — and the entire dashboard reflows without touching a single formula.
📈 15+ Pre-Built Charts across Production, Client Performance, Quality & Delivery, and Financial Overview pages. Every chart is powered by a pivot table on the hidden Support sheet, so refreshing is a one-click operation.
🔄 Pivot-Driven Architecture. Update the Data sheet, click Data → Refresh All on the Excel ribbon, and all pivots + charts + slicers on all 5 pages update in seconds. No VBA, no formulas to drag down, no named ranges to maintain.
🏭 Contract-Manufacturer-Specific Metrics: Contract Value vs. Production Cost by Month / Year / Category, Defect Rate % by Manufacturing Line, Net Profit by Client, Quality Score by OEM partner. These are the metrics plant managers at tier-1 and tier-2 shops actually care about.
Dashboard Pages Explanation
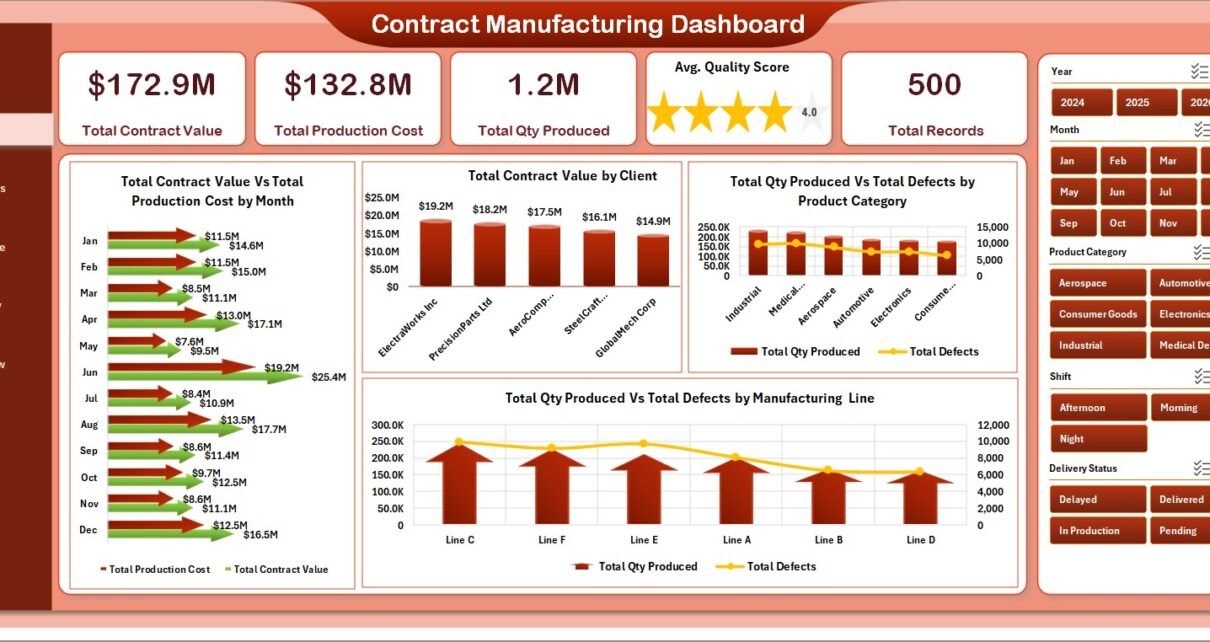
1. Overview Page
The landing page. Five KPI cards run across the top showing Total Contract Value, Total Production Cost, Total Qty Produced, Avg. Quality Score, and Total Records — followed by four executive charts:
📊 Total Contract Value Vs Total Production Cost by Month tracks revenue against cost each month so margin compression shows up immediately. 🏢 Total Contract Value by Client ranks every OEM partner by contract value so you can see which clients carry the book. 🔩 Total Qty Produced Vs Total Defects by Product Category pairs output volume with defect counts per category, surfacing quality hotspots. ⚙️ Total Qty Produced Vs Total Defects by Manufacturing Line does the same cut by line, so floor supervisors can target underperforming cells.
2. Production Analysis
Production Analysis
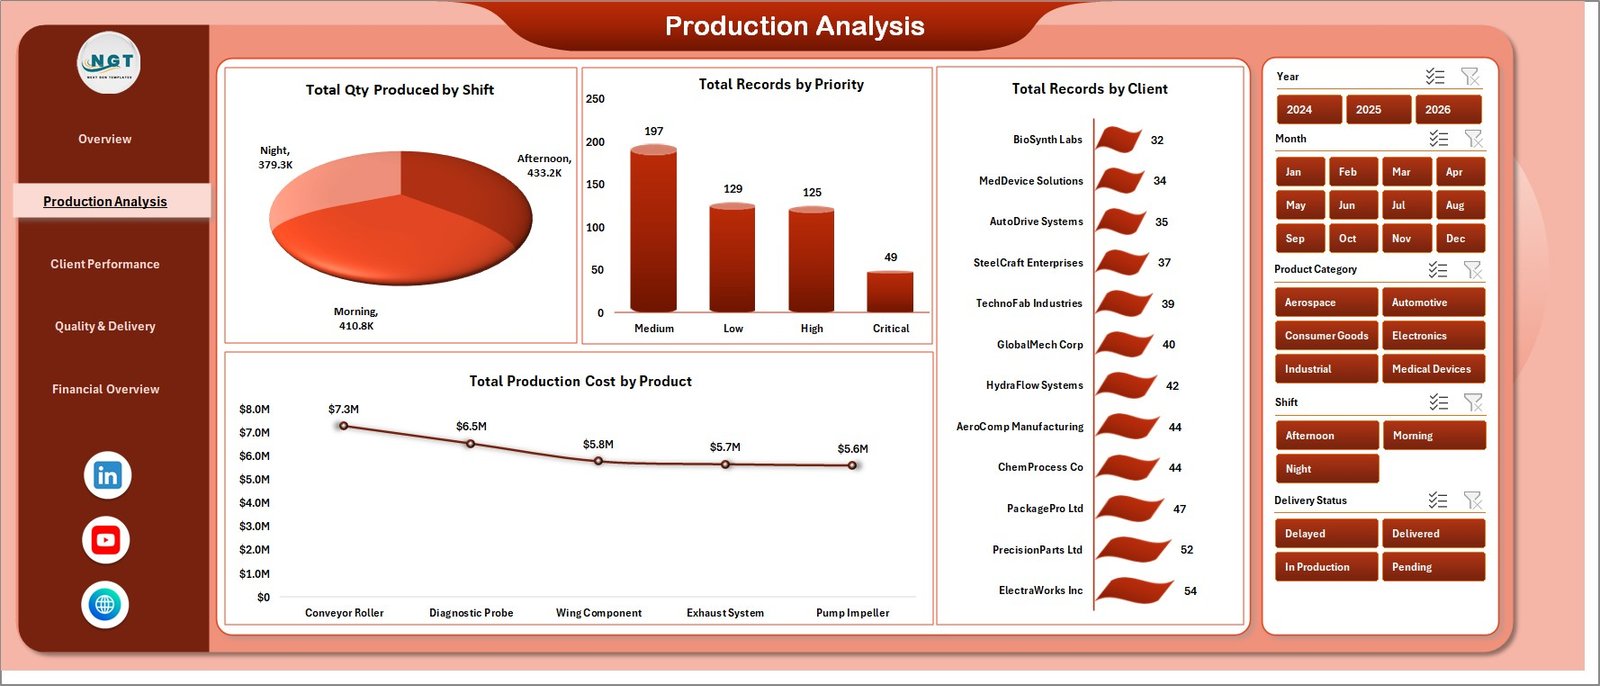
This page answers: when, who, and what cost the most to make? Charts cover 🕐 Total Qty Produced by Shift (night shift vs. day shift output), 🚦 Total Records by Priority (how much of your book is rush/urgent?), 🏭 Total Records by Client (which clients consume the most order throughput), and 💵 Total Production Cost by Product (which SKUs eat the cost budget).
3. Client Performance
Client Performance
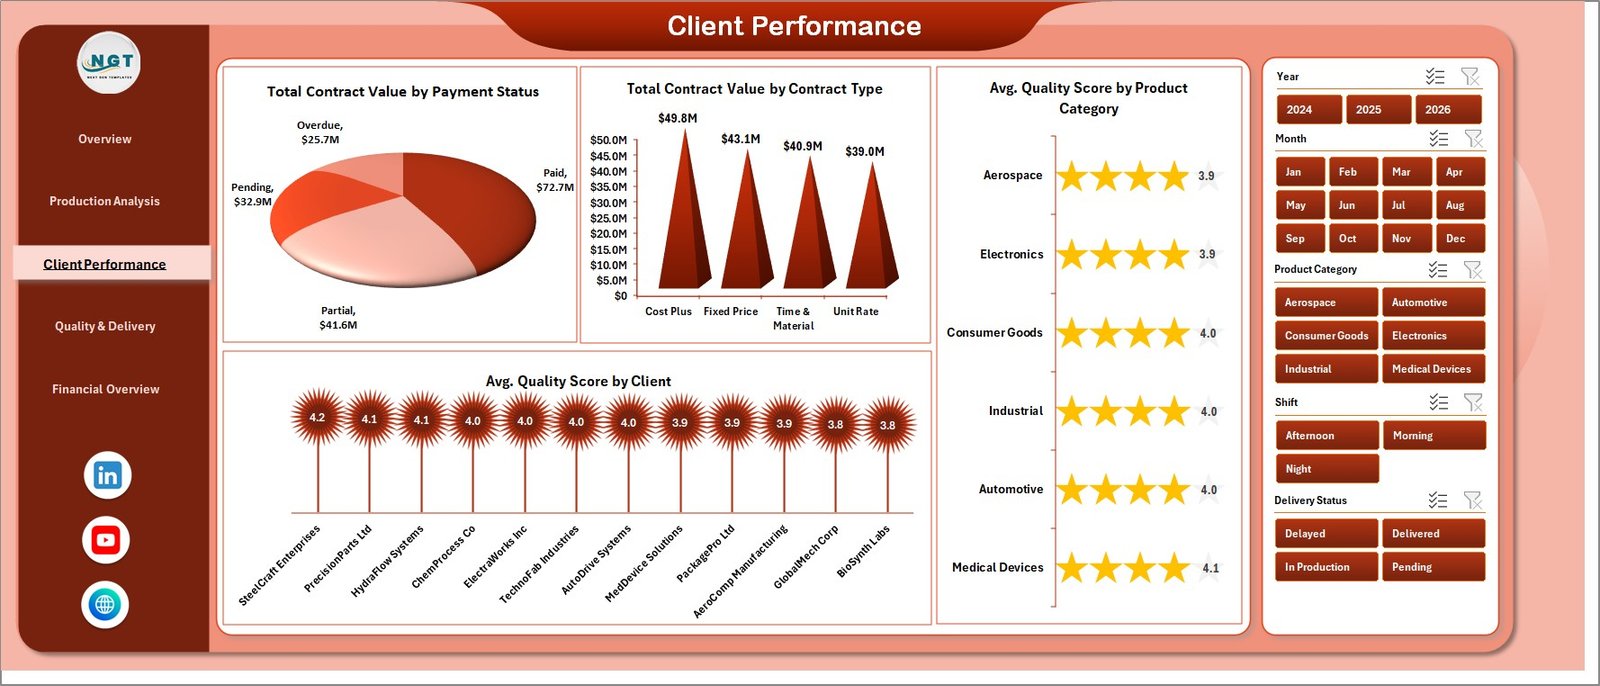
Client-centric view. 💳 Total Contract Value by Payment Status shows exposure across Paid / Pending / Overdue buckets. 📝 Total Contract Value by Contract Type splits fixed-price vs. cost-plus vs. time-and-material. 🎯 Avg. Quality Score by Product Category and ⭐ Avg. Quality Score by Client let you see whether a specific client or category is dragging overall quality down.
4. Quality & Delivery
Quality & Delivery
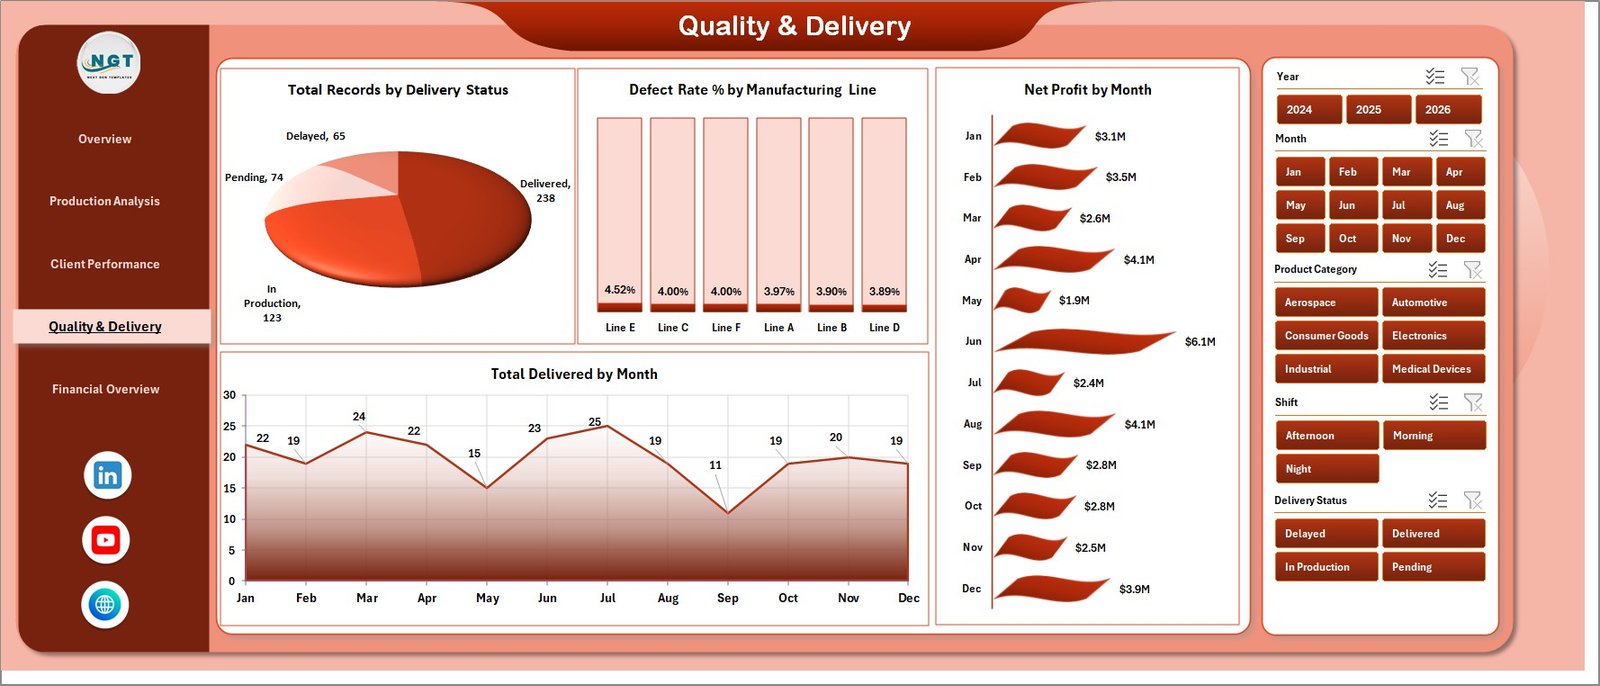
Operations page. 🚚 Total Records by Delivery Status (On Time / Delayed / In Transit / Delivered). ❌ Defect Rate % by Manufacturing Line is the page’s headline chart — it’s how you spot which line needs re-calibration. 📈 Net Profit by Month shows the financial trend. ✅ Total Delivered by Month closes the loop between production and fulfillment.
5. Financial Overview
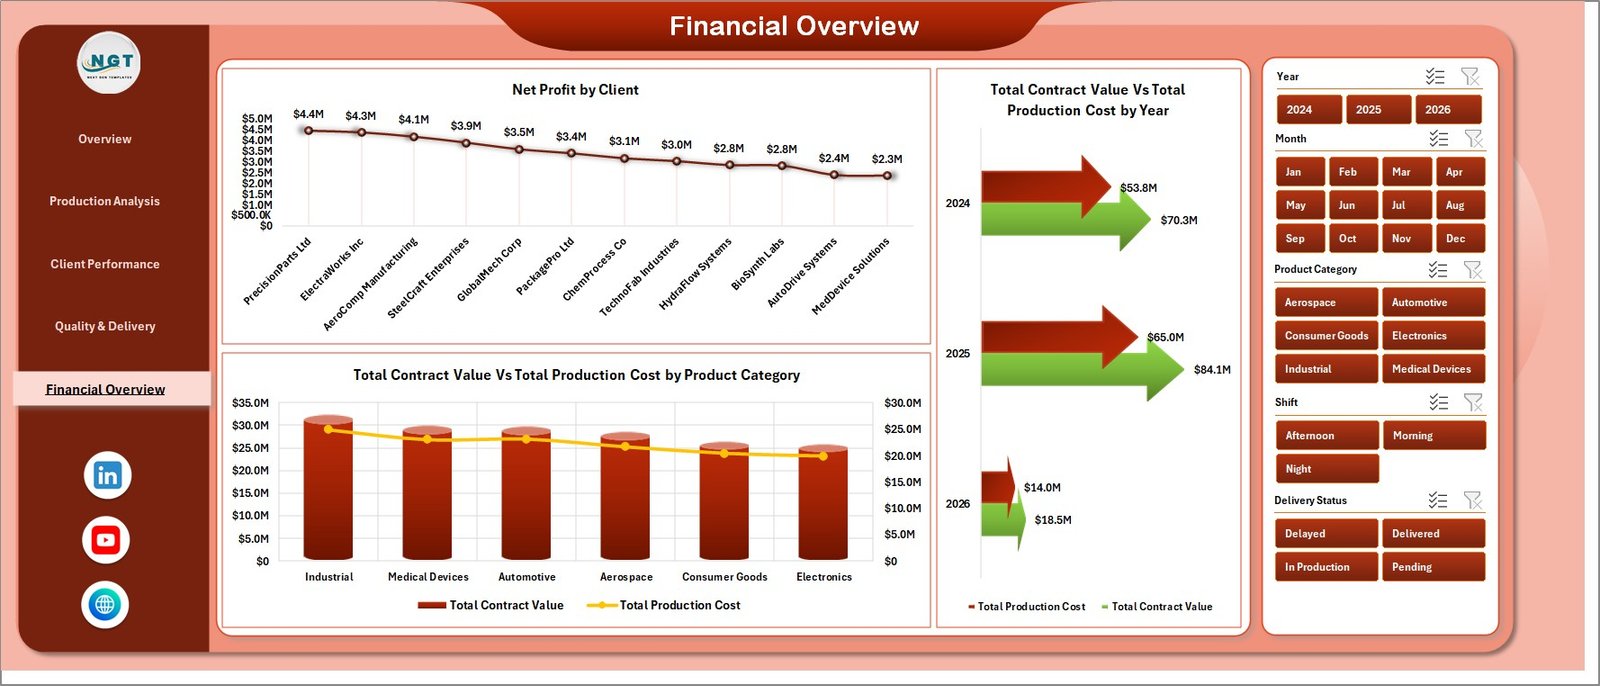
Financial Overview
CFO page. 💰 Net Profit by Client ranks OEM partners by contribution. 📊 Total Contract Value Vs Total Production Cost by Year shows multi-year margin trajectory. 🏷️ Total Contract Value Vs Total Production Cost by Product Category tells you which categories are margin-accretive and which are loss leaders.
6. Data Sheet
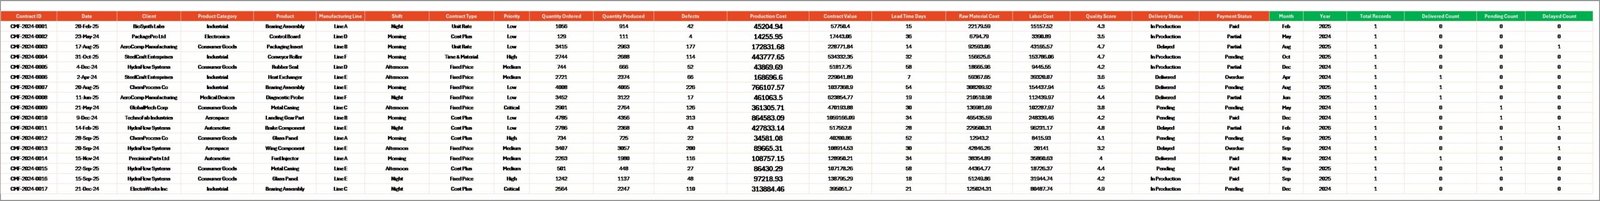
Data Sheet tab
This is the input layer. Replace sample records with your production orders — Contract Value, Production Cost, Qty Produced, Defects, Quality Score, Client, Shift, Line, Payment Status, Delivery Status, Contract Type. Keep the column structure intact and every pivot will pick up the new rows.
7. Support Sheet
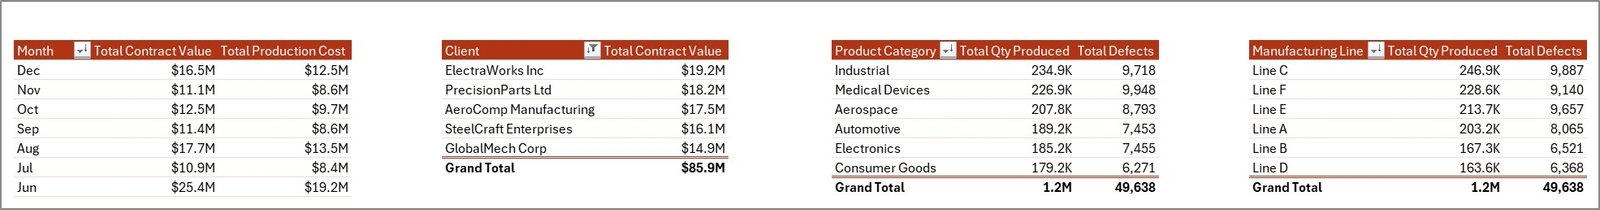
Support sheet tab
Hidden pivot engine. Every chart on every page is linked to a pivot table on this sheet. After updating the Data sheet, open the Data tab on the Excel ribbon and click Refresh All — all pivots refresh, all charts update, and all slicers re-index in seconds. Keep this sheet hidden in production so end users only see polished output.
Contract Manufacturing Dashboard in Excel vs. Google Sheets Equivalent vs. Paid MRP SaaS — Feature Comparison
| Feature | Contract Manufacturing Dashboard in Excel | Google Sheets Equivalent | Katana / MRPeasy / Fishbowl |
|---|---|---|---|
| Cost | $17.99 one-time | $15-20 one-time | $99-450 / user / month |
| Platform | Microsoft Excel (offline) | Google Sheets (cloud) | Cloud SaaS |
| Setup time | Under 10 minutes | Under 10 minutes | 2-6 weeks onboarding |
| Multi-slicer filtering | ✅ Yes — every page | Limited (pivot-only slicer) | ✅ Yes |
| Offline access | ✅ Yes | ❌ No | ❌ No |
| Custom fields / columns | ✅ Fully editable | ✅ Fully editable | Limited by plan tier |
| Per-user licensing | ✅ None | Google account needed | Required |
| Year-1 cost at 5 users | $17.99 | $15-20 | $5,940 – $27,000 |
| Defect Rate & Quality tracking | ✅ Built-in | ✅ Built-in | ✅ Yes |
For contract manufacturers and OEM partners that want enterprise-grade KPI visibility without paying Katana or MRPeasy subscription fees, the Contract Manufacturing Dashboard in Excel sits in the sweet spot.
Who Should Use This Template
Perfect for:
- Contract manufacturers and OEM partners producing for 3-50 client accounts
- Plant managers tracking daily production, quality, and client profitability
- Operations leaders replacing per-seat SaaS with one-time-purchase analytics
- Finance teams reconciling contract value vs. production cost across clients
- Fractional COOs and manufacturing consultants serving multiple clients
Not a fit if:
- You need real-time MES / SCADA integration (use paid MRP instead)
- You need multi-user concurrent editing (switch to the Google Sheets equivalent)
- You process millions of records per month — Excel’s row limit becomes a constraint
Real-World Use Cases
Raj runs a contract electronics assembly plant outside Pune with 12 OEM clients. He pulls production orders into the Data sheet every Friday, refreshes the dashboard, and uses the Client Performance page to flag clients whose Avg. Quality Score has dropped below his 95% threshold. He then uses the Quality & Delivery page’s Defect Rate % by Manufacturing Line chart to target the specific line needing re-calibration — all without paying ₹40,000/month for a Katana subscription.
Maria manages contract packaging for a food manufacturer in São Paulo. Her workflow: Monday morning she exports production data from SAP, pastes into the Data sheet, clicks Refresh All, and screen-shares the Financial Overview page with leadership. Net Profit by Client ranks her 8 OEM partners by contribution; Total Contract Value vs. Production Cost by Product Category tells leadership which categories to push for contract renegotiation.
David is a fractional COO advising three mid-size contract manufacturers. He uses the same dashboard file for each client, customizing slicers and client lists on the Data sheet per engagement. One $17.99 Excel file replaces three separate paid MRP subscriptions and gives him a consistent analytical framework across all three clients.
Advantages of Contract Manufacturing Dashboard in Excel
💰 Cost savings of $5,000 to $27,000 per year vs. paid MRP SaaS at a 5-user team. This alone pays for the license in the first week.
⚡ Sub-10-minute setup — no 2-6 week onboarding like Katana or MRPeasy. Replace sample data, click Refresh All, you’re live.
📴 Works offline — no cloud dependency, no “service unavailable” when your shop floor’s internet drops. Critical for contract manufacturers in regions with unstable connectivity.
🔧 Full customization — add columns, rename clients, create new slicers. Compare this to MRP SaaS where schema changes require vendor support tickets.
📚 Backed by Microsoft’s native documentation — if you need to extend anything, every Excel feature used here (pivots, slicers, charts) is documented on Microsoft Support’s PivotTable guide.
Opportunities for Improvement
Being honest: this template has constraints. Excel’s row limit is 1,048,576 rows, which sounds like plenty until you’re running a high-volume packaging contract at 40,000 records/month — you’d hit the ceiling in under 2 years. For that scale, move to the Power BI equivalent or a database-backed solution.
No real-time MES / SCADA feeds — data entry is manual (or from your ERP export). If your operations team needs minute-by-minute line telemetry, MRP SaaS is the right tool and this dashboard complements it rather than replacing it.
Single-user editing at any given moment — Excel doesn’t support concurrent editing the way Google Sheets does. If your team needs simultaneous updates, consider the Google Sheets dashboard equivalent.
Best Practices
🔒 Lock the Support sheet and keep it hidden so end users don’t accidentally break pivot structures.
📝 Paste production data as values from your ERP export — avoid linking external workbooks which can break if file paths change.
🔄 Make “Refresh All” part of the Monday-morning routine so leadership reviews fresh data each week.
📂 Version your monthly snapshots — save a copy as “ContractMfg_2026-04.xlsx” at month-end to preserve historical month-over-month comparisons.
📊 Use the Defect Rate % by Manufacturing Line chart weekly — catching line drift early is cheaper than scrap.
Explore Relevant Templates
💎 Save 40% — Get the Manufacturing Excellence Bundle — 8 premium Excel + Power BI manufacturing templates in one pack.
🔩 Automotive Parts Manufacturing Dashboard in Excel — tailored for tier-1 and tier-2 auto suppliers.
🏭 Manufacturing Production Variance Analysis Dashboard in Excel — drill into budget vs. actual production variance.
⚙️ Industrial Automation Equipment KPI Dashboard in Excel — equipment and line-level monitoring.
📅 Manufacturing Production Calendar in Excel — monthly production scheduling.
Also browse our Best Excel Dashboard Templates roundup for more industry-specific dashboards.
Frequently Asked Questions
What KPIs does the Contract Manufacturing Dashboard in Excel track?
The Contract Manufacturing Dashboard in Excel tracks 5 headline KPIs — Total Contract Value, Total Production Cost, Total Qty Produced, Avg. Quality Score, and Total Records — alongside Defect Rate %, Net Profit by Client, and Delivery Status across 5 interactive analysis pages.
How long does setup take?
Setup takes under 10 minutes. Replace the sample rows in the Data sheet with your production records, click Data → Refresh All on the Excel ribbon, and every chart and slicer across all 5 dashboard pages updates automatically — no formulas, no VBA, no named ranges to maintain.
How does this compare to Katana or MRPeasy?
Katana and MRPeasy run $99-450 per user per month and require 2-6 weeks of onboarding. The Contract Manufacturing Dashboard in Excel is a $17.99 one-time purchase with no per-user licensing, no cloud dependency, and full offline access — saving $5,940 to $27,000 per year for a 5-user team.
Can I customize the charts and add new clients or manufacturing lines?
Yes. Every chart is driven by a pivot table on the hidden Support sheet. Add new clients, product categories, or manufacturing lines in the Data sheet, refresh the pivots, and slicers pick up the new values automatically. No VBA or formula editing needed.
Does it work on Mac and Excel Online?
The Contract Manufacturing Dashboard in Excel runs on Excel 2016+ for both Windows and Mac. Slicers and pivot tables also work in Excel Online, though refreshing large pivots is significantly faster in the desktop version. For best performance use Excel 365 or Excel 2021.
Is this suitable for small contract manufacturers and job shops?
Yes — the template is sized for 3-50 client accounts and handles tens of thousands of production records comfortably. Small contract manufacturers, tier-2 suppliers, and job shops get full functionality without paying enterprise MRP pricing.
Is this a subscription or one-time purchase?
One-time purchase — $17.99 today, yours forever. No subscription, no per-user fees, no auto-renewal. Download the Excel file, use it across unlimited projects, and pass it to your team without additional licensing costs.
About the Author
Built by PK — Microsoft Certified Professional with 15+ years of Excel, Google Sheets, and Power BI experience. Founder of NextGenTemplates, reaching 300K+ subscribers across YouTube channels. Every template is hand-built and tested before release.
Conclusion
For contract manufacturers and OEM partners, the gap between “spreadsheet chaos” and “$450/user/month MRP SaaS” is where this dashboard lives. Five pages, 15+ charts, pivot-driven refresh, and sub-10-minute setup — all for $17.99.
👉 Click here to Purchase Contract Manufacturing Dashboard in Excel
✅ Instant download · One-time payment · No subscription · Lifetime access
🎥 Subscribe to Youtube.com/@PK-AnExcelExpert for step-by-step video tutorials on Excel dashboards, VBA, and Power BI.
📅 Last updated: April 2026