Managing a winery requires monitoring dozens of moving parts — from grape harvest volumes and fermentation batch timelines to bottling efficiency and tasting room revenue. According to the Wine Business Institute, wineries that track KPIs systematically report 18–25% faster decision-making compared to those relying on ad-hoc spreadsheets. The Winery KPI Scorecard in Excel provides a structured, ready-to-use solution for tracking 10+ winery-specific KPIs across 4 worksheets, with MTD and YTD trend analysis, color-coded performance indicators, and dropdown-driven filtering — all in a single Excel file.
This scorecard template is designed for winery owners, vineyard managers, operations teams, and wine industry consultants who need a clear performance overview without investing in expensive winery management software. Setup takes under 10 minutes — just replace the sample data with your own numbers and every metric updates automatically.
Key Features of Winery KPI Scorecard in Excel
Click here to Purchase the Winery KPI Scorecard in Excel
The Winery KPI Scorecard in Excel tracks 10+ customizable KPIs across 4 structured worksheets. Each worksheet serves a specific purpose in the performance monitoring workflow, from data entry to trend visualization. Here are the key capabilities that make this scorecard effective for winery performance tracking:
The scorecard displays all KPI performance in a single view with dropdown-driven month selection, MTD and YTD comparisons, actual vs target analysis, and color-coded indicators that flag underperforming metrics instantly. It tracks winery-specific KPIs including grape yield per acre, fermentation efficiency, wine quality score, revenue per bottle, inventory turnover, and distribution fill rate.
The KPI Trend sheet provides individual metric analysis with monthly charts showing Actual, Target, and Previous Year values side by side — making seasonal patterns and year-over-year changes visible at a glance.
Dashboard Pages Explanation
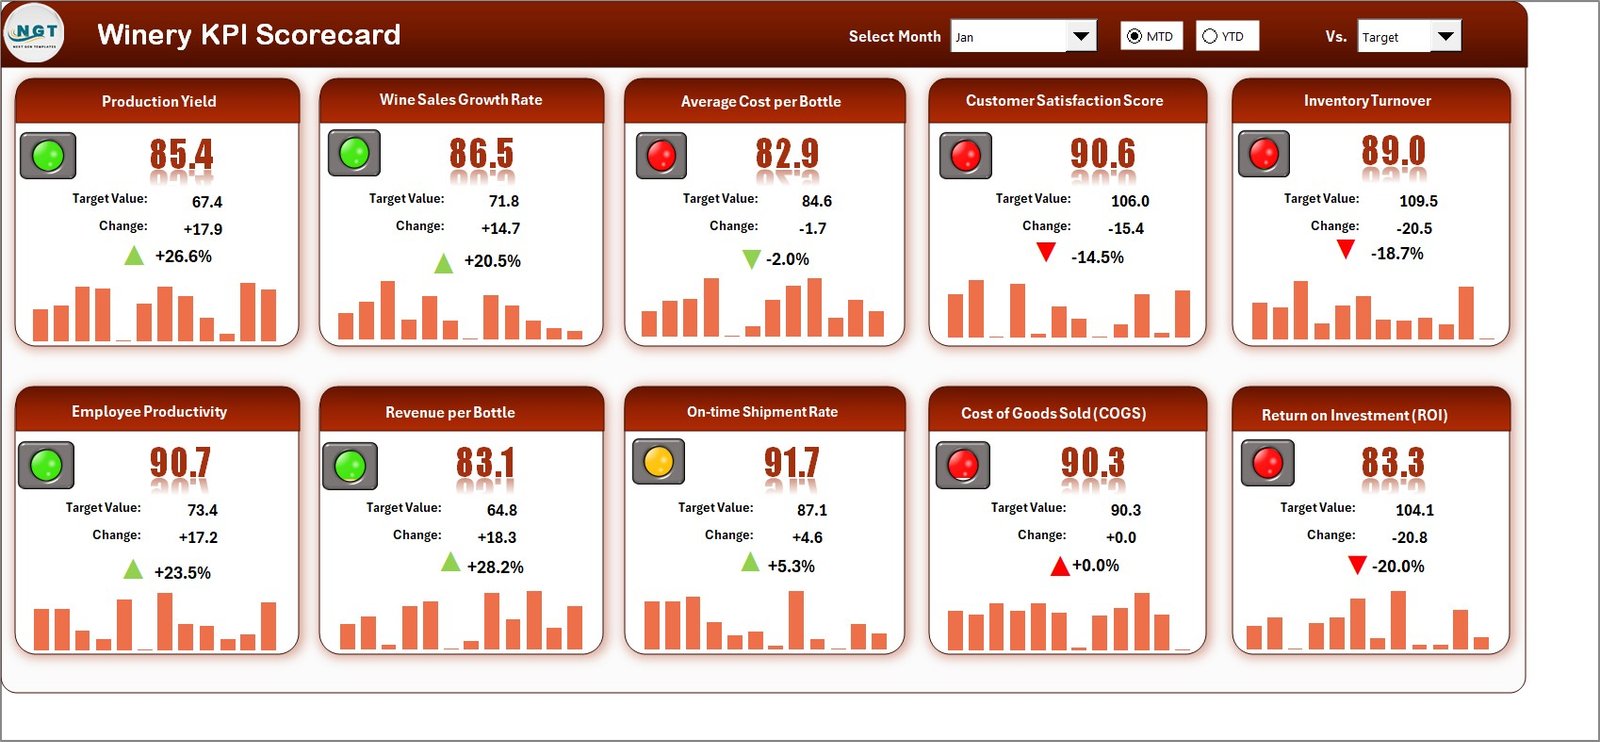
1. Scorecard Sheet
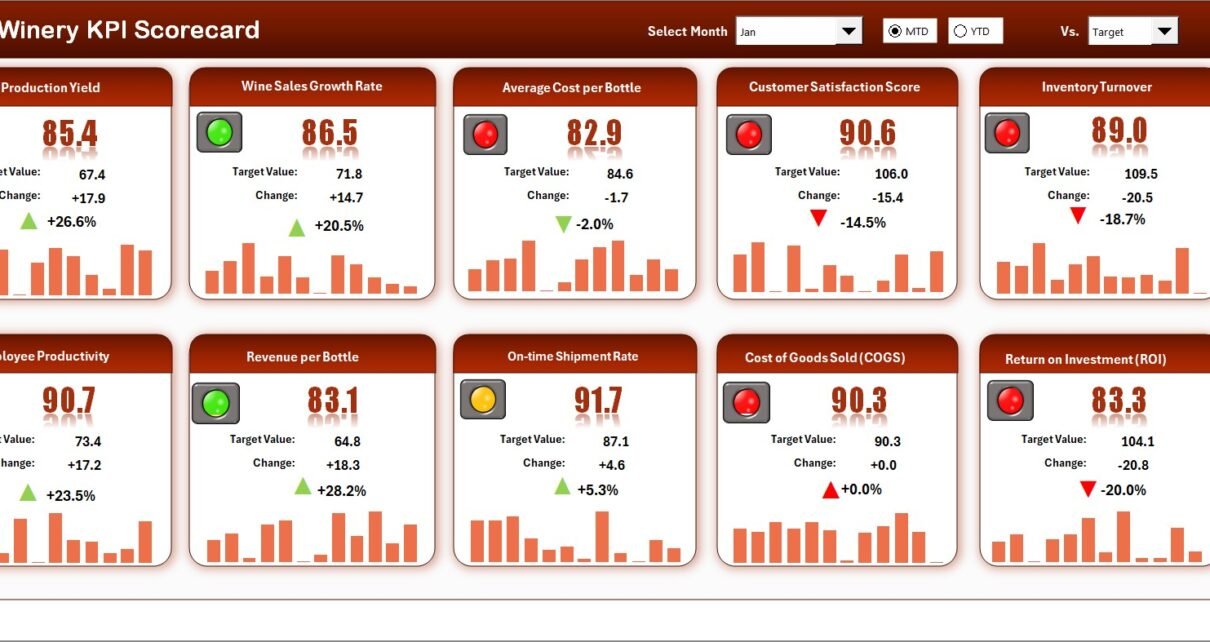
Winery KPI Scorecard in ExcelThe Scorecard sheet is the main interface where you view all KPI performance at once. Key features include dropdown menus to select the month, MTD (Month-to-Date), or YTD (Year-to-Date) for performance analysis. Compare actual performance against targets for each KPI with visual indicators using color-coded conditional formatting. The sheet provides a complete KPI overview including MTD and YTD comparisons with previous year data.
2. KPI Trend Sheet
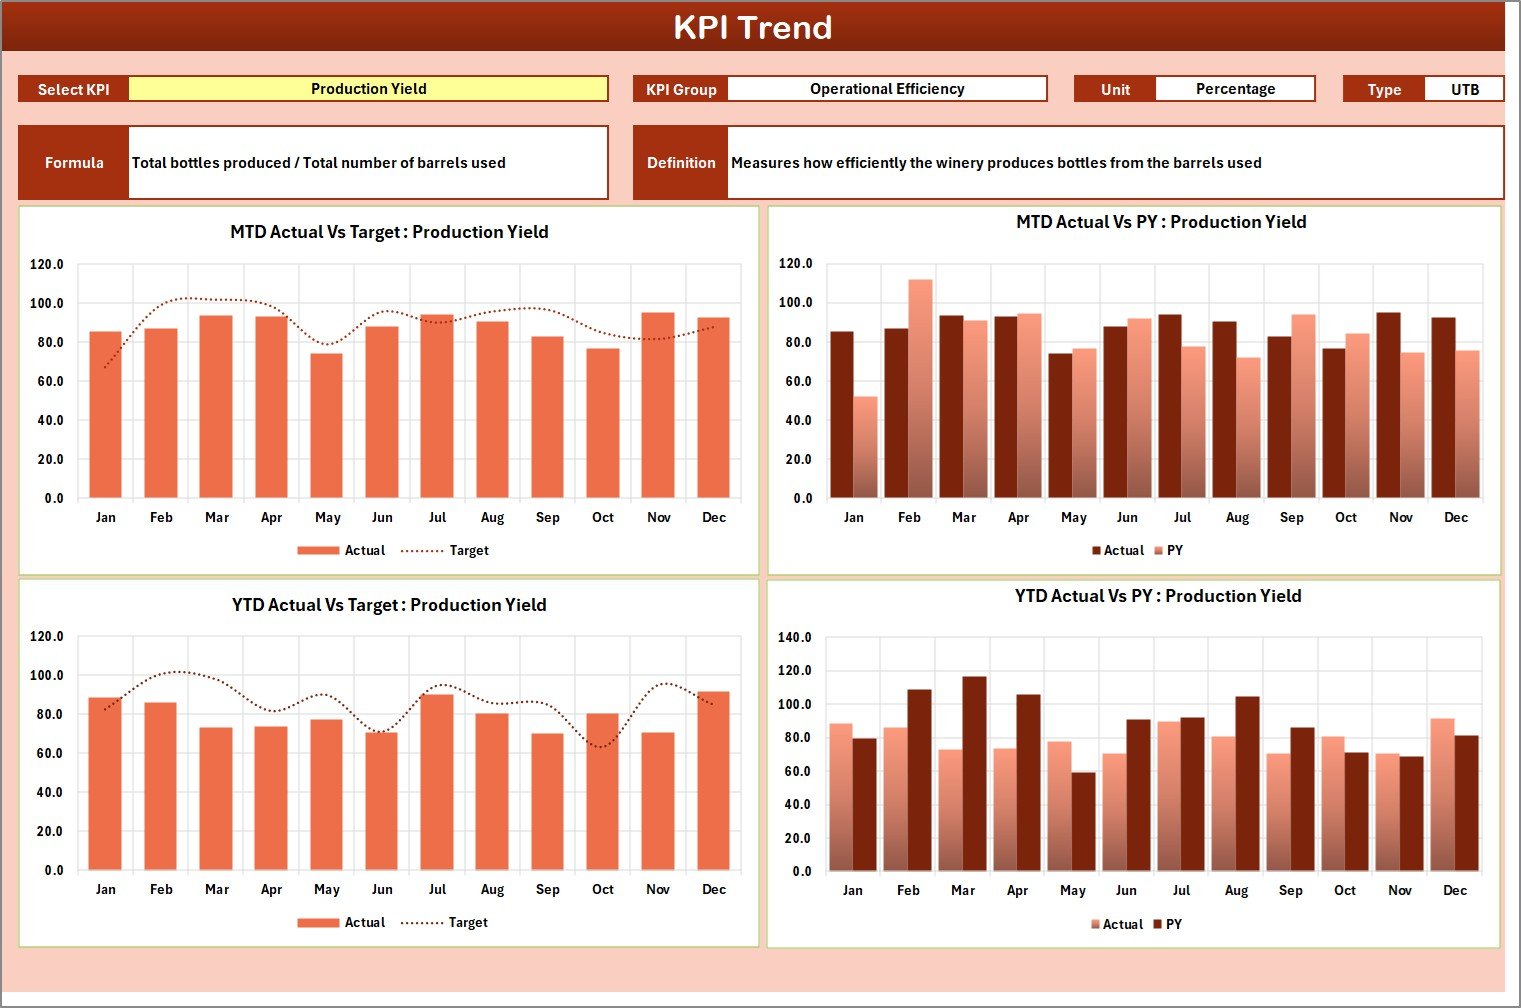 KPI Trend Sheet
Select any KPI name from the dropdown available on range C3. The sheet displays the KPI Group, Unit of KPI, Type of KPI (Lower the Better or Upper the Better), Formula of the KPI, and Definition of the KPI. MTD and YTD trend charts show Actual, Target, and PY numbers for each month, enabling detailed performance analysis over time.
3. Input Data Sheet
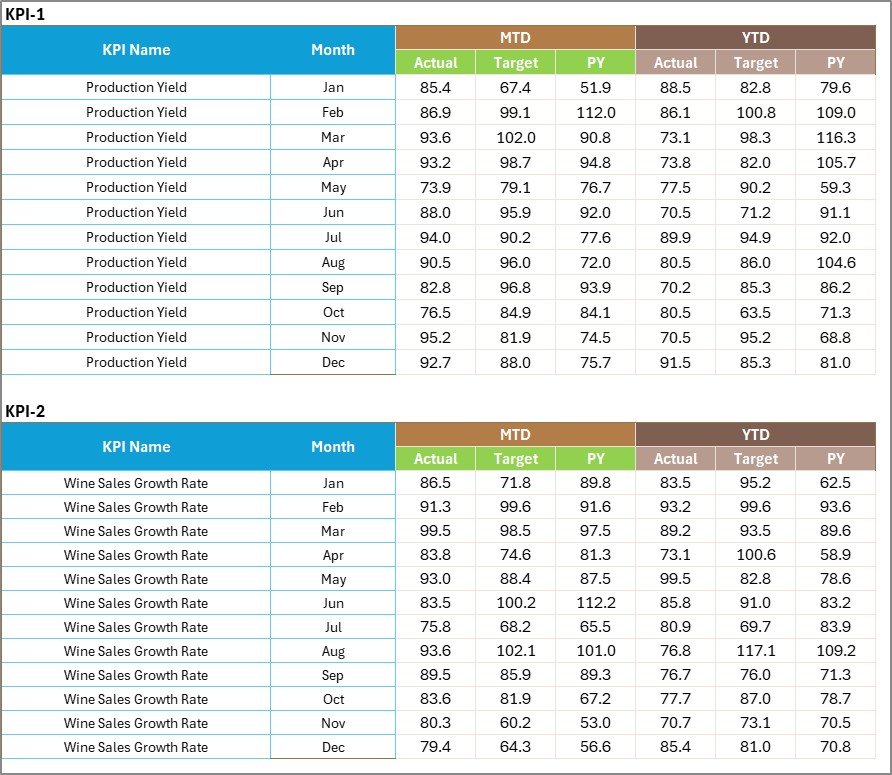 Input Data Sheet
The Input Data sheet is where you enter all KPI data. Record actual values, targets, and other metrics for each KPI. Update data as new results become available, ensuring the scorecard remains current with your latest winery performance numbers.
4. KPI Definition Sheet
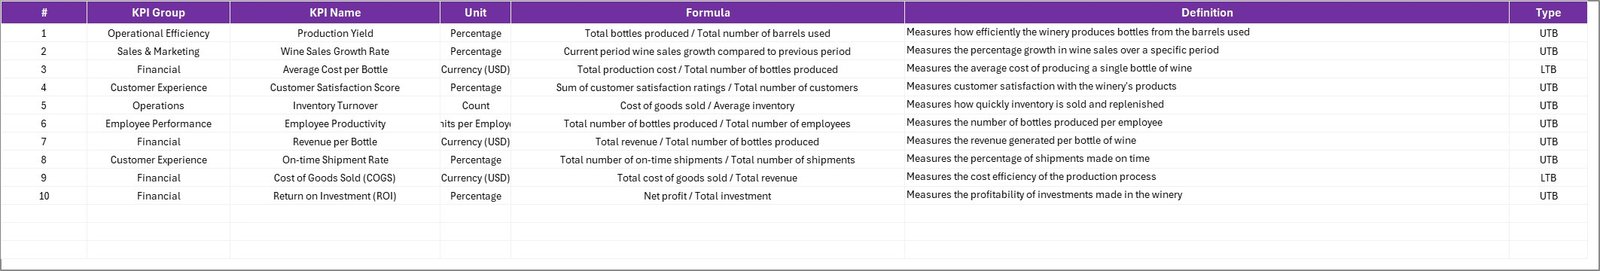 KPI Definition Sheet
In this sheet tab, enter the KPI Name, KPI Group, Unit, Formula, and KPI Definition for each metric. This acts as a centralized reference ensuring all team members understand how each KPI is calculated and what it measures.
Winery KPI Scorecard in Excel vs. Google Sheets Equivalent vs. VinTrace / InnoVint — Feature Comparison
| Feature | Winery KPI Scorecard in Excel | Google Sheets Version | VinTrace / InnoVint |
|---|---|---|---|
| Cost | $12.99 one-time | $9.99 one-time | $200–$500/month |
| Platform | Microsoft Excel (desktop) | Google Sheets (browser) | Cloud SaaS |
| Setup Time | Under 10 minutes | Under 10 minutes | 2–4 weeks |
| Real-Time Team Collaboration | Via SharePoint/OneDrive | Built-in | Built-in |
| Customizable KPIs | Unlimited | Unlimited | Limited to plan |
| Offline Access | Full offline | Limited | No |
| MTD & YTD Trend Analysis | Yes | Yes | Yes |
| Year-1 Cost at 5 Users | $12.99 total | $9.99 total | $2,400–$6,000 |
For wineries that want structured KPI tracking without paying $200+/month for winery management SaaS, the Winery KPI Scorecard in Excel sits in the sweet spot.
Who Should Use This Template
Click here to Purchase the Winery KPI Scorecard in Excel
Perfect for:
- Winery owners and vineyard managers tracking production, quality, and sales KPIs
- Operations managers at small-to-mid-size wineries (1–50 employees)
- Wine industry consultants who need a client-ready performance tracking tool
- Finance teams monitoring cost-per-bottle, revenue, and margin metrics
Not a fit if:
- You need real-time IoT sensor integration with fermentation tanks
- Your winery requires automated TTB/excise tax compliance reporting
- You need multi-location ERP-level inventory management
Real-World Use Cases
Marco manages a 15-acre family vineyard in Napa Valley. He uses the Winery KPI Scorecard in Excel to track grape yield per acre, fermentation batch completion rate, and tasting room revenue per visitor. Each month, he compares actual output against targets and presents the YTD trend charts to his family partners — replacing a manual spreadsheet that took 3 hours to update.
Priya runs operations at a mid-size winery in Maharashtra, India. She tracks 12 KPIs including production volume, quality rejection rate, distribution fill rate, and inventory days on hand. The color-coded scorecard helps her flag underperforming areas in weekly team meetings without building charts from scratch every time.
David consults for three boutique wineries in Willamette Valley, Oregon. He uses the KPI Definition sheet to standardize metrics across all clients, then delivers monthly performance reports using the Scorecard sheet — saving 5+ hours per client compared to building reports manually.
Advantages of Winery KPI Scorecard in Excel
Click here to Purchase the Winery KPI Scorecard in Excel
This scorecard delivers immediate value for winery operations at a fraction of the cost of dedicated winery management software. At $12.99 one-time, it replaces monthly subscriptions that can cost $200–$500/month for platforms like InnoVint or VinTrace. The Excel-based format means full offline access — critical for vineyard managers working in areas with limited internet connectivity. Teams can customize every KPI without waiting for vendor support, and the entire setup takes under 10 minutes.
The MTD and YTD trend analysis helps winery managers spot seasonal patterns in production yield, quality metrics, and sales performance. Color-coded conditional formatting eliminates the need to interpret raw numbers — green means on-target, red means attention required.
Opportunities for Improvement
The Winery KPI Scorecard tracks KPIs effectively but does not include automated data imports from winery management systems, POS terminals, or IoT sensors. Users need to enter data manually each month. The template also does not include regulatory compliance features like TTB reporting or excise tax calculations. For wineries needing end-to-end process management (crush-to-bottle tracking, lot genealogy, compliance), dedicated winery software may be a better fit alongside this scorecard for high-level KPI monitoring.
Best Practices
Update the scorecard at the start of each month with the previous month’s actual data. Define all KPIs in the Definition sheet before entering data — this ensures consistency across months and team members. Use the KPI Trend sheet during monthly management reviews to identify patterns rather than just reviewing the current month’s numbers. Customize the KPI list to match your winery’s specific operations: a boutique vineyard may track different metrics than a large-scale production facility. Share the file via OneDrive or SharePoint for team collaboration while maintaining version control.
Explore Relevant Templates
Winemaking KPI Dashboard in Excel — A 7-page interactive dashboard with navigation hub, deep trend analysis, and complete winery performance monitoring across production, quality, inventory, and sales.
Winery KPI Dashboard in Google Sheets — Cloud-based winery KPI tracking with real-time collaboration, MTD/YTD analysis, and color-coded performance indicators. Also available as a Google Sheets version of this scorecard.
Craft Brewery KPI Scorecard in Excel — Similar scorecard format designed for craft breweries, tracking production, quality, and distribution metrics.
Browse all KPI Dashboard Templates | Excel Dashboard Templates
Frequently Asked Questions
Click here to Purchase the Winery KPI Scorecard in Excel
What KPIs does the Winery KPI Scorecard in Excel track?
The Winery KPI Scorecard in Excel tracks 10+ customizable KPIs including grape yield per acre, fermentation efficiency, wine quality score, revenue per bottle, inventory turnover, and distribution fill rate. All metrics update automatically when you enter your data.
How long does it take to set up the Winery KPI Scorecard?
Setup takes under 10 minutes. Define your KPIs in the Definition sheet, enter targets and actual data, and the scorecard generates MTD and YTD comparisons with color-coded indicators instantly.
Can I customize the KPIs in this winery scorecard?
Yes. The KPI Definition sheet lets you add, remove, or modify any metric. Change the KPI name, group, unit, formula, and definition to match your winery’s operations and reporting needs exactly.
How does this compare to winery management software like InnoVint?
The Winery KPI Scorecard costs $12.99 one-time versus $200–$500/month for InnoVint or VinTrace. It covers KPI tracking and trend analysis without the complexity of full winery management software. Ideal for wineries wanting structured performance monitoring at a fraction of the cost.
Does this scorecard work with both MTD and YTD data?
Yes. The Scorecard sheet displays both Month-to-Date and Year-to-Date metrics side by side. The KPI Trend sheet shows monthly trend charts comparing Actual, Target, and Previous Year data for any selected KPI.
Which version of Excel do I need?
The Winery KPI Scorecard works with Microsoft Excel 2016 and later, including Microsoft 365. No macros or VBA required — it runs entirely on formulas and conditional formatting.
Is there a Google Sheets version of this winery scorecard?
Yes. The Winery KPI Dashboard in Google Sheets offers a similar KPI tracking experience with real-time collaboration and cloud access.
About the Author
Built by PK — Microsoft Certified Professional with 15+ years of Excel, Google Sheets, and Power BI experience. Founder of NextGenTemplates, reaching 300K+ subscribers across YouTube channels (@PK-AnExcelExpert, @NextGenTemplates, @NeoTechNavigators). Every template is hand-built and tested before release.
Conclusion
The Winery KPI Scorecard in Excel gives winery owners, vineyard managers, and wine industry consultants a structured, affordable way to track performance across production, quality, sales, and distribution. With 4 worksheets, 10+ customizable KPIs, MTD/YTD trend charts, and color-coded indicators, it replaces manual reporting and expensive SaaS subscriptions with a one-time $12.99 investment.
Click here to Purchase the Winery KPI Scorecard in Excel
✅ Instant download · One-time payment · No subscription · Lifetime access
Visit our YouTube channel for step-by-step video tutorials: Youtube.com/@PK-AnExcelExpert