The global e-learning market crossed $325 billion in 2025, and app-based learning platforms are growing at 14% annually. Yet most EdTech teams still track KPIs manually in scattered spreadsheets, losing hours every month to data entry and formatting. The E-learning Apps KPI Dashboard in Excel tracks 20+ KPIs across 7 worksheets with MTD and YTD trend charts, conditional formatting arrows, and month-based filtering — all in a single Excel file that takes under 10 minutes to set up.
Whether you run an e-learning app, manage corporate training, or sell courses on platforms like Udemy or Coursera, tracking KPIs like course completion rate, daily active users, revenue per user, and learner churn is essential for growth. This ready-to-use E-learning Apps KPI Dashboard in Excel eliminates the need to build reporting from scratch.
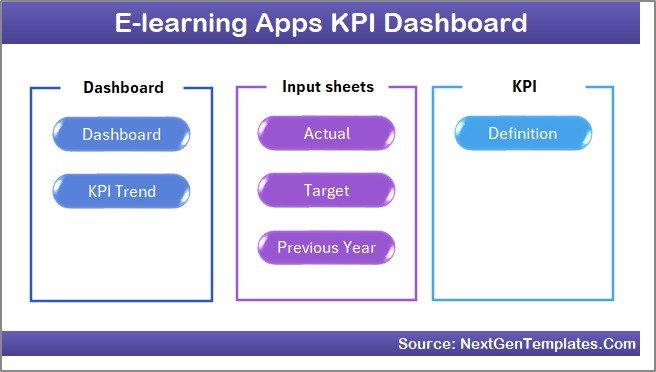
Key Features of E-learning Apps KPI Dashboard in Excel
Click here to Purchase the E-learning Apps KPI Dashboard in Excel
This Excel KPI dashboard is designed for e-learning product managers, training coordinators, and EdTech founders who need a structured way to monitor performance metrics. Here are the standout features:
- Month-Based Dynamic Filtering — Select any month from a dropdown on the Dashboard sheet (range D3), and all MTD and YTD numbers update instantly across every KPI. No formulas to modify.
- MTD and YTD Comparison Engine — View Actual vs. Target and Actual vs. Previous Year side by side with conditional formatting arrows (▲ green for favorable, ▼ red for unfavorable) that surface performance gaps immediately.
- KPI Trend Analysis Page — Pick any KPI from a dropdown to see its definition, formula, unit, group, type (LTB or UTB), and 12-month trend charts comparing Actual, Target, and Previous Year lines.
- Three Structured Input Sheets — Separate worksheets for Actual Numbers, Target Numbers, and Previous Year Numbers keep raw data organized and audit-friendly.
- KPI Definition Sheet — Define each KPI’s name, group, unit, formula, definition, and type (Lower the Better or Upper the Better) in a central reference that feeds the Dashboard and Trend pages automatically.
- Home Navigation Page — An index sheet with 6 clickable buttons for jumping directly to any worksheet.
- No Macros Required — Built entirely with Excel formulas and conditional formatting. Compatible with Windows, Mac, and Excel Online.
If you are looking for additional education-related tracking tools, explore the Excel Dashboard Templates collection on NextGenTemplates.
Dashboard Pages Explanation
The E-learning Apps KPI Dashboard in Excel contains 7 worksheets, each serving a distinct function in the KPI tracking workflow:
1. Home Sheet
This is an index sheet with 6 navigation buttons that let you jump to any worksheet in the file instantly. It acts as a control panel for the entire dashboard.
Home Page
2. Dashboard Sheet
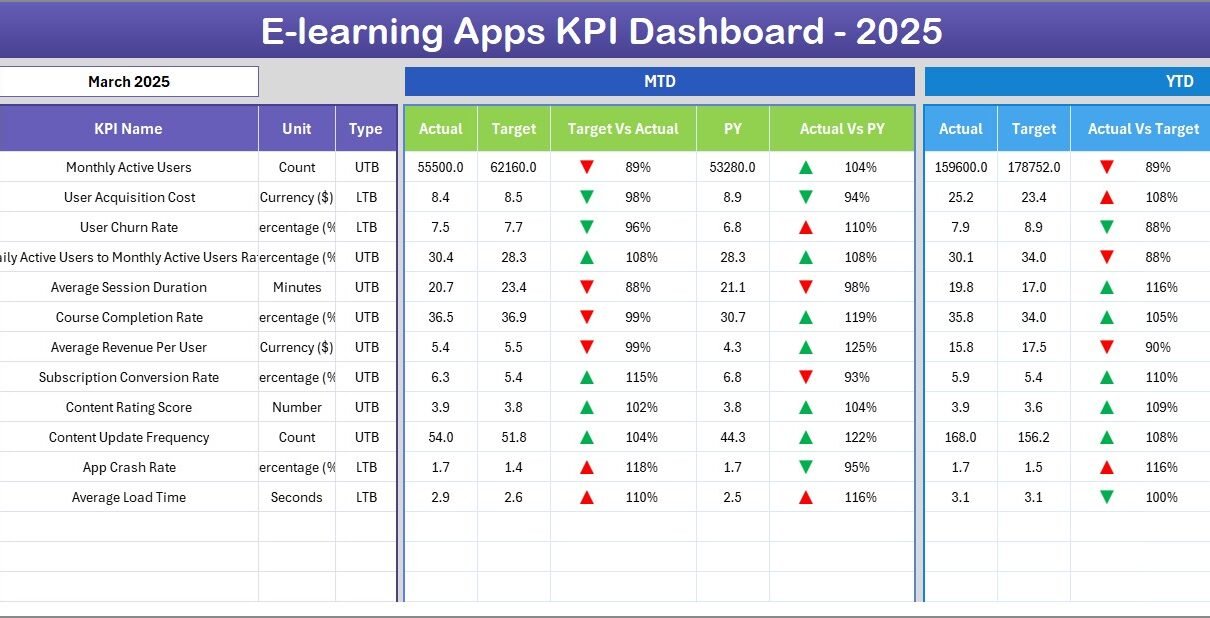
The main reporting view. Select a month from the dropdown on range D3, and all KPI rows update to show MTD Actual, Target, and Previous Year data alongside YTD Actual, Target, and Previous Year data. Conditional formatting arrows (▲▼) with green and red coloring highlight Target vs. Actual and PY vs. Actual variances at a glance.
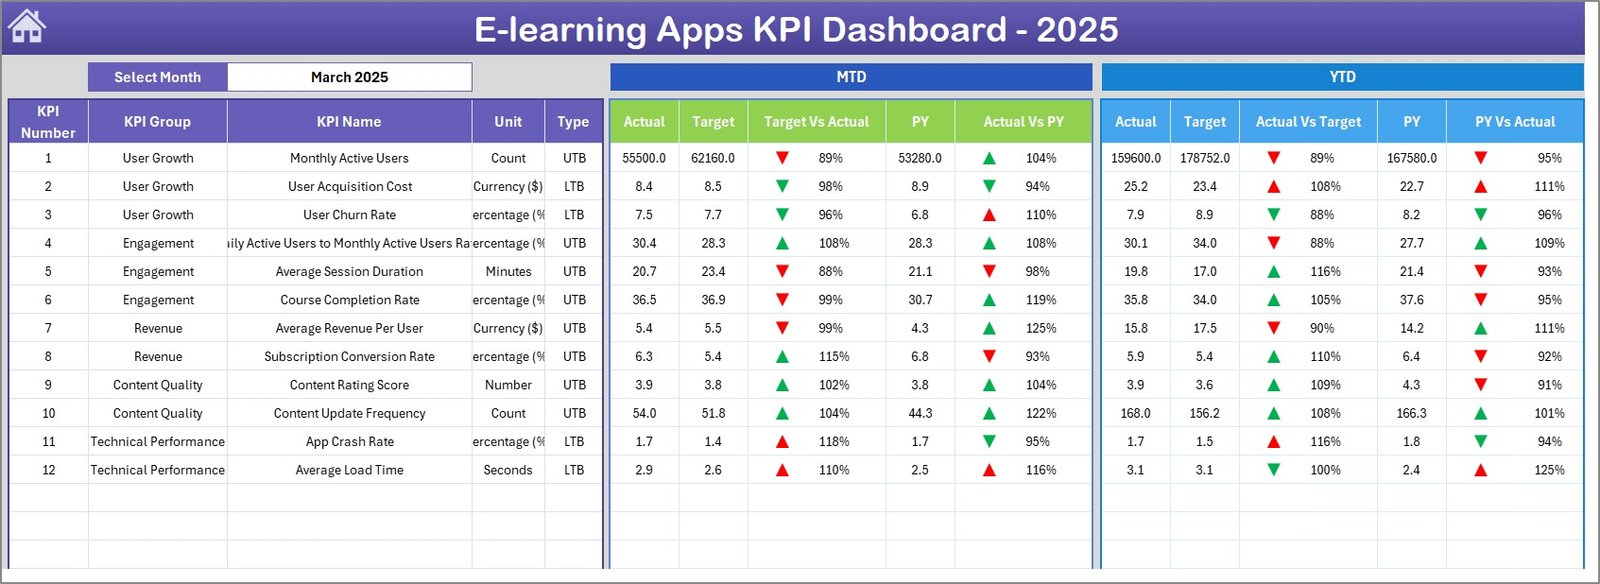
E-learning Apps KPI Dashboard
3. KPI Trend Sheet
Select any KPI from the dropdown on range C3 to view its KPI Group, Unit, Type (LTB or UTB), Formula, and Definition. Below the details, MTD and YTD trend charts display 12 months of Actual, Target, and Previous Year lines so you can spot seasonal patterns and performance shifts.
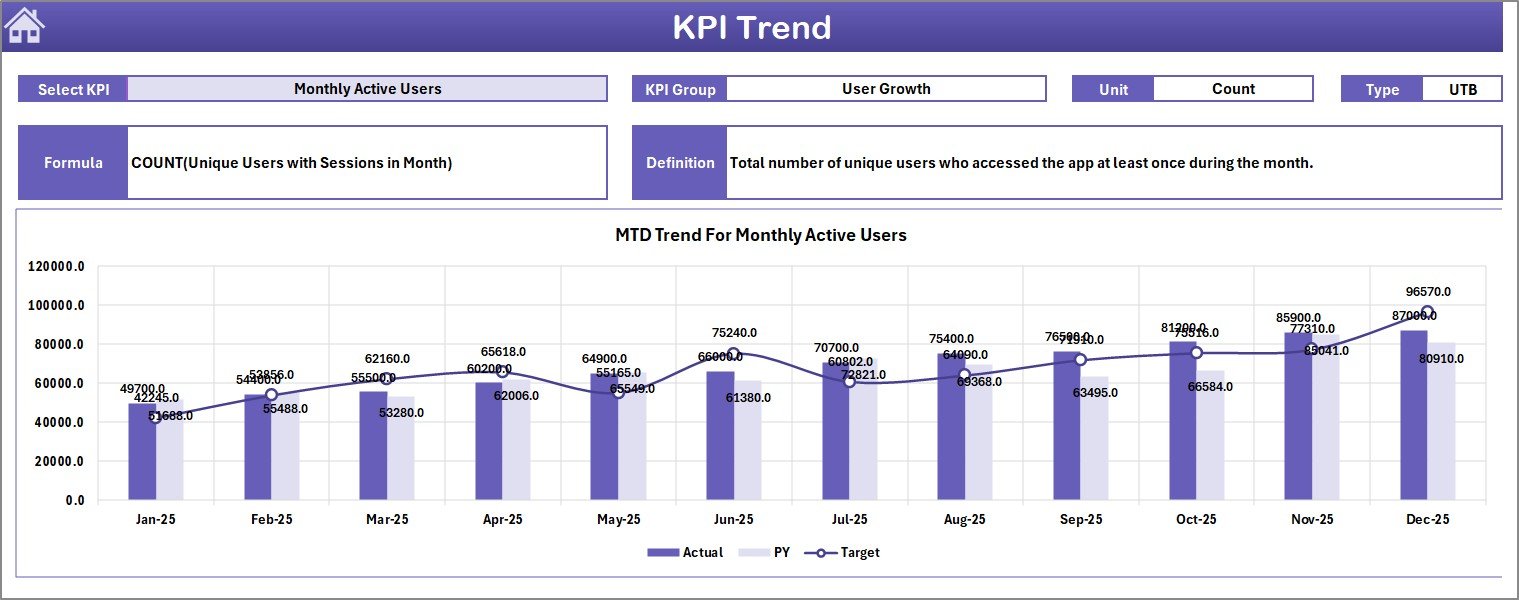
KPI Trend Sheet
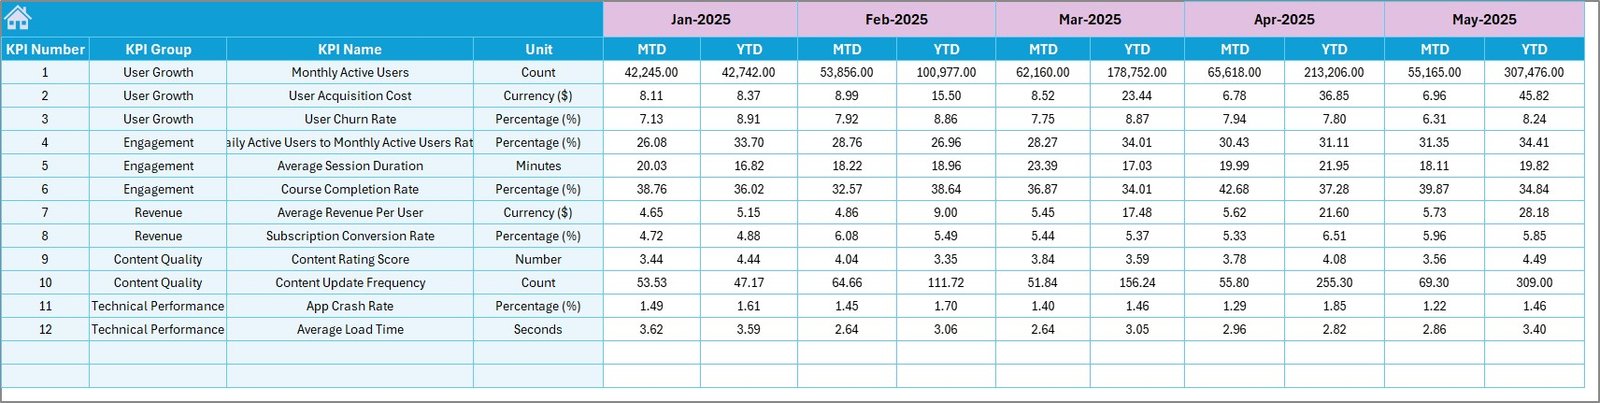
4. Actual Numbers Input Sheet
Enter your actual MTD and YTD numbers for each KPI by month. Set the first month of your fiscal year on range E1 to align reporting periods. This sheet feeds the Dashboard and KPI Trend pages.
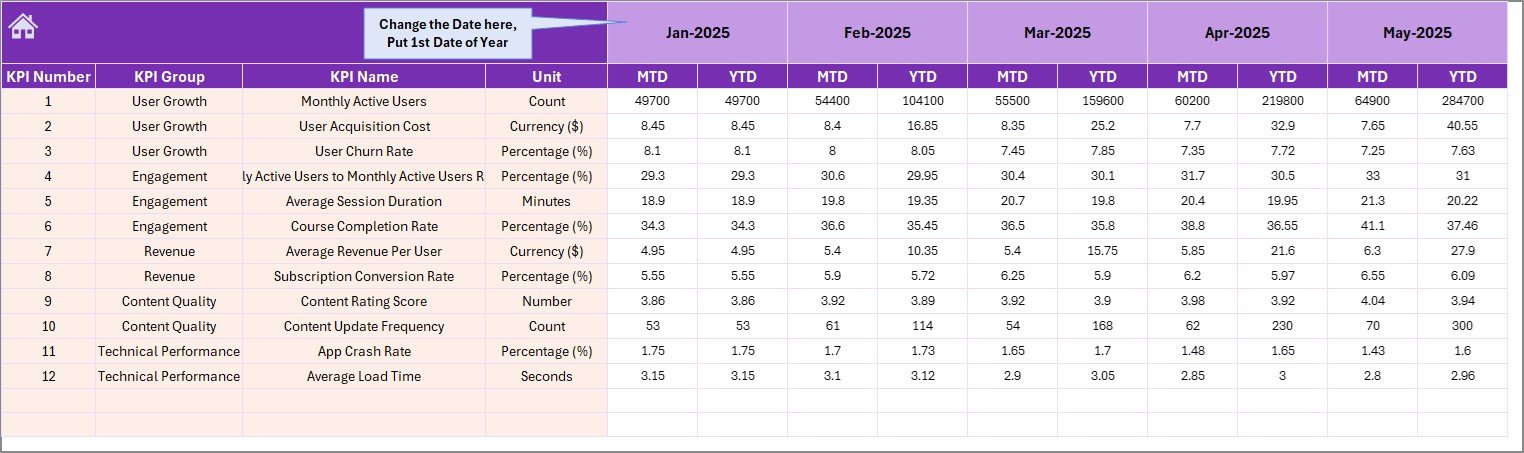
Actual Numbers Input Sheet
5. Target Numbers Input Sheet
Enter target numbers for each KPI as MTD and YTD values for every month. Targets flow into the Dashboard sheet where they are compared against actuals with conditional formatting.
Target Number Input Sheet
6. Previous Year Numbers Sheet
Enter previous year data in the same MTD and YTD format. This enables year-over-year comparison on the Dashboard sheet, helping you measure growth and identify regressions.
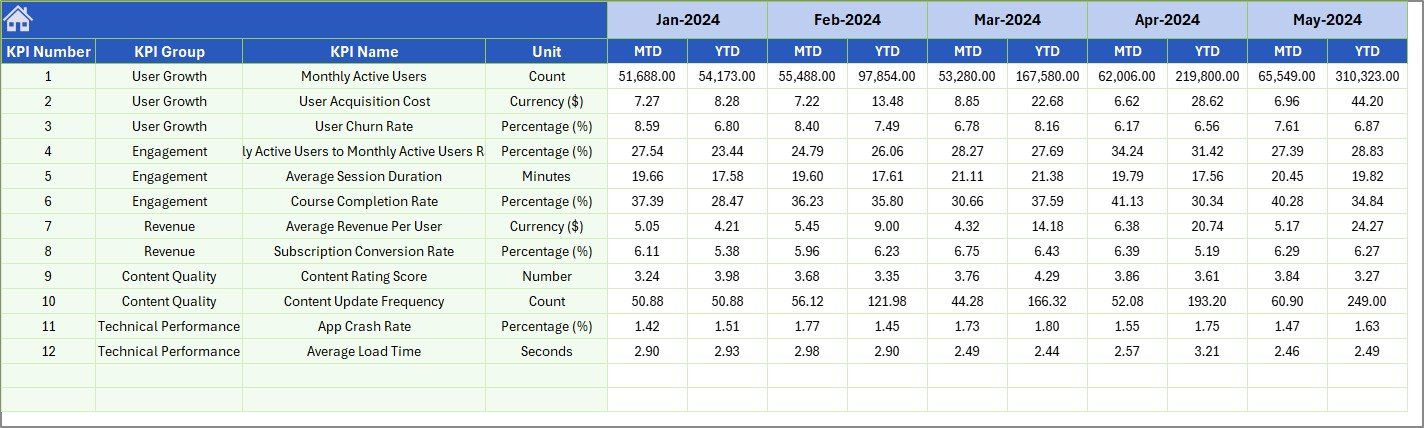
Previous Year Number Input Sheet
7. KPI Definition Sheet
Define each KPI’s Name, Group, Unit, Formula, Definition, and Type (LTB — Lower the Better, or UTB — Upper the Better). This central reference feeds the Dashboard and KPI Trend pages, so any changes here propagate automatically.
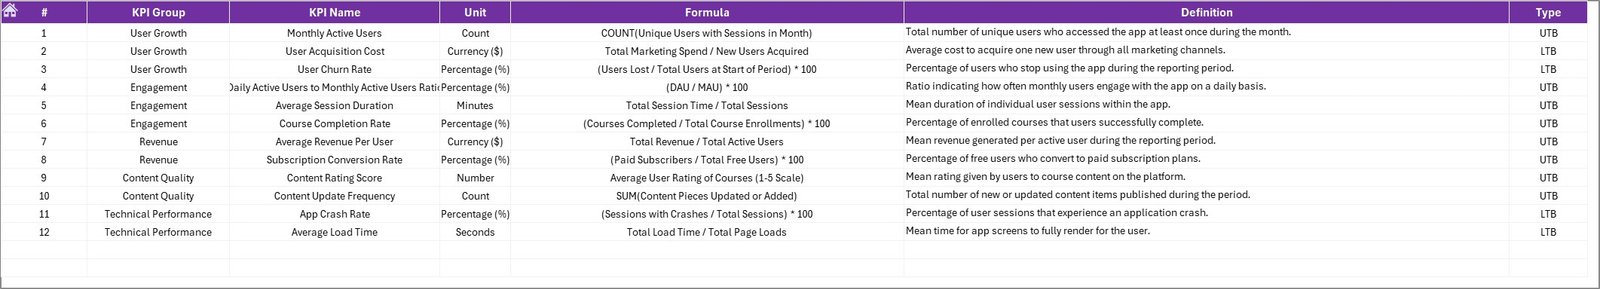
KPI Definition Sheet
E-learning Apps KPI Dashboard vs. Google Sheets Alternative vs. Paid LMS Analytics — Feature Comparison
| Feature | E-learning Apps KPI Dashboard (Excel) | Google Sheets E-learning Dashboard | Paid LMS Analytics (Teachable / Thinkific) |
|---|---|---|---|
| Cost | $14.99 one-time ✅ | Free (manual setup) | $39–$199/month |
| Platform | Microsoft Excel ✅ | Google Sheets | Web-based SaaS |
| Setup Time | Under 10 minutes ✅ | 2-4 hours (build from scratch) | 1-2 hours (config + integrations) |
| KPI Trend Charts | Built-in MTD + YTD ✅ | Manual chart creation | Limited to platform metrics |
| Custom KPI Definitions | Fully customizable ✅ | Requires manual formulas | Fixed metrics only |
| Offline Access | Full offline use ✅ | Limited offline | Requires internet |
| Year-over-Year Comparison | Built-in PY tracking ✅ | Manual setup | Varies by plan |
| Year-1 Cost (5 users) | $14.99 total ✅ | $0 (DIY effort) | $468–$2,388 |
For e-learning teams that want structured KPI tracking without paying monthly SaaS fees, the E-learning Apps KPI Dashboard in Excel sits in the sweet spot.
Who Should Use This Template
Click here to Purchase the E-learning Apps KPI Dashboard in Excel
Perfect for:
- E-learning product managers tracking course completion rates, learner engagement, and revenue per user across mobile or web apps
- EdTech startup founders who need investor-ready KPI reports without paying for analytics SaaS
- Training coordinators at schools, universities, or corporate L&D departments managing monthly KPI reviews
- Freelance course creators on Udemy, Skillshare, or Teachable who want a consolidated KPI view
Not a fit if:
- You need real-time API integrations with enterprise LMS platforms like Cornerstone or SAP SuccessFactors
- Your team requires multi-user concurrent editing on the same file — this is a single-file Excel template
- You need automated data ingestion from cloud databases or live API feeds
Real-World Use Cases
Click here to Purchase the E-learning Apps KPI Dashboard in Excel
Rahul manages product analytics at an EdTech startup in Bangalore. His team tracks 15 KPIs including daily active users, course completion rate, and average session duration across their mobile learning app. He uses the E-learning Apps KPI Dashboard to pull monthly actuals from their internal database into the Actual Numbers sheet, compare against board-approved targets, and generate a one-page PDF report for investor updates — replacing a $150/month analytics subscription.
Maria runs the L&D department at a 200-person logistics company in Mexico City. She monitors training completion rates, assessment pass rates, and learner satisfaction scores for 12 internal courses on their Moodle LMS. The KPI Trend sheet helps her identify which courses have declining engagement quarter over quarter, so she can flag them for content refreshes before the annual review.
James is a solo course creator selling on Udemy and Skillshare. He tracks revenue per course, enrollment rate, refund rate, and average review rating across both platforms. The Previous Year comparison feature shows him which courses grew vs. declined year over year, informing where he invests in new content production.
Advantages of E-learning Apps KPI Dashboard in Excel
Click here to Purchase the E-learning Apps KPI Dashboard in Excel
- Zero recurring cost — One payment of $14.99 replaces monthly SaaS subscriptions that can cost $39–$199 per month per user.
- Full offline access — Works without internet, unlike cloud-based LMS analytics that require constant connectivity.
- Platform-agnostic data input — Track KPIs from any LMS or e-learning platform since you manually input data. Works with Coursera, Udemy, Moodle, Teachable, or proprietary systems.
- Year-over-year tracking built in — The Previous Year Numbers sheet enables automatic YoY comparison without additional formulas.
- Customizable KPI structure — Add, remove, or modify KPIs at any time through the KPI Definition sheet.
Opportunities for Improvement
Click here to Purchase the E-learning Apps KPI Dashboard in Excel
- Manual data entry — There is no direct API connection to LMS platforms, so you need to export and enter data manually each month.
- Single-user file — Excel does not support simultaneous editing by multiple users without OneDrive/SharePoint setup, which may limit collaboration for larger teams.
- No automated alerts — The dashboard shows KPI status visually but does not send email or Slack notifications when a KPI falls below target.
Best Practices
- Update data monthly — Block 30 minutes on the first business day of each month to enter actuals and review the dashboard. Consistency is key for trend analysis.
- Define KPIs before entering data — Complete the KPI Definition sheet first so all formulas, types (LTB/UTB), and groupings are set before you start entering numbers.
- Use the Previous Year sheet from day one — Even if you only have partial historical data, entering what you have enables meaningful YoY comparisons within a few months.
- Export the Dashboard as PDF for stakeholder reports — Select the Dashboard sheet, print to PDF, and share with leadership for a clean, one-page KPI summary.
- Review KPI trends quarterly — Use the KPI Trend sheet to spot multi-month patterns that monthly snapshots might miss.
For detailed guidance on KPI tracking in Excel, refer to Microsoft’s official Excel support documentation.
Explore Relevant Templates
Click here to Purchase the E-learning Apps KPI Dashboard in Excel
If you are building an analytics stack for your e-learning business, these related templates on NextGenTemplates may be useful:
- E-Learning Apps Dashboard in Excel — An interactive dashboard with charts, filters, and data entry sheets for e-learning app analytics.
- E-learning Platform KPI Scorecard — A traffic-light scorecard with red/amber/green indicators for monitoring e-learning KPIs.
- Digital Learning KPI Scorecard in Excel — Track digital learning metrics with a structured scorecard format.
- EdTech KPI Scorecard in Excel — Monitor EdTech business metrics with a dedicated scorecard layout.
- Online Learning Platforms KPI Dashboard in Power BI — Also available in Power BI for teams preferring interactive Power BI reports.
Browse all Excel Dashboard Templates or explore Education Templates.
Frequently Asked Questions
What KPIs can I track with the E-learning Apps KPI Dashboard?
You can track any e-learning KPI including course completion rate, daily active users, learner engagement score, revenue per user, churn rate, assessment pass rate, and more. The KPI Definition sheet supports 20+ custom KPIs with names, formulas, units, and types.
Does this Excel KPI dashboard work on Mac?
Yes. The E-learning Apps KPI Dashboard uses standard Excel formulas and conditional formatting only — no VBA macros required. It is compatible with Excel for Windows, Excel for Mac, and Excel Online.
How long does setup take?
Under 10 minutes. Enter your KPI definitions on the KPI Definition sheet, fill in your target and actual numbers on the input sheets, and the Dashboard and KPI Trend pages update automatically.
How does this compare to paid LMS analytics tools like Teachable or Thinkific?
Paid LMS analytics tools cost $39–$199 per month and only track metrics within their own platform. The E-learning Apps KPI Dashboard costs $14.99 one time, works offline, tracks KPIs from any data source, and gives you full control over which metrics to monitor.
Can I add more KPIs beyond the sample ones?
Yes. Add new rows in the KPI Definition sheet with the KPI name, group, unit, formula, definition, and type (LTB/UTB). Then add matching data rows in the Actual, Target, and Previous Year input sheets. The Dashboard updates automatically.
Is this template suitable for tracking multiple e-learning platforms?
Yes. Since you manually enter data, the template works with any platform — Coursera, Udemy, Moodle, Teachable, your own LMS, or a combination. It is fully platform-agnostic.
What does LTB and UTB mean in the KPI Definition sheet?
LTB stands for Lower the Better — used for KPIs like churn rate or bounce rate where a decrease is favorable. UTB stands for Upper the Better — used for KPIs like revenue or completion rate where an increase is favorable. The dashboard uses these designations to correctly color-code the conditional formatting arrows.
About the Author
Built by PK — Microsoft Certified Professional with 15+ years of Excel, Google Sheets, and Power BI experience. Founder of NextGenTemplates, reaching 300K+ subscribers across YouTube channels (@PK-AnExcelExpert, @NextGenTemplates, @NeoTechNavigators). Every template is hand-built and tested before release.
Conclusion
The E-learning Apps KPI Dashboard in Excel gives e-learning teams, EdTech founders, and course creators a structured, ready-to-use system for tracking performance metrics without monthly SaaS fees. With 7 worksheets, MTD/YTD trend charts, conditional formatting, and a customizable KPI Definition sheet, it replaces hours of manual reporting with a 10-minute setup.
Click here to Purchase the E-learning Apps KPI Dashboard in Excel
✅ Instant download · One-time payment · No subscription · Lifetime access
Visit our YouTube channel for step-by-step tutorials: Youtube.com/@PK-AnExcelExpert
Click here to Purchase the E-learning Apps KPI Dashboard in Excel