Tutoring centers and independent tutors lose 12-18% of potential monthly revenue to manual tracking gaps — missed session records, untracked tutor payouts, and subjective rating reviews. The Tutoring Business Dashboard in Excel closes that gap with 5 dashboard pages, 5 KPI cards on the overview, and 16 interactive charts powered by pivot tables that refresh in under 5 seconds.
If you run a tutoring business and want to stop paying $29-$89 per month for TutorBird, Teachworks, or Oases Online — or you simply want full control of your data in an offline Excel file — this Tutoring Business Dashboard in Excel gives you enterprise-grade analytics for a one-time $17.99. This post walks through every sheet, every chart, and the exact workflow so you can decide whether it’s the right fit.
Key Features of the Tutoring Business Dashboard in Excel
- 5 analytical pages — Overview, Subject Analysis, Tutor Performance, Revenue Insights, Student Engagement — each with its own slicer panel.
- 5 KPI cards on the Overview page — Total Revenue, Total Records, Total Completed, Avg. Student Rating, Total Hours — all computed live from the Data sheet.
- 16 pre-built charts covering completion rate, revenue vs. tutor payment, subject mix, grade-level revenue, rating by tutor, monthly revenue trend, attendance, and referral-source ROI.
- Pivot-table-driven architecture — update the Data sheet, click Refresh All, and every chart and KPI recalculates.
- Works with any row count — 50 sessions or 50,000, the same dashboard handles it.
- No macros, no VBA — safe for corporate Excel environments where macros are blocked.
- Offline, local, private — your student and revenue data never leaves your device.
- Compatible with Excel 2016, 2019, 2021, Microsoft 365, and Excel for Mac.
Dashboard Pages Explanation
1. Overview Page
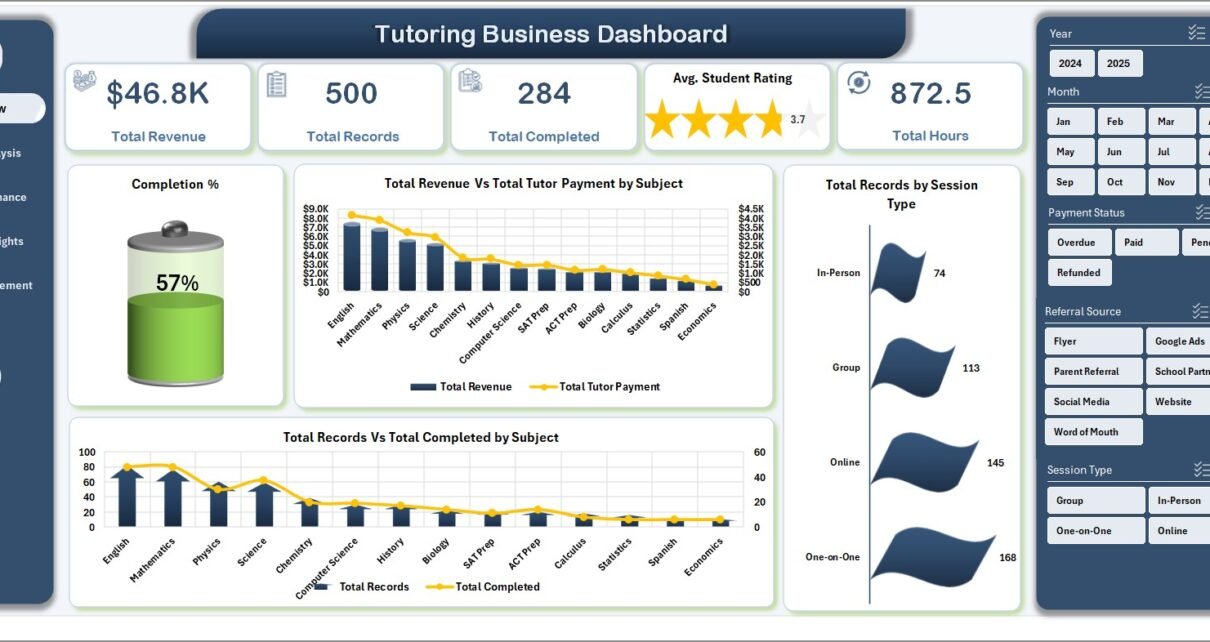
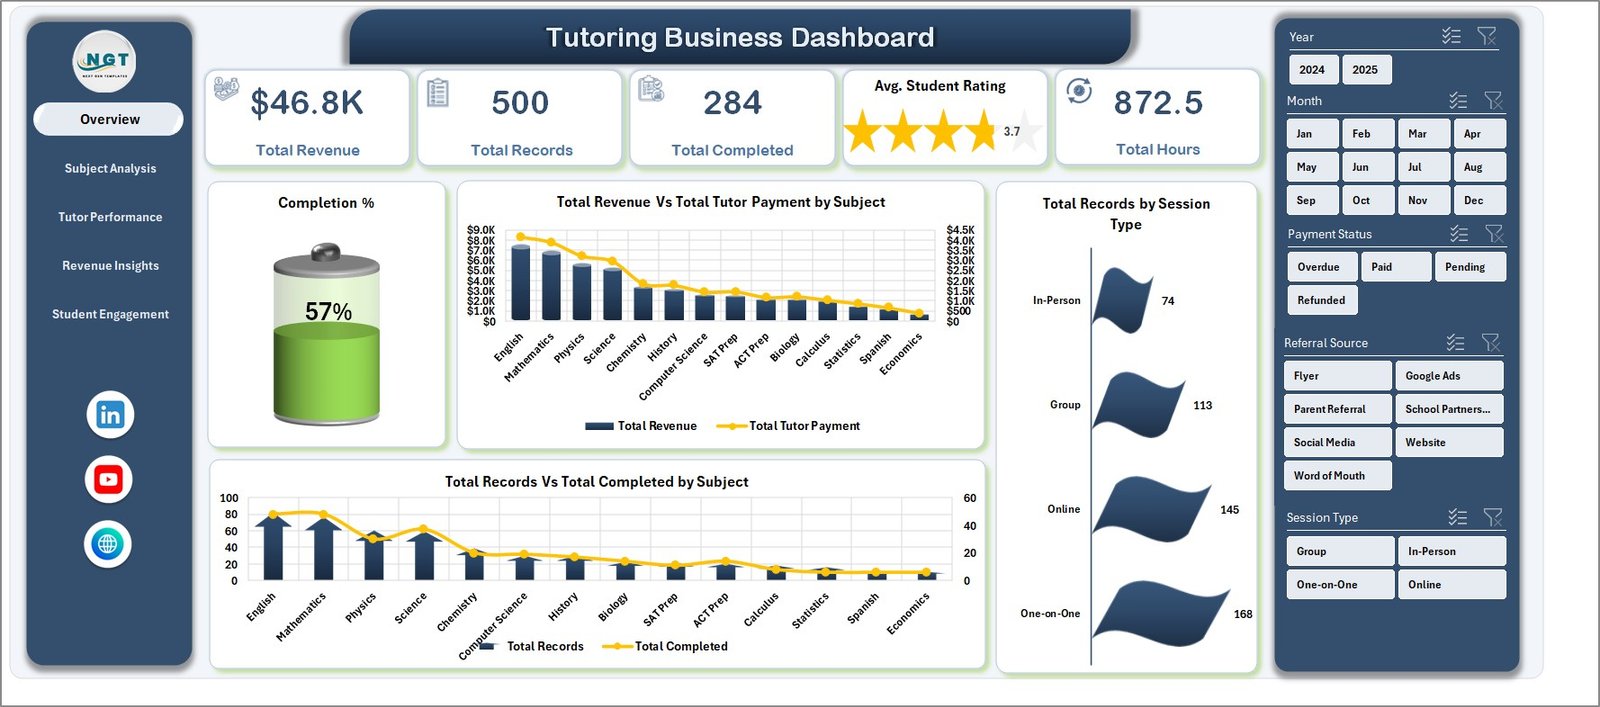
The Overview page is the one-screen snapshot for the owner or manager. Five KPI cards sit across the top, four charts sit beneath them, and the slicer panel lets you filter by Subject, Tutor, Grade Level, Session Type, or Month to narrow any view instantly.
KPI cards: Total Revenue, Total Records, Total Completed, Avg. Student Rating, Total Hours.
Charts on this page:
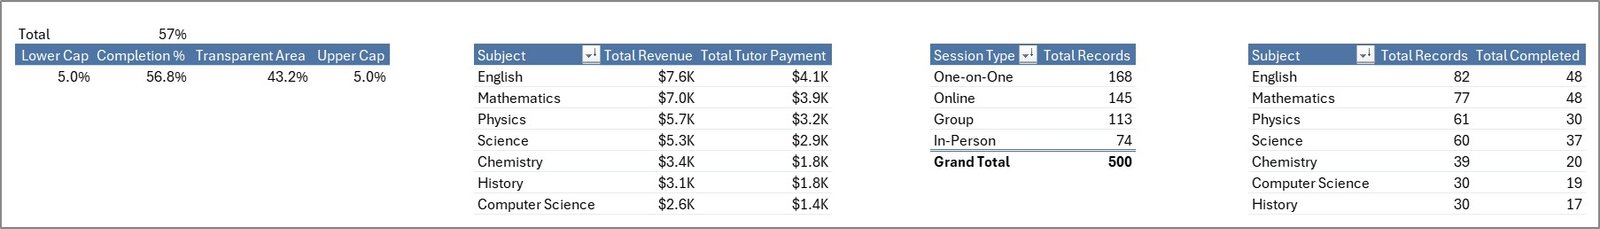
- Completion % — share of booked sessions that were actually delivered, surfacing no-show and cancellation patterns.
- Total Revenue Vs Total Tutor Payment by Subject — margin per subject at a glance.
- Total Records by Session Type — the mix of one-on-one, group, online, and in-person sessions.
- Total Records Vs Total Completed by Subject — booked versus delivered counts per subject.
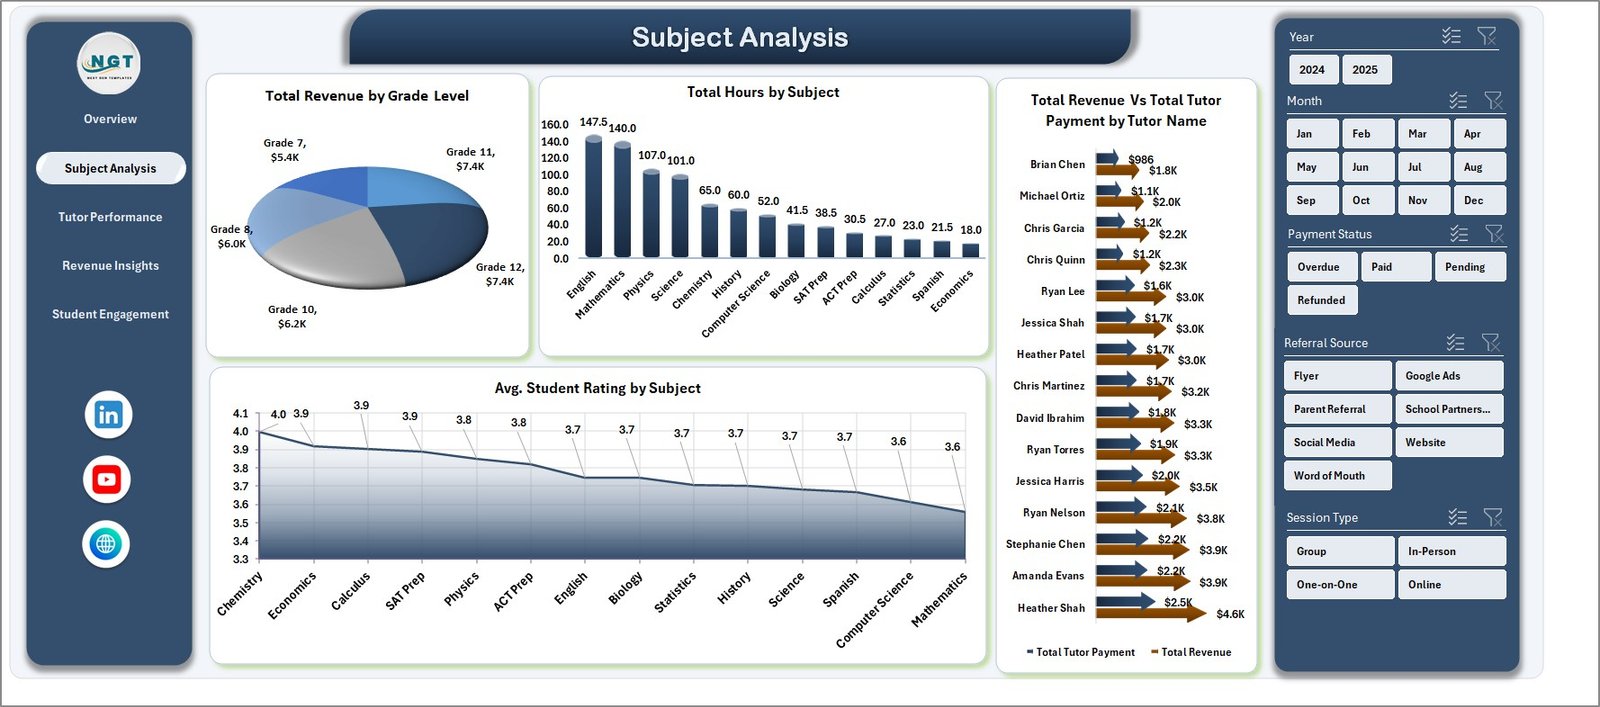
2. Subject Analysis
This page answers the business-strategy questions: which grade levels pay best, which subjects consume the most tutor hours, and which tutors generate the strongest revenue-to-payout ratio.
- Total Revenue by Grade Level — revenue broken down across elementary, middle, high school, and college segments.
- Total Hours by Subject — delivered tutoring hours per subject, for capacity planning.
- Total Revenue Vs Total Tutor Payment by Tutor Name — per-tutor margin view.
- Avg. Student Rating by Subject — satisfaction leaderboard across subjects.
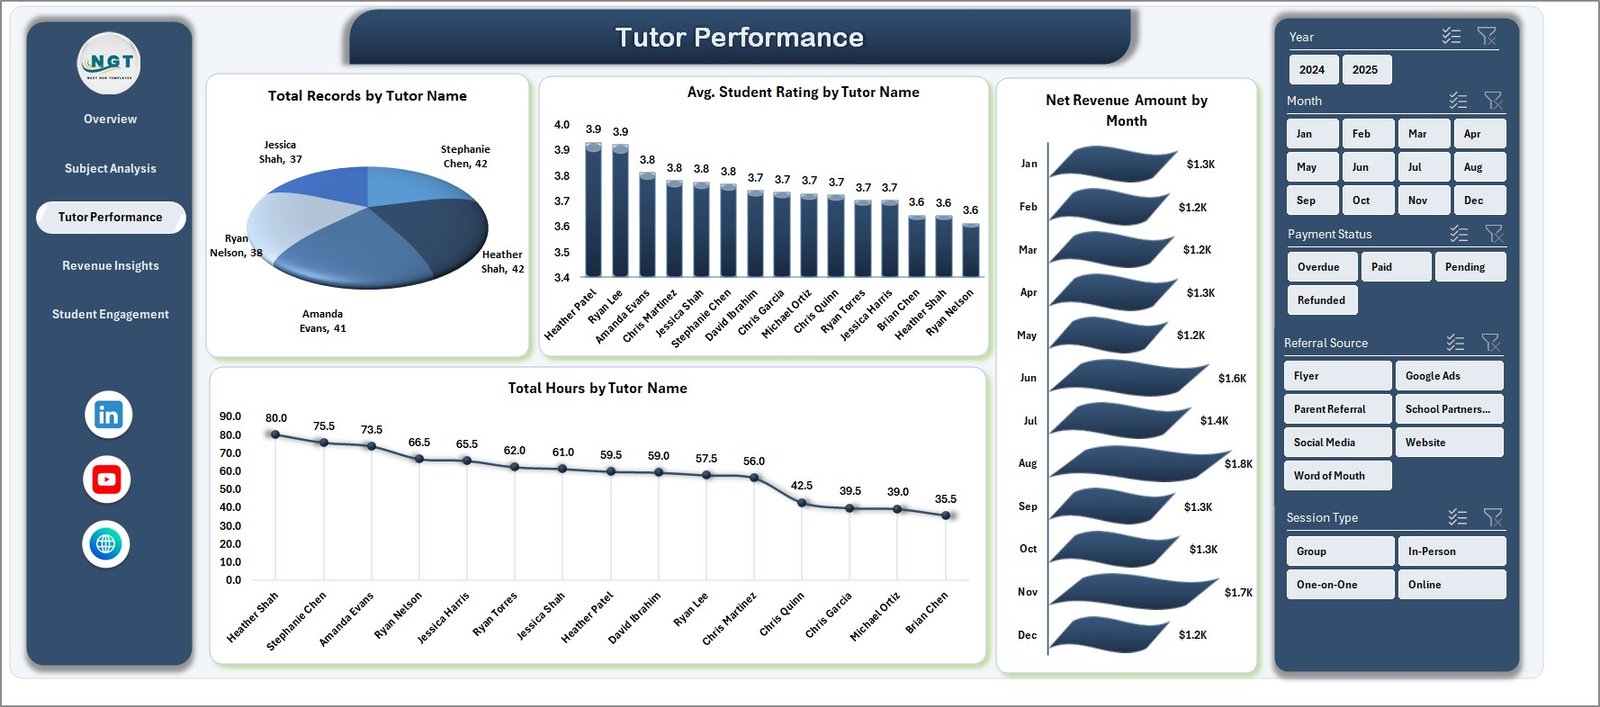
3. Tutor Performance
A manager-focused page for monthly 1:1s, bonus decisions, and retention conversations with top performers. It ranks tutors by volume, rating, hours, and net revenue by month.
- Total Records by Tutor Name — who is carrying the most sessions.
- Avg. Student Rating by Tutor Name — satisfaction rankings.
- Net Revenue Amount by Month — net-of-payout revenue trend across the year.
- Total Hours by Tutor Name — utilization view to spot over- and under-assigned tutors.
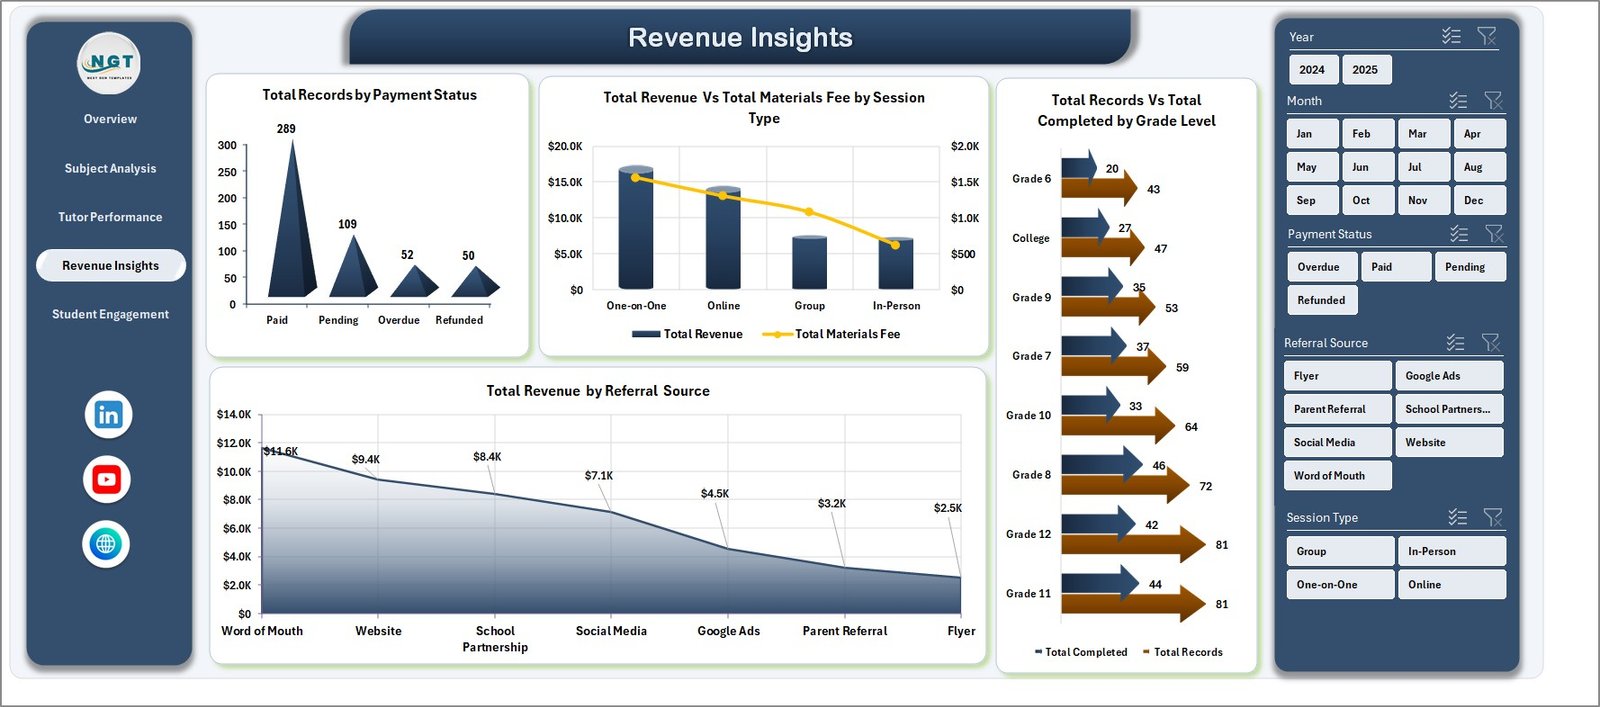
4. Revenue Insights
For finance and operations leads — payment health, session-type profitability, grade-level completion reliability, and marketing-channel revenue attribution all on one page.
- Total Records by Payment Status — Paid vs. Pending vs. Refunded for cash flow tracking.
- Total Revenue Vs Total Materials Fee by Session Type — net profitability by format.
- Total Records Vs Total Completed by Grade Level — completion reliability per grade segment.
- Total Revenue by Referral Source — revenue by acquisition channel (Google, referrals, Instagram, etc.).
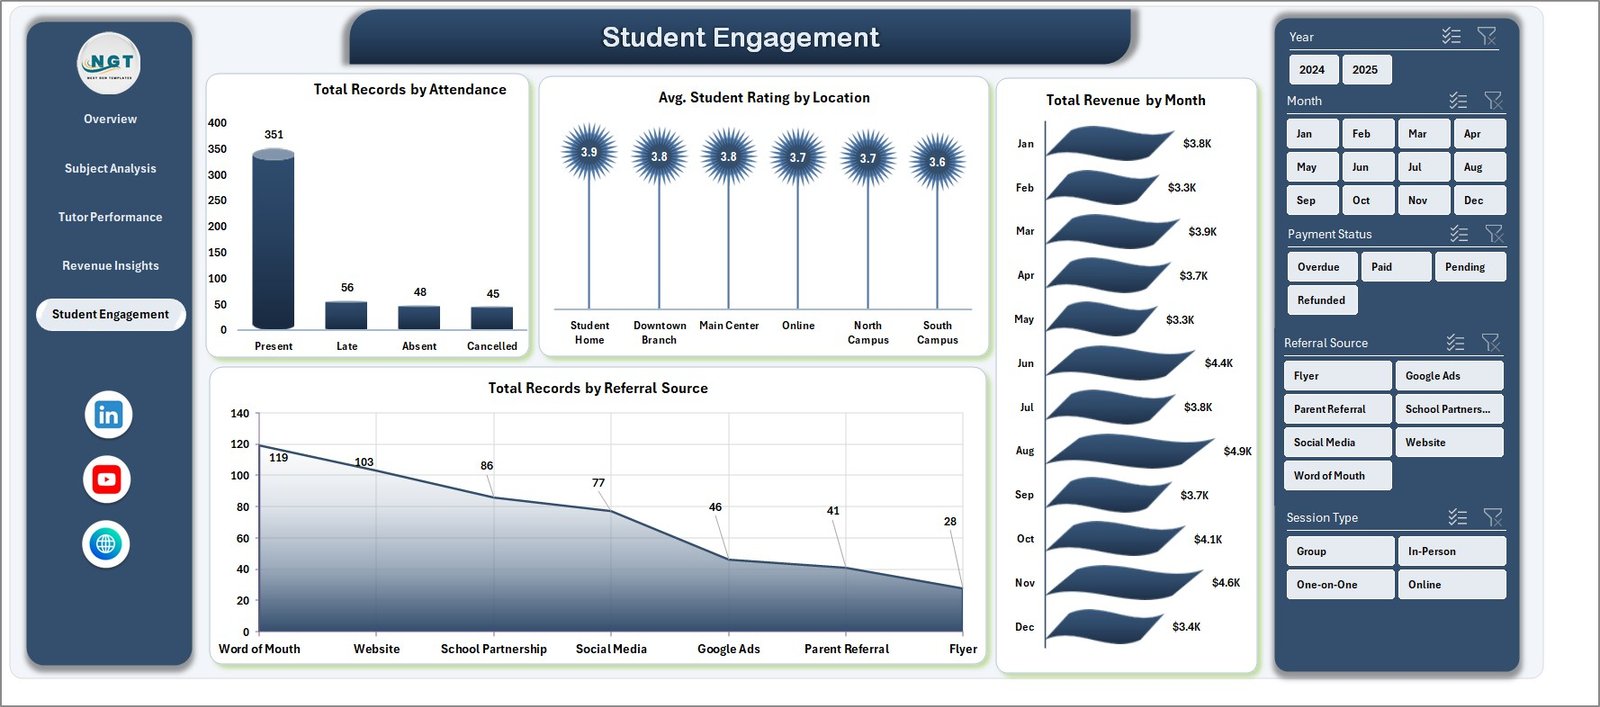
5. Student Engagement
The student-side view — attendance health, rating variance by location, month-over-month revenue trend, and acquisition-volume by referral source.
- Total Records by Attendance — no-show and cancellation rate exposure.
- Avg. Student Rating by Location — online vs. home vs. center ratings.
- Total Revenue by Month — month-over-month revenue trend.
- Total Records by Referral Source — acquisition volume by channel, paired with the revenue view on page 4.
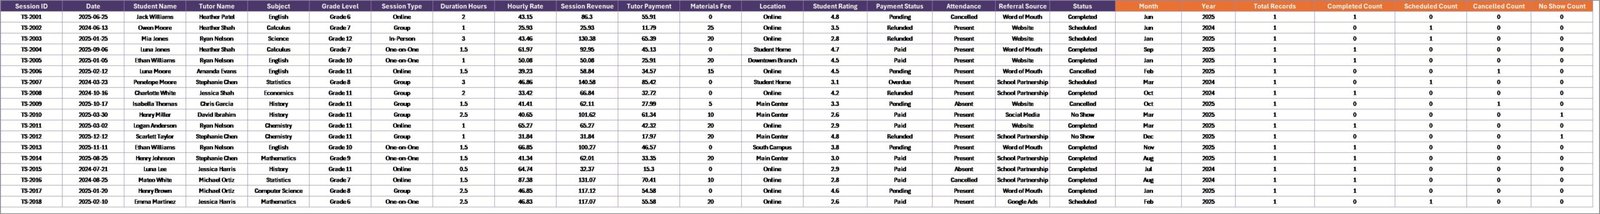
6. Data Sheet
Where you enter session records. Each row is one session with fields for Date, Tutor, Student, Subject, Grade Level, Session Type, Hours, Revenue, Tutor Payment, Materials Fee, Rating, Payment Status, Attendance, Location, and Referral Source. Follow the sample format and the charts update themselves.
7. Support Sheet
A hidden sheet containing every pivot table that feeds the dashboard charts. After updating the Data sheet, click Data > Refresh All on the Excel Ribbon and every pivot recalculates. Keep this sheet hidden in daily use — it is the engine room of the dashboard.
Tutoring Business Dashboard Excel vs. Google Sheets vs. Paid Tutoring SaaS — Feature Comparison
| Feature | Tutoring Business Dashboard (Excel) | Google Sheets Alternatives | TutorBird / Teachworks / Oases |
|---|---|---|---|
| Cost | $17.99 one-time | Mostly free, limited features | $29-$89 / month + per-tutor fees |
| Setup time | Under 10 minutes | 30-60 minutes | 3-7 days onboarding |
| Works offline | Yes — fully local file | No, needs internet | No, cloud-only |
| Tutor payout tracking | Built-in per-session | Manual formulas | Yes, often add-on |
| Rating & engagement analytics | Pre-built across 5 pages | Must build manually | Yes, vendor-locked |
| Data ownership | 100% yours, local file | Stored in your Drive | Vendor-owned cloud |
| Customizable | Fully | Yes | Limited to vendor options |
| 3-year total cost | $17.99 | $0 | $1,044-$3,204 |
For tutoring businesses that want real analytics without a monthly subscription or vendor lock-in, the Tutoring Business Dashboard in Excel sits in the sweet spot.
Who Should Use This Template
Perfect for:
- Tutoring center owners managing 5-50 tutors and 50-500 students
- Independent tutors wanting a professional dashboard to share with clients or parents
- Education franchises tracking revenue, ratings, and tutor performance across branches
- Coaching academies (test prep, STEM, language) needing monthly business reviews
- Private networks migrating from paper or ad-hoc spreadsheets to real analytics
Not a fit if:
- You need an integrated SIS with gradebooks and SOC 2-ready compliance
- You need a mobile clock-in app for tutors to punch in and out in real time
- You need automated billing, invoicing, and payment processing (this is reporting, not billing)
Real-World Use Cases
Priya runs a 12-tutor math and science tutoring center in Bangalore. She uses the Tutoring Business Dashboard in Excel every month to compare revenue against tutor payouts by subject, identify her top-rated tutors for retention bonuses, and walk her co-founder through quarterly performance — all without paying $59 per month for TutorBird. She filters by subject during strategy sessions and by tutor during 1:1s.
Marcus is an independent SAT/ACT tutor in the US with 30 regular students. He imports his session log into the Data sheet once a week, tracks which referral sources (Google, alumni, parent referrals) deliver the strongest revenue, and uses the monthly rating trend to justify his $90/hour rate when parents ask. His completion rate on the Overview page has become his single most important client-retention metric.
Ananya directs operations at a language-learning franchise with 4 locations. She filters the Tutoring Business Dashboard by location, compares average student ratings across branches, and pushes payment-status issues to her finance lead — all from one Excel file saved on OneDrive, no vendor login needed. She also uses the Revenue Insights page to decide which branches get the next round of marketing spend.
Advantages of the Tutoring Business Dashboard
- Lifetime cost savings of $1,000-$3,000 versus a 3-year TutorBird or Teachworks subscription.
- Zero learning curve — if you know Excel basics, you can run the dashboard immediately.
- Full editability — add your own KPIs, charts, or columns; nothing is locked.
- Instant filtering through slicers beats any cloud product’s page-load-and-filter cycle.
- Works in any Excel environment — no install, no plugin, no browser dependency.
Opportunities for Improvement
To stay honest: the Tutoring Business Dashboard is a reporting template, not an operational system. It does not book sessions, send reminders, or process payments. If you need tutors clocking in on a mobile app, automated billing, or parent-portal logins, pair this dashboard with a scheduling tool (even Google Calendar) and a billing tool (Stripe, Razorpay) rather than trying to replace them. The template also assumes a single Data sheet as the source of truth — teams that want multi-user simultaneous editing should save the file to OneDrive or SharePoint and enable co-authoring.
Best Practices
- Update the Data sheet weekly, not monthly — fresher data makes the trend charts far more useful.
- Lock the Support sheet once you are live so accidental edits don’t break pivots.
- Export the Overview page as PDF at month-end for stakeholder reports.
- Use slicers before drawing conclusions — filtering by a single tutor or subject often reveals patterns the aggregate view hides.
- Keep the column order in the Data sheet unchanged — pivot tables reference columns by position and renaming breaks them. Learn more about pivot tables from Microsoft Support if you want to go deeper.
Explore Relevant Templates
- Tutoring Business Dashboard in Excel — the main template this post is about.
- Driving School Dashboard in Excel — adjacent education vertical, same pivot architecture.
- Teacher Training Institutes KPI Dashboard in Excel — MTD/YTD KPI version for training institutions.
- Coaching Business Dashboard in Power BI — Power BI sibling for teams already on Power BI Desktop.
- Educational NGOs KPI Dashboard in Excel — for nonprofit education orgs tracking grants and impact KPIs.
- Browse the full Excel Dashboard category for more pivot-driven business dashboards.
Frequently Asked Questions
What does the Tutoring Business Dashboard in Excel track?
The Tutoring Business Dashboard tracks 5 KPIs (Total Revenue, Total Records, Total Completed, Avg. Student Rating, Total Hours) and 16 charts across 5 pages — Overview, Subject Analysis, Tutor Performance, Revenue Insights, and Student Engagement. Every metric recalculates when you update the Data sheet and click Refresh All.
How does the Tutoring Business Dashboard compare to TutorBird or Teachworks?
TutorBird and Teachworks charge $29-$89 per month plus per-tutor fees and lock your data in their cloud. The Tutoring Business Dashboard in Excel is a one-time $17.99 purchase, works fully offline, and gives you 100% data ownership. Over 3 years you save $1,000-$3,000 while trading automated billing and mobile apps for ownership and flexibility.
How long does setup take?
Setup takes under 10 minutes. Open the Tutoring Business Dashboard file, replace the sample session records in the Data sheet with your own data following the same column format, click Refresh All on the Data ribbon tab, and every chart and KPI on the 5 dashboard pages updates automatically.
Can I add my own subjects, tutors, or grade levels?
Yes. The Tutoring Business Dashboard uses pivot tables sourced from the Data sheet, so any new subject, tutor name, grade level, or referral source you enter is picked up automatically after clicking Refresh All. No formula edits or chart rebuilds are required.
Do I need macros or VBA enabled?
No. The Tutoring Business Dashboard in Excel is a pivot-table-driven workbook with no macros or VBA. It runs safely in corporate Excel environments where macros are blocked, and is compatible with Excel 2016, 2019, 2021, Microsoft 365, and Excel for Mac.
Can multiple team members edit the file at the same time?
Yes, if you save the Tutoring Business Dashboard file to OneDrive or SharePoint and open it in Excel for the web or Microsoft 365 desktop with co-authoring enabled. For local-only use, one person updates the Data sheet at a time and then shares the refreshed file with the team.
Is the Tutoring Business Dashboard a one-time purchase?
Yes — the Tutoring Business Dashboard in Excel is a one-time $17.99 purchase with instant download. There is no subscription, no per-tutor fee, and no renewal charge. You can use the template on unlimited devices inside your business.
About the Author
Built by PK — Microsoft Certified Professional with 15+ years of Excel, Google Sheets, and Power BI experience. Founder of NextGenTemplates, reaching 300K+ subscribers across YouTube channels (@PK-AnExcelExpert, @NextGenTemplates, @NeoTechNavigators). Every template is hand-built and tested before release.
Conclusion
The Tutoring Business Dashboard in Excel is the fastest way to turn raw session records into a boardroom-ready performance view — 5 pages, 16 charts, 5 KPIs, all pivot-driven and filterable through slicers. If you are running a tutoring center or coaching practice and want to stop paying $30-$90 per month for SaaS tools, this is the template to start with.
👉 Click here to Purchase the Tutoring Business Dashboard in Excel
Instant download · One-time payment · No subscription
🎥 For step-by-step video walkthroughs of every page, visit Youtube.com/@PK-AnExcelExpert.
📅 Last updated: April 2026