New: NextGenTemplates Academy - video courses on Excel formulas with AI and Pivot Tables & dashboards. Early-bird: 20% off with code EARLYBIRD20 - first 20 orders only.See the courses →
PKComments Off on Auto Repair Shop KPI Dashboard in Excel
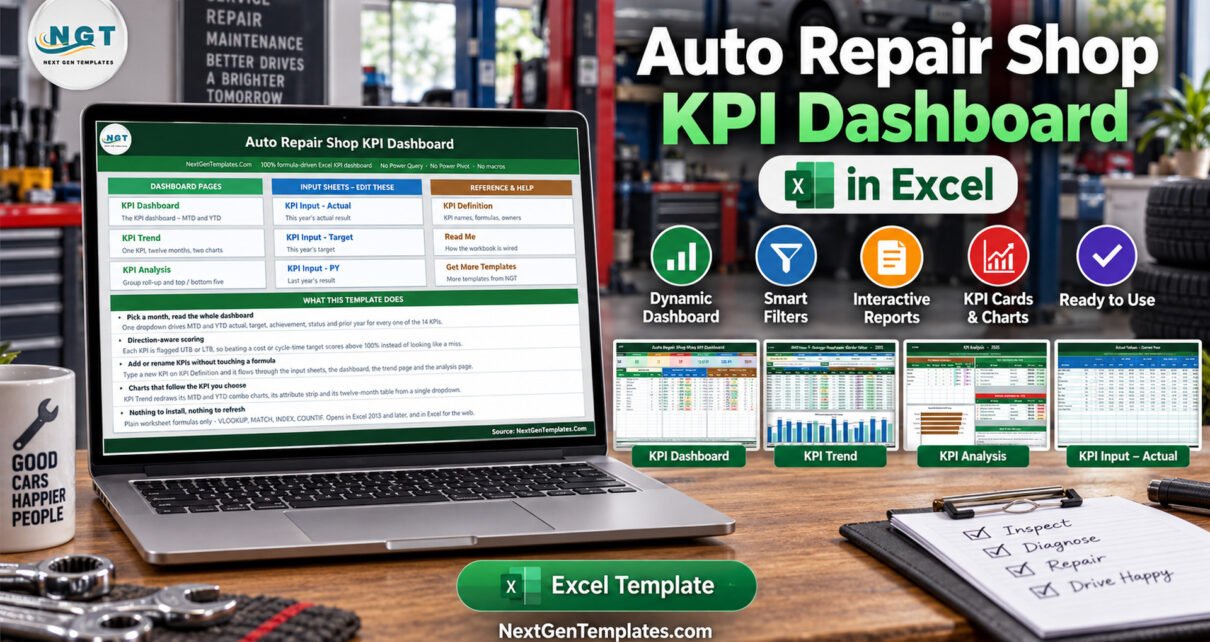
Most repair shops measure two things well — money in and cars out — and everything else anecdotally. The Auto Repair Shop KPI Dashboard in Excel is a month-picker scorecard
PKComments Off on Appliance Repair Business KPI Dashboard in Excel
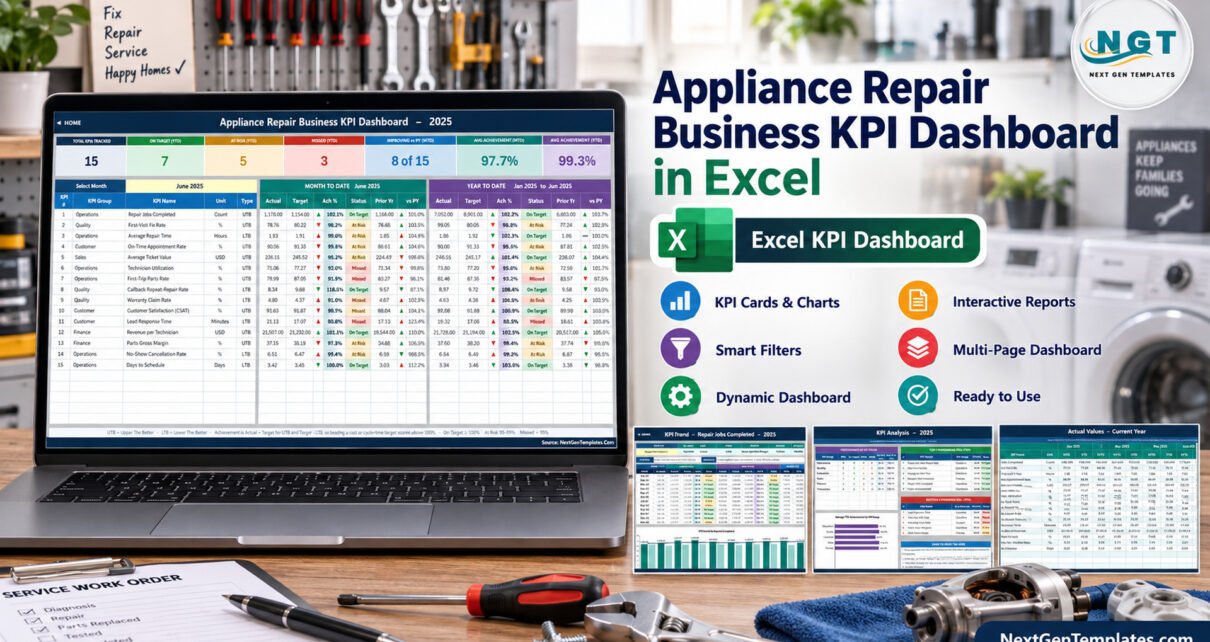
The Appliance Repair Business KPI Dashboard in Excel puts 15 appliance repair KPIs from 5 groups on one monthly scorecard. For each KPI it shows MTD and YTD actual, target,
PKComments Off on HVAC Contractor KPI Dashboard in Excel
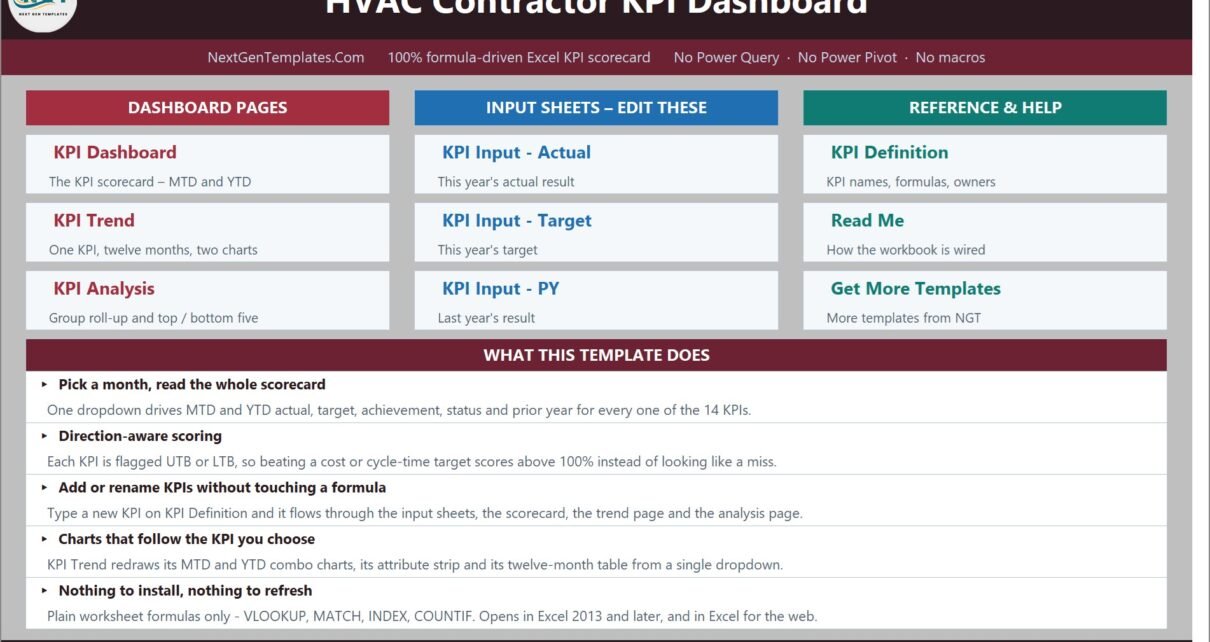
Most HVAC contractors measure something. Very few measure the same things, the same way, every month. The result is the familiar one: a first-time fix number that nobody can reproduce,
PKComments Off on Plumbing Contractor Dashboard in Excel
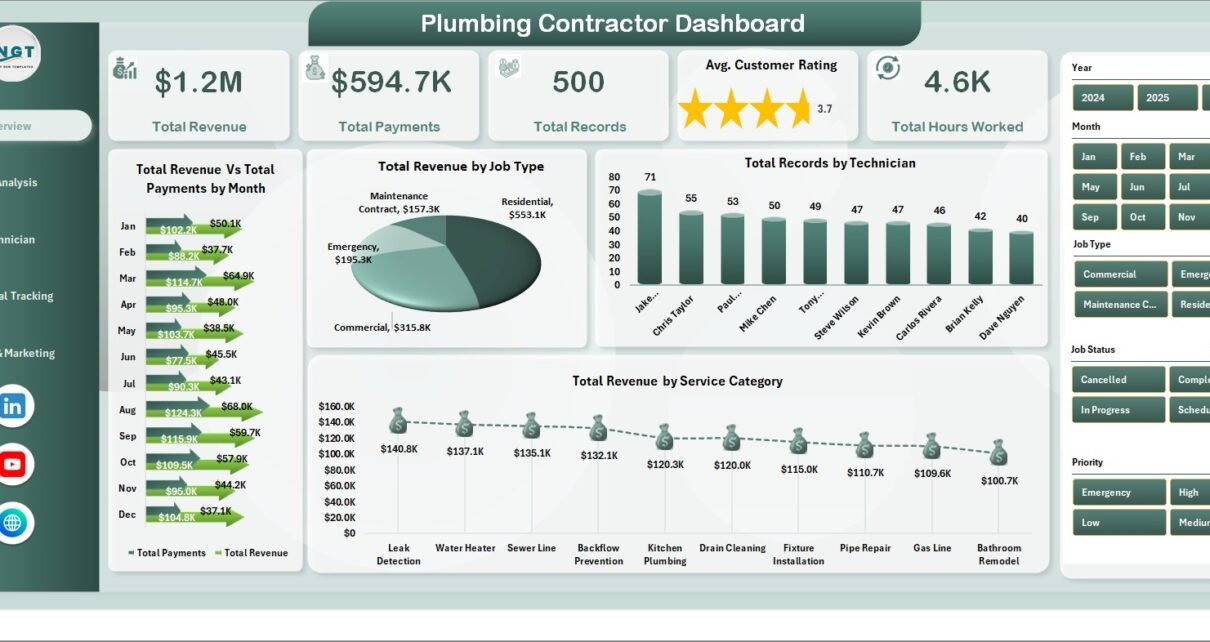
Plumbing contractors lose 12–18% of annual revenue to unbilled hours, missed AR follow-up, and untracked job-level profitability — and most shops only discover it at year-end when the books are
PKComments Off on HVAC Service Dashboard in Power BI
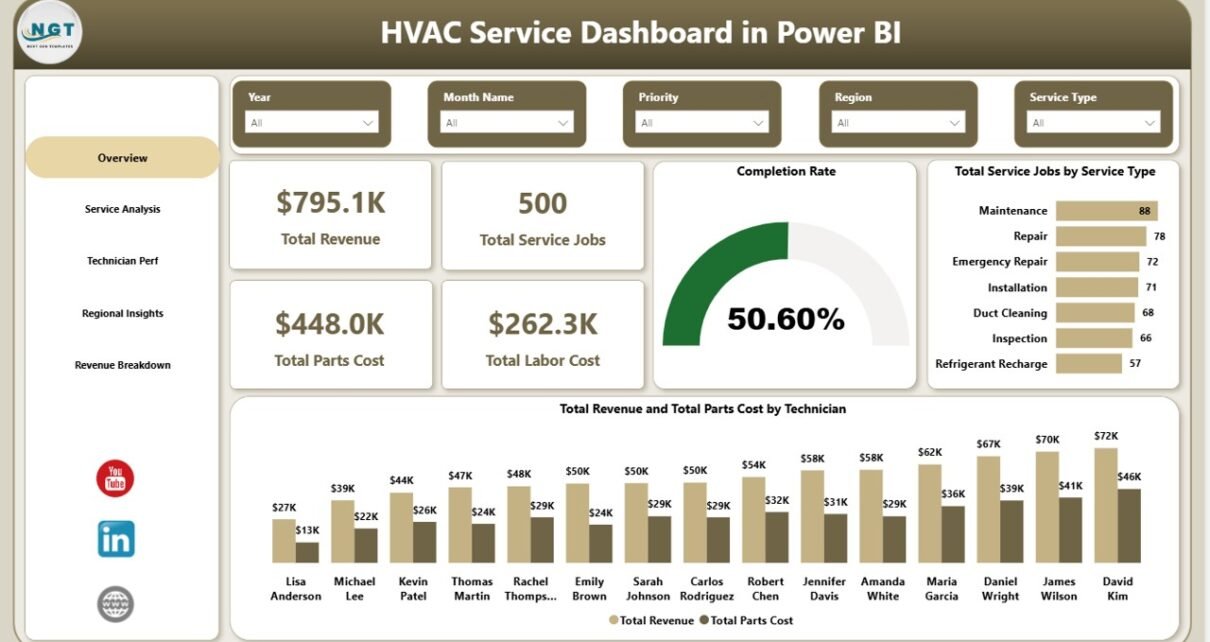
Running an HVAC service business means juggling dozens of data points every week — service calls, technician dispatches, parts cost, response times, customer ratings, and regional profit. When all of
Running an HVAC service business means juggling dozens of data points every week — service calls, technician dispatches, parts cost, response times, customer ratings, and regional profit. When all of
PKComments Off on Preventive Maintenance Dashboard in Power BI
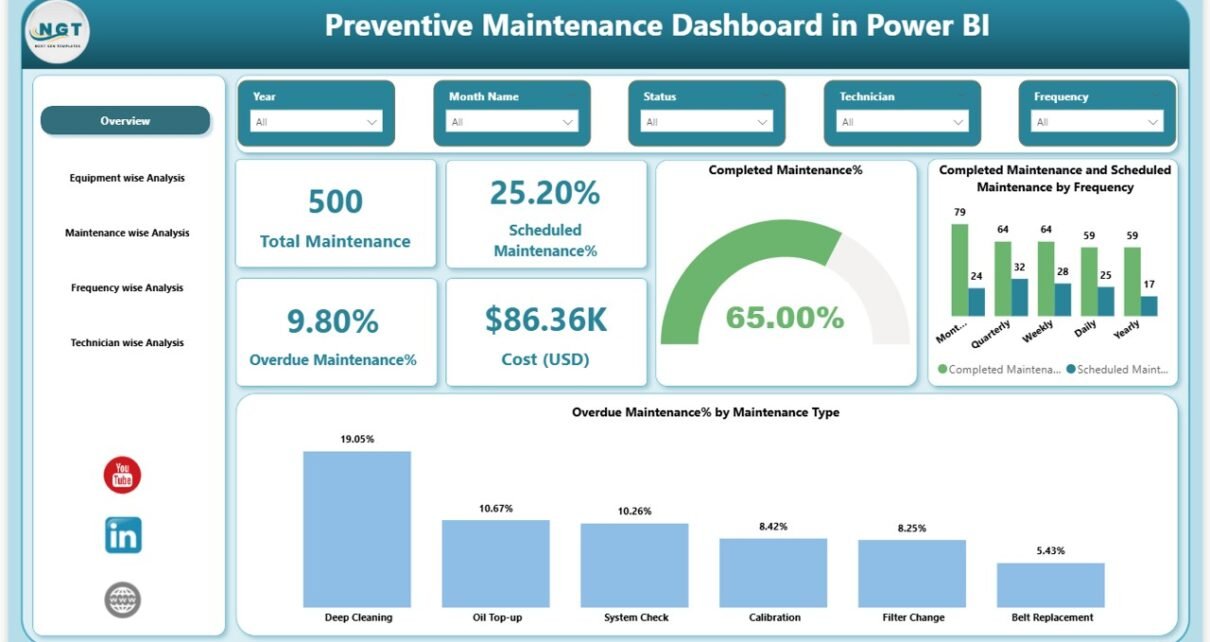
Equipment failures cost money. Unexpected breakdowns delay production. Moreover, emergency repairs increase expenses and reduce efficiency. Therefore, every organization needs a smart way to manage maintenance activities. However, many companies
PKComments Off on IT Support Ticket Dashboard in Power BI
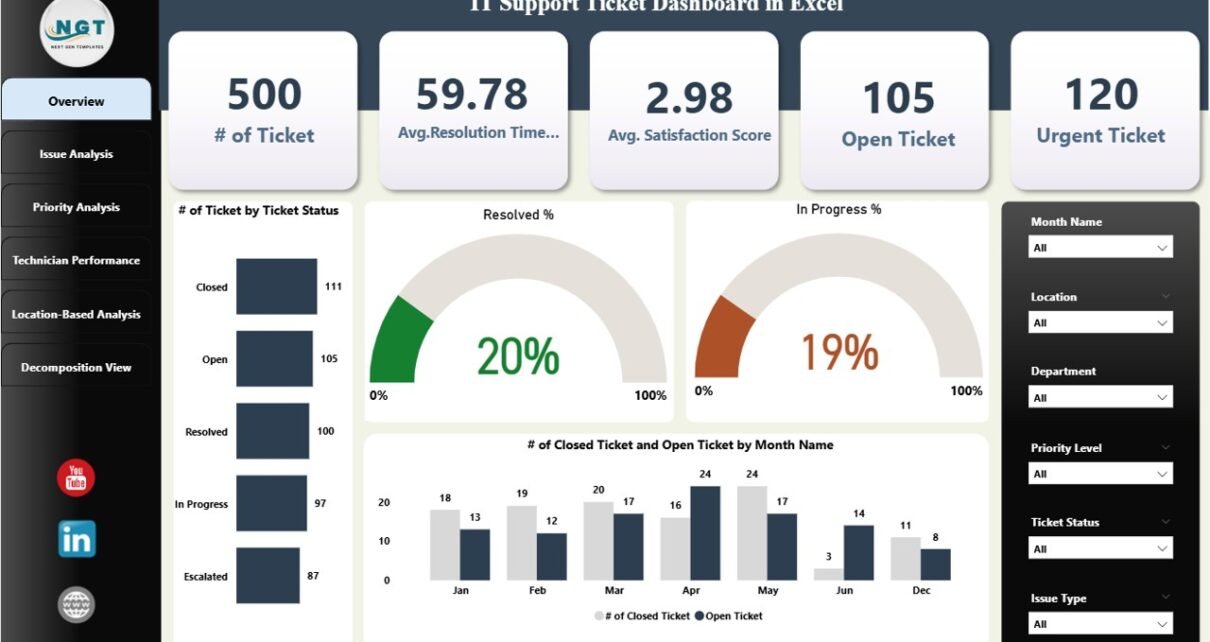
Efficient IT support management is essential for ensuring business continuity and employee productivity. Tracking ticket resolution, monitoring technician performance, and analyzing trends can be challenging without a centralized system. The
PKComments Off on Preventive Maintenance Dashboard in Excel
Preventive maintenance is crucial for businesses that rely on machinery and equipment to maintain smooth operations, reduce downtime, and manage costs effectively. Tracking maintenance schedules, equipment performance, and technician workload
PKComments Off on Telecommunications Dashboard in Power BI
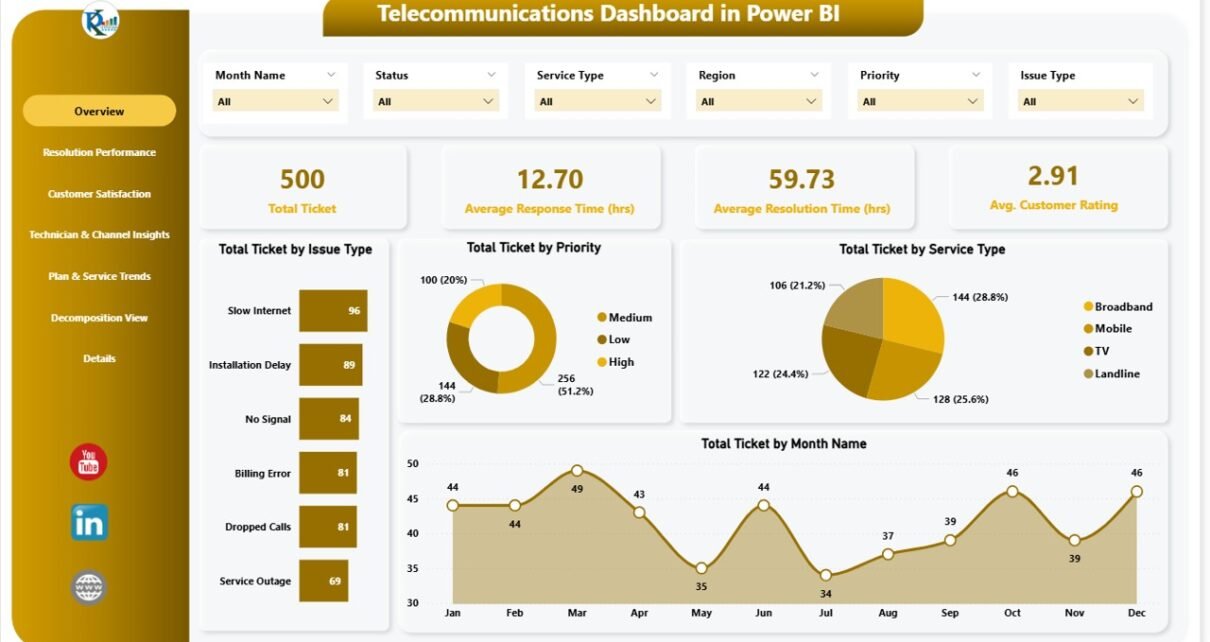
Effective management and analysis of customer service tickets are essential for delivering excellent service in the telecommunications industry. The Telecommunications Dashboard in Power BI is a ready-to-use tool that provides