The medical equipment manufacturing industry runs on precision, compliance, and performance. Every delay, defect, or cost overrun directly affects patient safety, regulatory adherence, and profitability. Because of this, manufacturers must track production data accurately and act on insights quickly. However, raw manufacturing data often stays scattered across machines, ERP systems, maintenance logs, and spreadsheets. As a result, decision-making slows down.
That is exactly where a Medical Equipment Manufacturing Dashboard in Power BI becomes a powerful solution.
This in-depth article explains what a Medical Equipment Manufacturing Dashboard in Power BI is, why it matters, how it works, and how each dashboard page supports smarter decisions. Moreover, you will learn about its advantages, best practices, opportunities for improvement, and common questions answered clearly.
Click to Purchases Medical Equipment Manufacturing Dashboard in Power BI
What Is a Medical Equipment Manufacturing Dashboard in Power BI?
A Medical Equipment Manufacturing Dashboard in Power BI is an interactive analytics solution that converts complex manufacturing data into clear visuals, KPIs, and trends. It helps manufacturers monitor production cost, output, downtime, defects, and manufacturing time from one centralized platform.
Instead of reviewing multiple reports, spreadsheets, and system logs, production managers, plant heads, and executives can track everything in real time using dynamic slicers, charts, and KPIs.
Because Power BI connects directly to structured data, this dashboard always reflects the latest performance metrics. As a result, teams respond faster and make confident decisions.
Why Do Medical Equipment Manufacturers Need a Power BI Dashboard?
Medical equipment manufacturing involves strict quality standards, high production costs, and tight timelines. Therefore, small inefficiencies can lead to major losses.
Here is why a Power BI dashboard becomes essential:
-
Manufacturing data grows daily and becomes hard to manage manually
-
Production costs vary by equipment, plant, and product
-
Downtime affects delivery timelines and compliance
-
Defective units increase waste and regulatory risk
-
Decision-makers need real-time insights, not delayed reports
Because of these challenges, a Medical Equipment Manufacturing Dashboard in Power BI creates clarity, speed, and control across operations.
How Does a Medical Equipment Manufacturing Dashboard in Power BI Work?
The dashboard collects data from manufacturing systems such as:
-
Production logs
-
Equipment maintenance records
-
Cost tracking systems
-
Plant-level production reports
After that, Power BI transforms this data into interactive visuals, such as cards, bar charts, line charts, and trend analysis. Moreover, slicers allow users to filter data by plant, equipment type, product name, shift, or month.
As a result, users explore data instantly without technical skills.
Key Features of the Medical Equipment Manufacturing Dashboard in Power BI
This dashboard includes five structured pages, each designed for a specific level of analysis. Together, these pages create a complete manufacturing intelligence system.
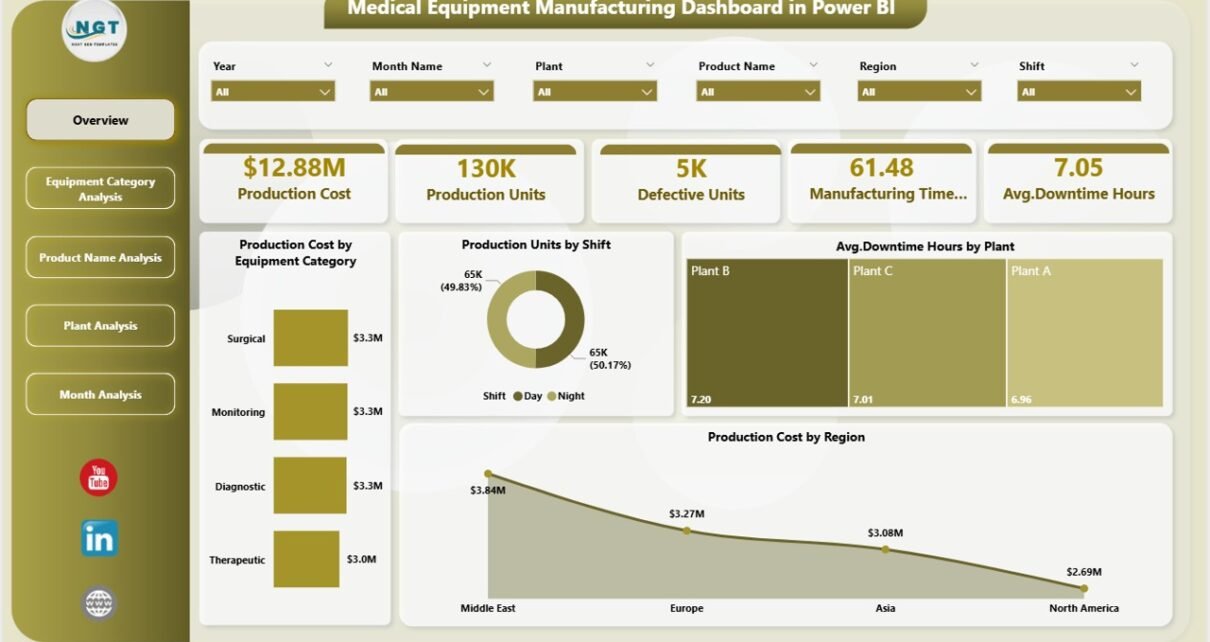
Overview Page: How Do You Get a Complete Manufacturing Snapshot?
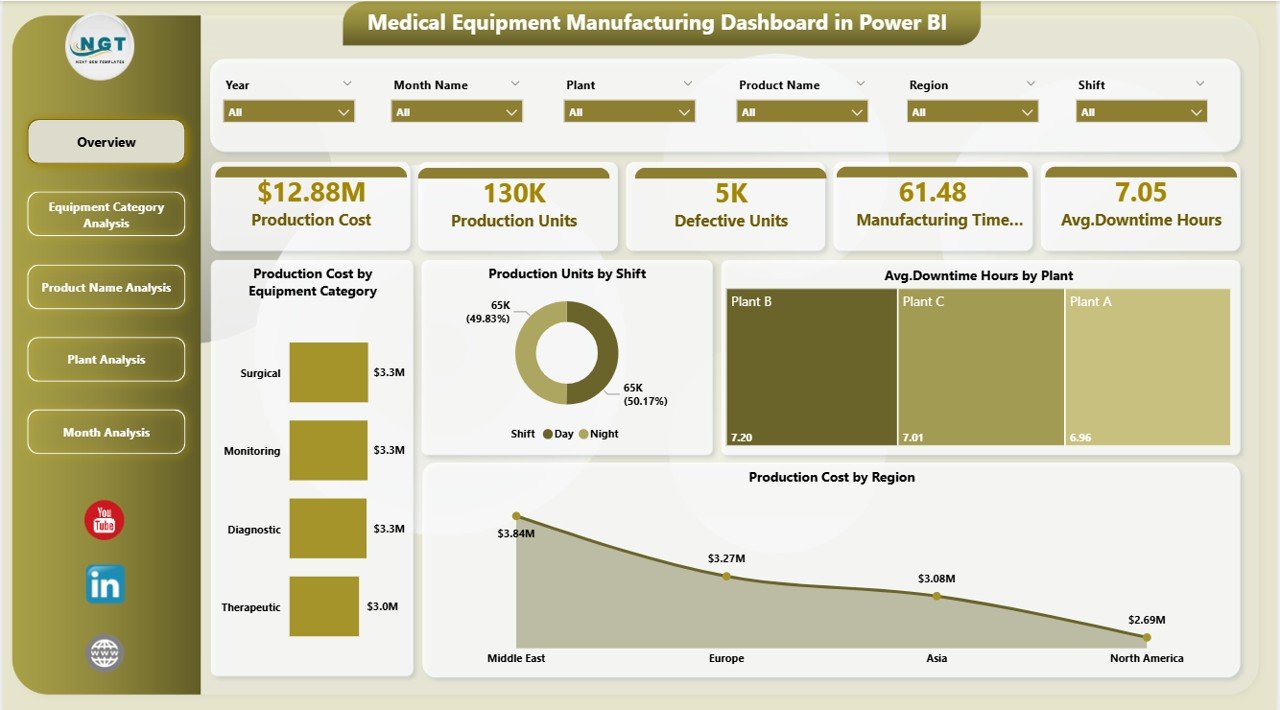
The Overview Page serves as the executive summary of the dashboard. It provides a high-level view of manufacturing performance at a glance.
Key KPIs and Visuals on the Overview Page
-
Production Cost by Equipment Category
Quickly understand which equipment categories drive higher costs. -
Production Units by Shift
Compare production output across different shifts. -
Average Downtime Hours by Plant
Identify plants facing frequent operational interruptions. -
Production Cost by Region
Analyze regional cost variations and efficiency differences.
Because slicers appear on this page, users filter data instantly by plant, equipment type, or time period. As a result, leadership reviews performance without waiting for detailed reports.
Click to Purchases Medical Equipment Manufacturing Dashboard in Power BI
Equipment Category Analysis: Which Equipment Types Impact Performance the Most?
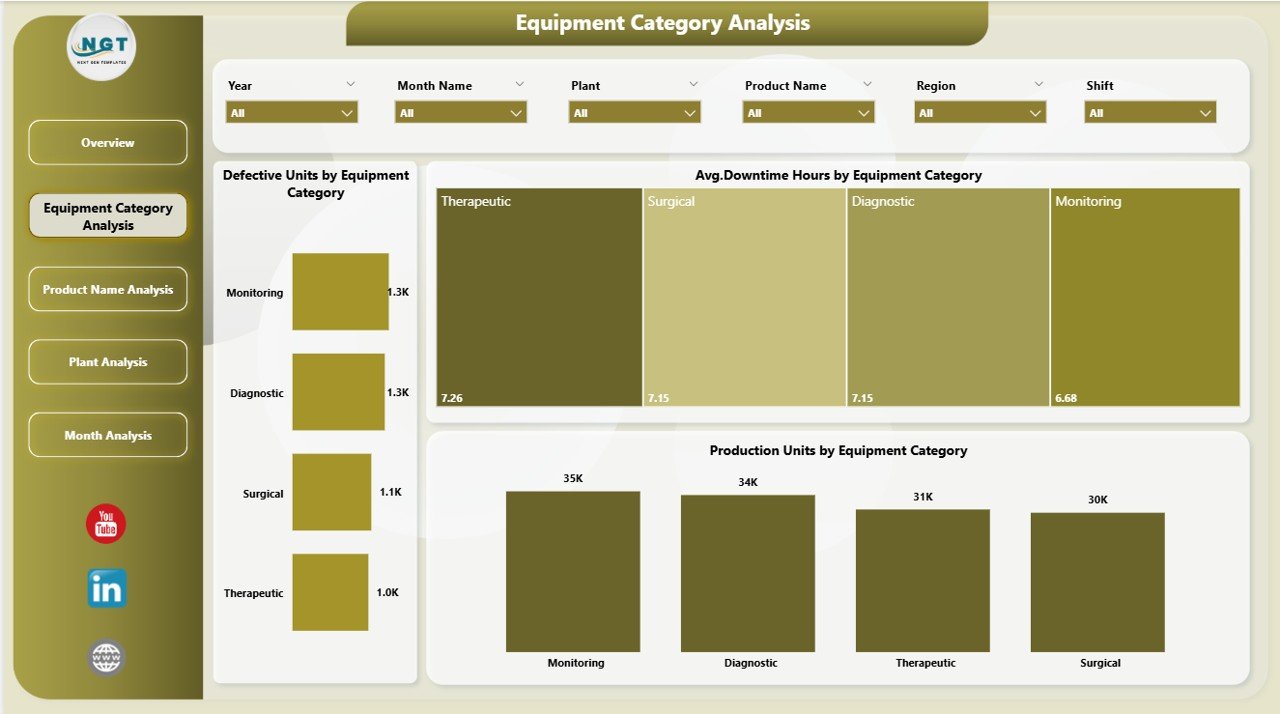
The Equipment Category Analysis Page focuses on equipment-level insights. Since equipment performance directly affects production quality and cost, this page plays a critical role.
Key Insights from Equipment Category Analysis
-
Cost of Defective Units by Equipment Type
Identify equipment that produces higher defect-related costs. -
Average Downtime Hours by Equipment Type
Detect machines causing frequent production stoppages. -
Production Units by Equipment Type
Compare output levels across equipment categories.
Because this page highlights inefficiencies clearly, maintenance teams prioritize upgrades and preventive maintenance effectively.
Product Name Analysis: Which Products Drive Cost and Output?
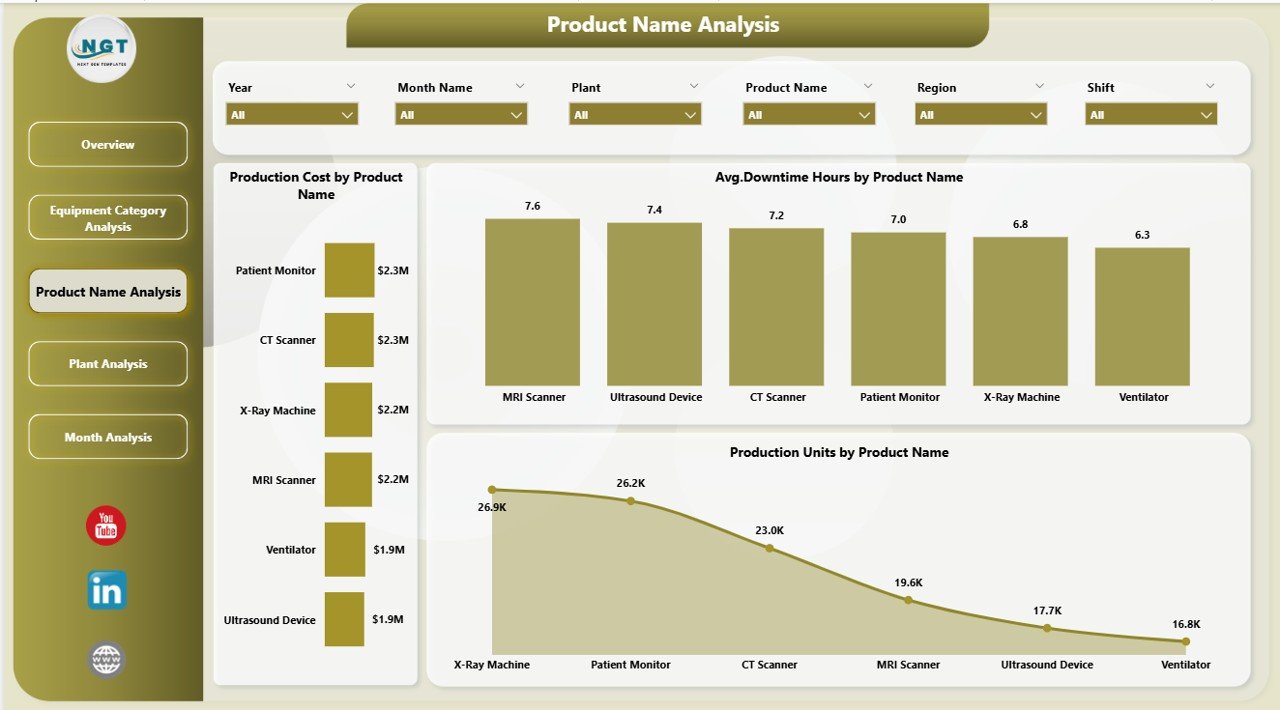
The Product Name Analysis Page focuses on individual medical equipment products. Since different products require different manufacturing processes, performance often varies.
Key Visuals on the Product Name Analysis Page
-
Production Cost by Product Name
Identify high-cost products quickly. -
Average Downtime Hours by Product Name
Detect products that cause frequent machine downtime. -
Production Units by Product Name
Compare production volumes across products.
As a result, manufacturers optimize product mix, pricing strategies, and production planning.
Plant Analysis: How Do Plants Compare in Manufacturing Efficiency?
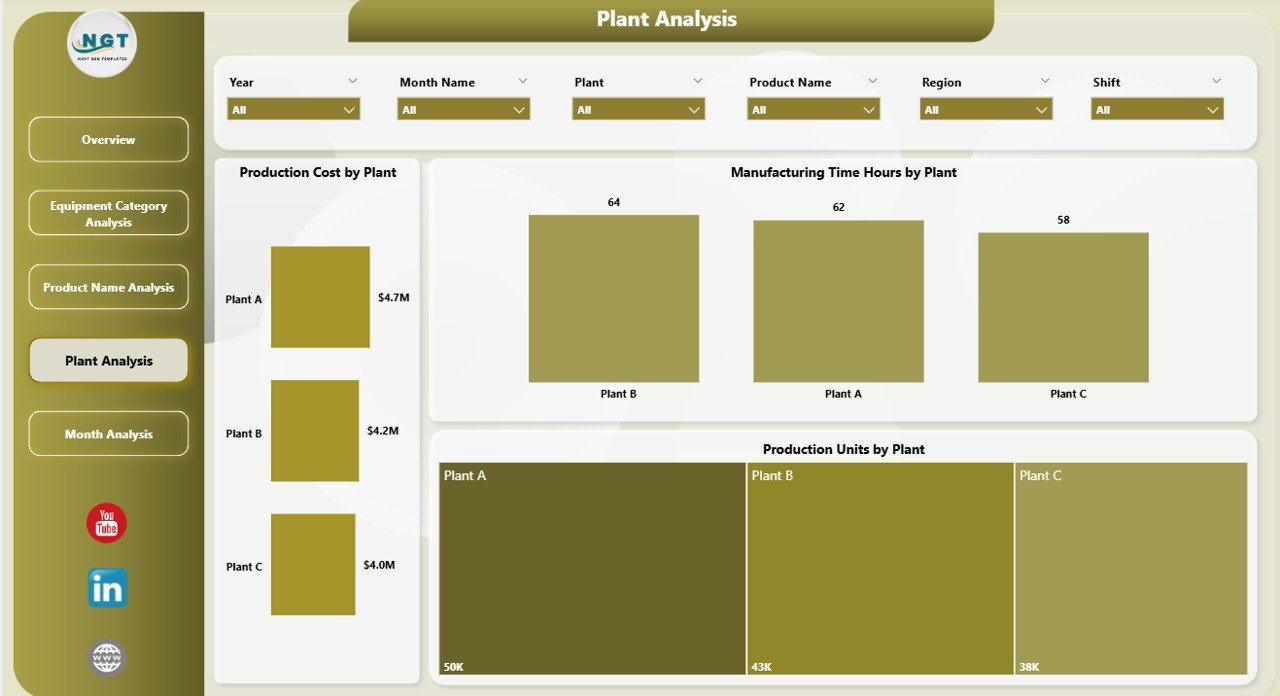
The Plant Analysis Page evaluates manufacturing performance at the plant level. Since many organizations operate multiple plants, this analysis becomes essential.
Key Metrics on the Plant Analysis Page
-
Production Cost by Plant
Compare manufacturing costs across plants. -
Manufacturing Time (Hours) by Plant
Identify plants with longer production cycles. -
Production Units by Plant
Measure plant-level output performance.
Because this page reveals performance gaps clearly, leadership improves resource allocation and standardizes best practices.
Month Analysis: How Does Manufacturing Performance Change Over Time?
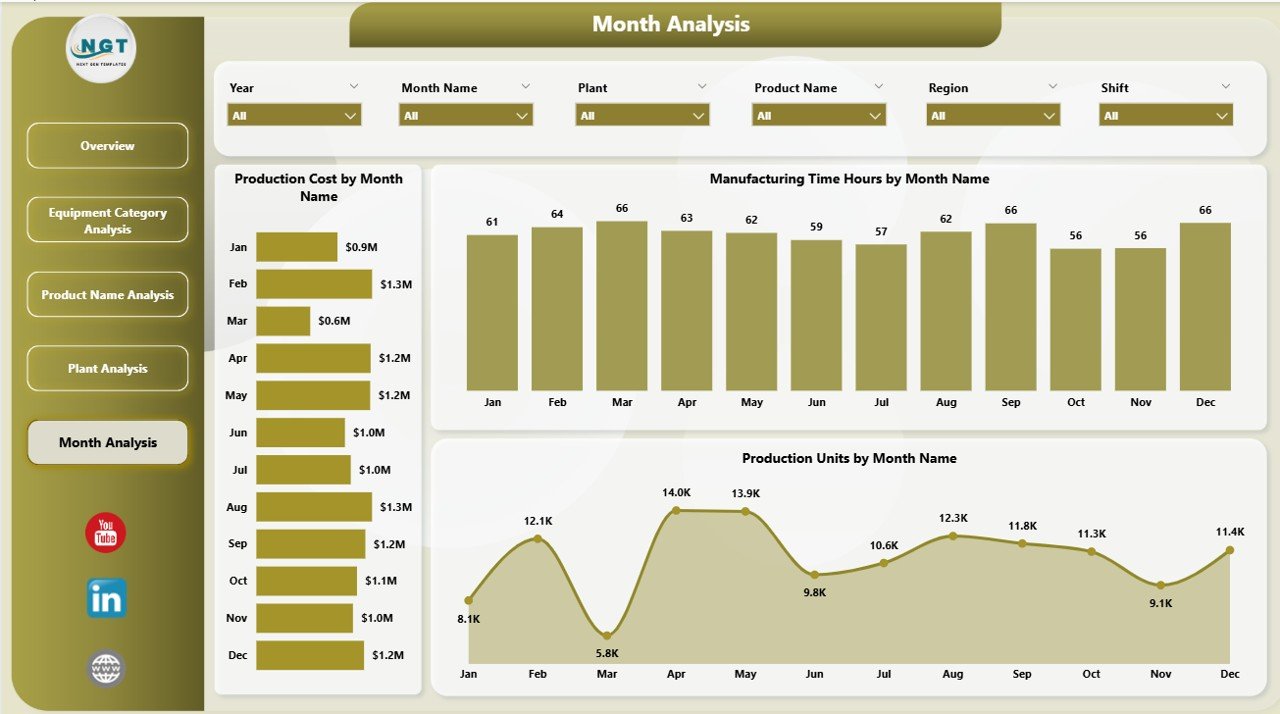
The Month Analysis Page focuses on time-based trends. Understanding month-wise changes helps manufacturers plan better.
Key Visuals on the Month Analysis Page
-
Production Cost by Month
Track cost fluctuations across months. -
Manufacturing Time (Hours) by Month
Identify periods with longer production cycles. -
Production Units by Month
Analyze seasonal demand and output trends.
As a result, planning teams forecast production, budget accurately, and align staffing needs.
Advantages of a Medical Equipment Manufacturing Dashboard in Power BI
A Power BI dashboard delivers measurable benefits across manufacturing operations.
1. Real-Time Visibility
Teams monitor production metrics instantly without manual reporting delays.
2. Better Cost Control
Manufacturers identify high-cost equipment, plants, and products quickly.
3. Reduced Downtime
Maintenance teams detect downtime trends early and act proactively.
4. Improved Production Planning
Data-driven insights improve scheduling and resource allocation.
5. Higher Decision Accuracy
Leadership makes confident decisions using trusted data.
Click to Purchases Medical Equipment Manufacturing Dashboard in Power BI
Opportunities for Improvement in Medical Equipment Manufacturing Dashboards
Although the dashboard provides powerful insights, continuous improvement always helps.
-
Add predictive maintenance indicators
-
Integrate quality compliance metrics
-
Include real-time IoT sensor data
-
Track energy and utility consumption
-
Enhance drill-through analysis
By evolving the dashboard over time, organizations gain deeper intelligence.
Best Practices for the Medical Equipment Manufacturing Dashboard in Power BI
Following best practices ensures long-term success.
1. Use Clean and Structured Data
Always validate data sources before connecting them to Power BI.
2. Focus on Business-Relevant KPIs
Avoid clutter and track only meaningful metrics.
3. Design for Simplicity
Use clear labels, consistent colors, and intuitive layouts.
4. Enable Role-Based Access
Provide customized views for executives, managers, and operators.
5. Review Dashboard Performance Regularly
Update visuals and KPIs as manufacturing goals change.
How Does This Dashboard Support Compliance and Quality Control?
Medical equipment manufacturing requires strict compliance. This dashboard supports compliance by:
-
Tracking defect costs and downtime
-
Identifying high-risk equipment
-
Supporting audit-ready reporting
-
Improving traceability across plants and products
As a result, compliance teams work proactively instead of reactively.
Who Can Use a Medical Equipment Manufacturing Dashboard in Power BI?
This dashboard benefits multiple stakeholders:
-
Production Managers
-
Plant Heads
-
Operations Teams
-
Quality Assurance Teams
-
Maintenance Engineers
-
Senior Leadership
Because Power BI requires no coding skills, everyone uses it easily.
Conclusion: Why Should You Use a Medical Equipment Manufacturing Dashboard in Power BI?
A Medical Equipment Manufacturing Dashboard in Power BI transforms manufacturing data into actionable intelligence. Instead of relying on disconnected reports, organizations gain a unified view of production cost, output, downtime, and efficiency.
With structured pages like Overview, Equipment Category Analysis, Product Name Analysis, Plant Analysis, and Month Analysis, this dashboard supports faster decisions, cost optimization, and operational excellence.
In a highly regulated and competitive industry, data-driven manufacturing is no longer optional. Therefore, adopting a Power BI dashboard becomes a strategic advantage.
Frequently Asked Questions About Medical Equipment Manufacturing Dashboard in Power BI
What is the main purpose of a Medical Equipment Manufacturing Dashboard in Power BI?
The dashboard provides real-time insights into production cost, output, downtime, and manufacturing efficiency.
Can non-technical users use this dashboard easily?
Yes, Power BI dashboards use interactive visuals and slicers that anyone can use.
Does this dashboard support multiple plants?
Yes, the Plant Analysis page compares performance across multiple manufacturing plants.
Can this dashboard help reduce production downtime?
Yes, by identifying downtime trends, teams act proactively and reduce interruptions.
Is this dashboard suitable for executive reporting?
Yes, the Overview Page delivers a high-level summary ideal for leadership.
Can the dashboard scale as data grows?
Yes, Power BI handles large datasets and scales efficiently with business growth.
Visit our YouTube channel to learn step-by-step video tutorials