New: NextGenTemplates Academy - video courses on Excel formulas with AI and Pivot Tables & dashboards. Early-bird: 20% off with code EARLYBIRD20 - first 20 orders only. See the courses →
  • Learn Excel (Free Course)
    • 1. Shortcut Keys
    • 2. Fill & Flash Fill
    • 3. Find & Replace
    • 4. Sort & Filter
    • 5. Formulas & Functions
    • 6. Data Validation
    • 7. Conditional Formatting
    • 8. Basic Charts
    • 9. Advanced Charts
    • 10. Pivot Tables
    • 11. Excel Dashboards
    • 12. VBA Course
    • 13. Excel Formulas with AI
  • Templates
  • Tutorials
    • Charts and Visualization
    • VBA
    • Excel Tips and Tricks
    • Excel Dashboards
    • Power Pivot & DAX
  • Power BI
  • Template Store
    • Ready to Use Templates
  • Courses
  • Academy
    • Excel + AI Mastery: 100 Formulas
    • Excel Pivot Tables & Dashboards
  • About Us
  • Contact Us

PK: An Excel Expert

Transforming Data into Decisions

Tag: downtime tracking

Dashboard Power BI

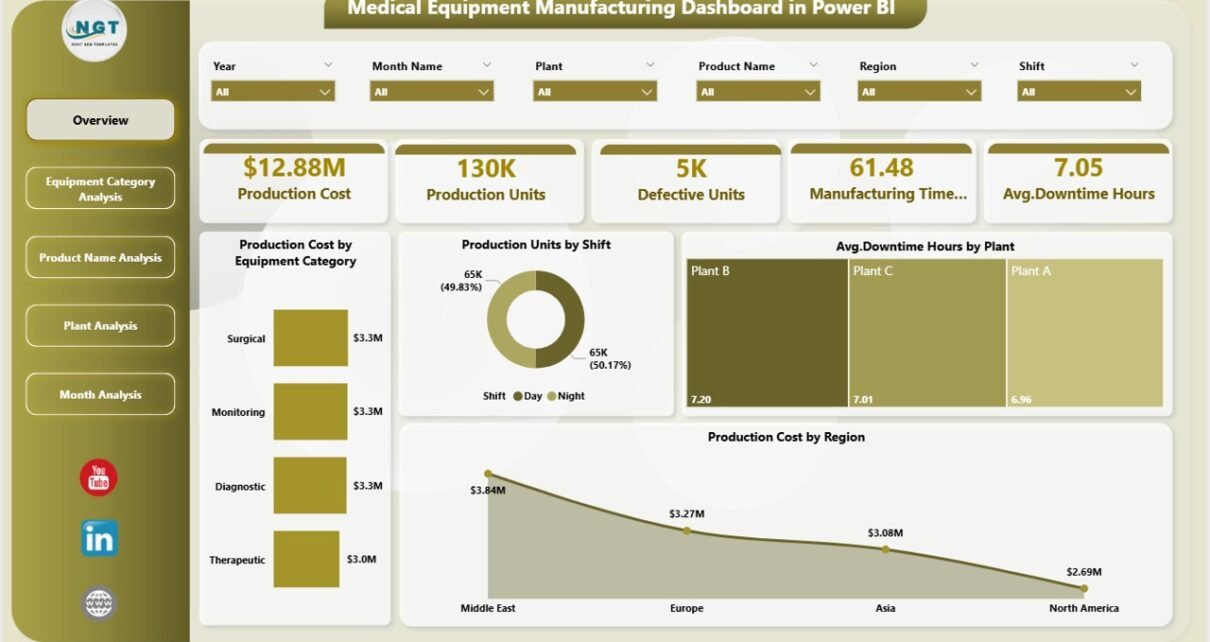
Medical Equipment Manufacturing Dashboard in Power BI

January 20, 2026January 20, 2026 PKComments Off on Medical Equipment Manufacturing Dashboard in Power BI
The medical equipment manufacturing industry runs on precision, compliance, and performance. Every delay, defect, or cost overrun directly affects patient safety, regulatory adherence, and profitability. Because of this, manufacturers must
Read More
Dashboard

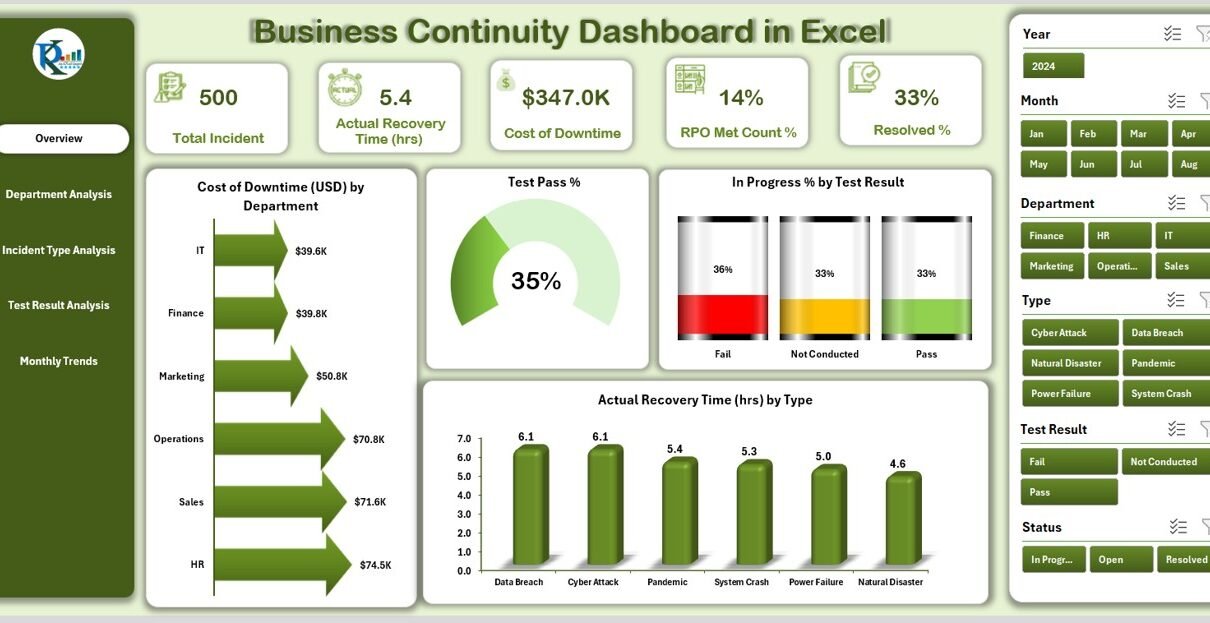
Business Continuity Dashboard in Excel

August 27, 2025August 27, 2025 PKComments Off on Business Continuity Dashboard in Excel
In today’s fast-changing business world, disruptions are inevitable. From cyberattacks to natural disasters and from power outages to supply chain delays, organizations must stay prepared. A single incident can impact
Read More
Power BI

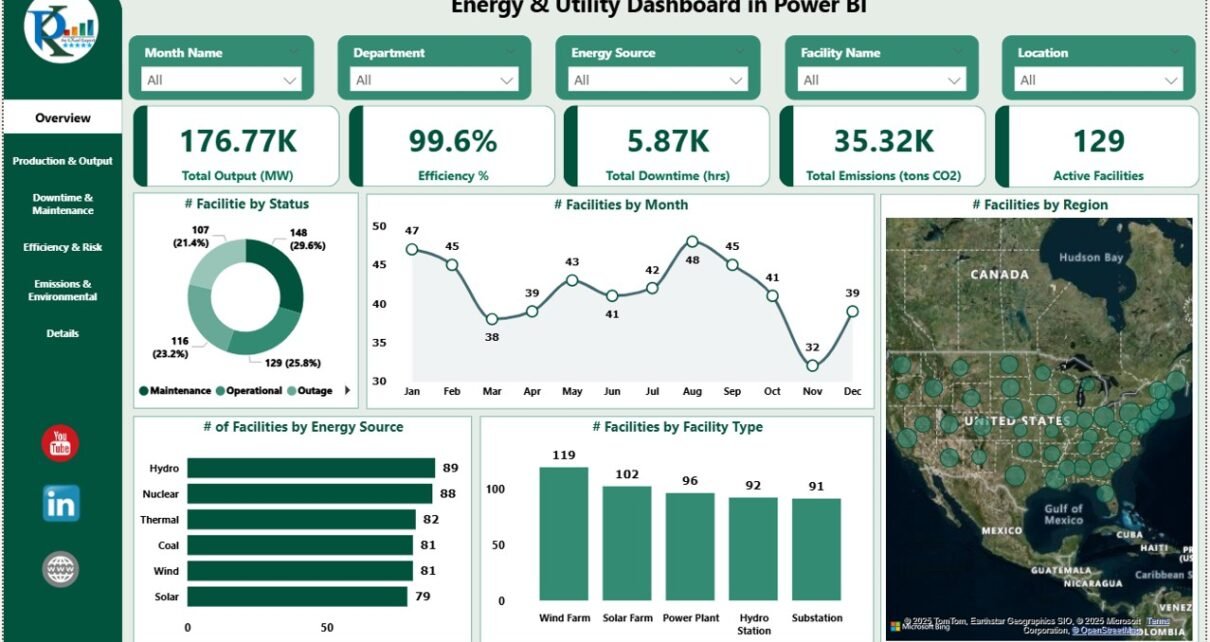
Energy & Utility Dashboard in Power BI

August 5, 2025August 5, 2025 PKComments Off on Energy & Utility Dashboard in Power BI
In today's energy industry, monitoring and managing performance is essential for maintaining efficiency, reducing downtime, and minimizing emissions. The Energy & Utility Dashboard in Power BI is a comprehensive tool
Read More
  • Learn Excel (Free Course)
    • 1. Shortcut Keys
    • 2. Fill & Flash Fill
    • 3. Find & Replace
    • 4. Sort & Filter
    • 5. Formulas & Functions
    • 6. Data Validation
    • 7. Conditional Formatting
    • 8. Basic Charts
    • 9. Advanced Charts
    • 10. Pivot Tables
    • 11. Excel Dashboards
    • 12. VBA Course
    • 13. Excel Formulas with AI
  • Templates
  • Tutorials
    • Charts and Visualization
    • VBA
    • Excel Tips and Tricks
    • Excel Dashboards
    • Power Pivot & DAX
  • Power BI
  • Template Store
    • Ready to Use Templates
  • Courses
  • Academy
    • Excel + AI Mastery: 100 Formulas
    • Excel Pivot Tables & Dashboards
  • About Us
  • Contact Us
Copyright © 2023 PK-AnExcelExpert.com - Privacy Policy