Internal audit teams now manage 20 to 200 active audits a year across multiple frameworks, regions, and risk levels. According to the Institute of Internal Auditors, more than 60% of audit departments still rely on disconnected spreadsheets, GRC platform exports, and SharePoint folders for monthly committee reporting. The Compliance Audits Dashboard in Excel replaces that scattered workflow with a single workbook that tracks audit findings, remediation, audit cost, penalties, and risk concentration across 7 sheets, 5 KPI cards, and 5 dashboard pages, all powered by pivot tables and slicers.
Whether you lead internal audit at a Fortune 500 manufacturer, manage SOX testing at a public company, or consult on GRC engagements for Big Four clients, manually consolidating audit data into a committee-ready view is slow and error-prone. This dashboard does that work for you, with a one-time $17.99 cost and full data ownership.
Click here to Purchase the Compliance Audits Dashboard in Excel
Key Features of Compliance Audits Dashboard in Excel
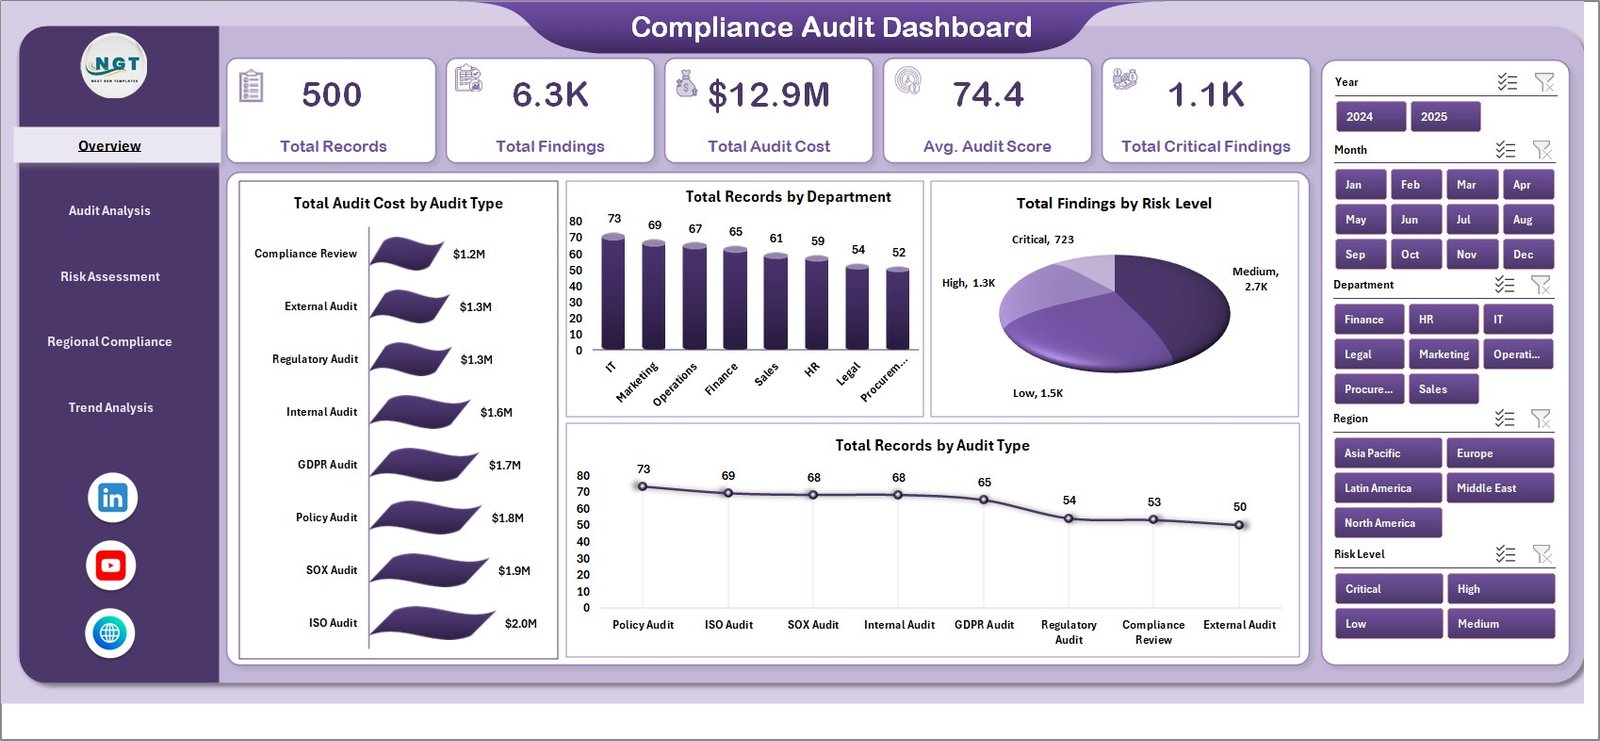
The dashboard is built around the questions Chief Compliance Officers, Heads of Internal Audit, and audit committee chairs ask every quarter. Total Records, Total Findings, Total Audit Cost, Avg. Audit Score, and Total Critical Findings sit as 5 executive cards on the Overview page, giving leaders an instant snapshot of audit volume, financial impact, and critical-risk exposure before they dig into the deeper analysis pages.
Every page includes slicers for fast filtering. You can isolate a department, region, audit type, compliance framework, risk level, priority, status, or month in one click. This is useful during audit committee walk-throughs, where stakeholders want to see how a particular region or framework is performing without rebuilding charts on the fly.
Pivot tables on the Support sheet feed every chart and KPI on the dashboard pages. After replacing rows on the Data sheet, a single Refresh All from the Excel Data ribbon rebuilds the entire workbook. No DAX, no macros, no VBA, no third-party add-ins.
Dashboard Pages Explanation
Click here to purchase Compliance Audits Dashboard in Excel
Overview Page
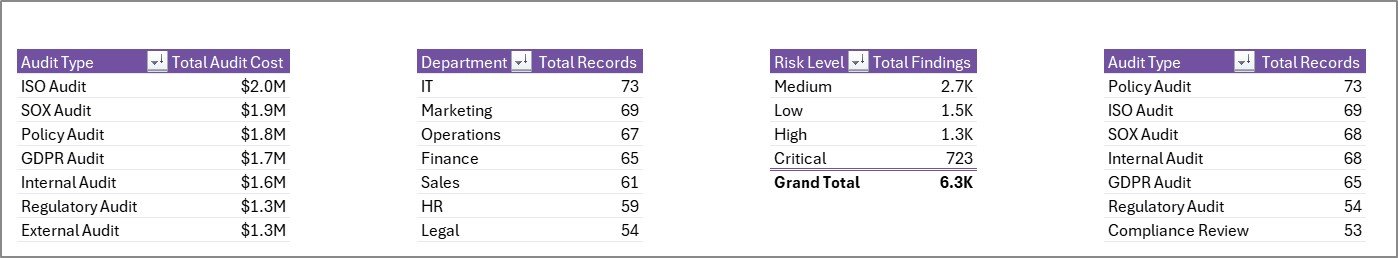
The Overview page is the executive view. Total Records, Total Findings, Total Audit Cost, Avg. Audit Score, and Total Critical Findings are displayed as 5 KPI cards at the top. Total Audit Cost by Audit Type compares spend across internal, external, regulatory, IT, and operational audits. Total Records by Department shows which functions absorb the most audit activity. Total Findings by Risk Level breaks out critical, high, medium, and low-risk exposure. Total Records by Audit Type confirms the overall audit portfolio mix.
Compliance Audits Dashboard in Excel
Audit Analysis
The Audit Analysis page focuses on execution and remediation progress. Total Findings vs Total Remediated by Compliance Framework compares closure rates across SOX, ISO 27001, GDPR, HIPAA, PCI-DSS, and internal control frameworks. Total Audit Cost by Department reveals which functions drive the largest audit spend. Total Records by Risk Level shows the overall risk distribution, and Total Records by Month reveals audit cadence and seasonality.
Click here to purchase Compliance Audits Dashboard in Excel
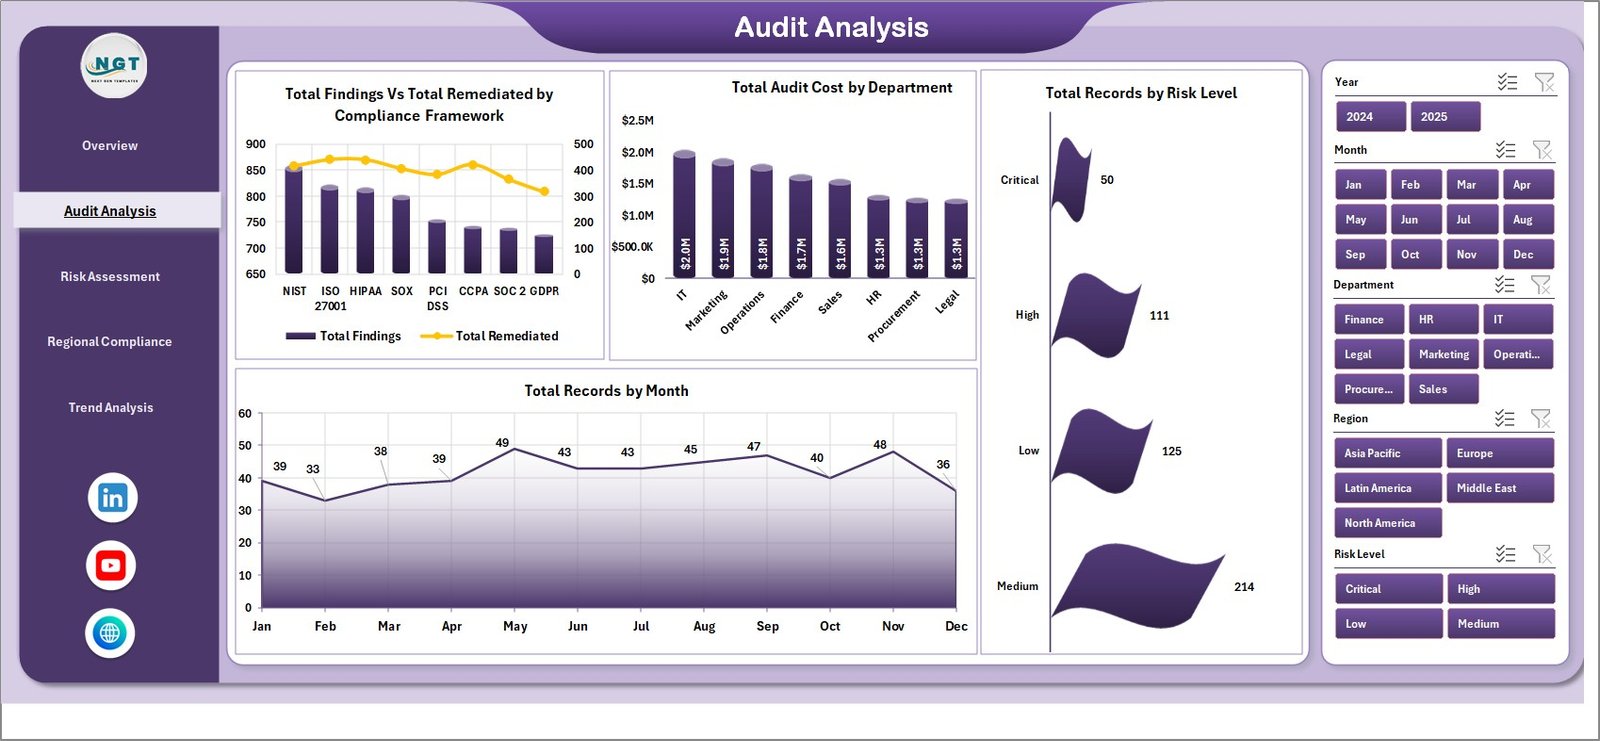
Audit Analysis
Risk Assessment
The Risk Assessment page is the page risk officers will return to weekly. Total Audit Cost by Risk Level connects financial impact to severity. Total Findings vs Total Remediated by Priority shows whether high-priority findings are being closed first. Total Findings vs Total Remediated by Region highlights geographic remediation gaps that need investment. Total Records by Priority confirms how the team is sequencing audit work.
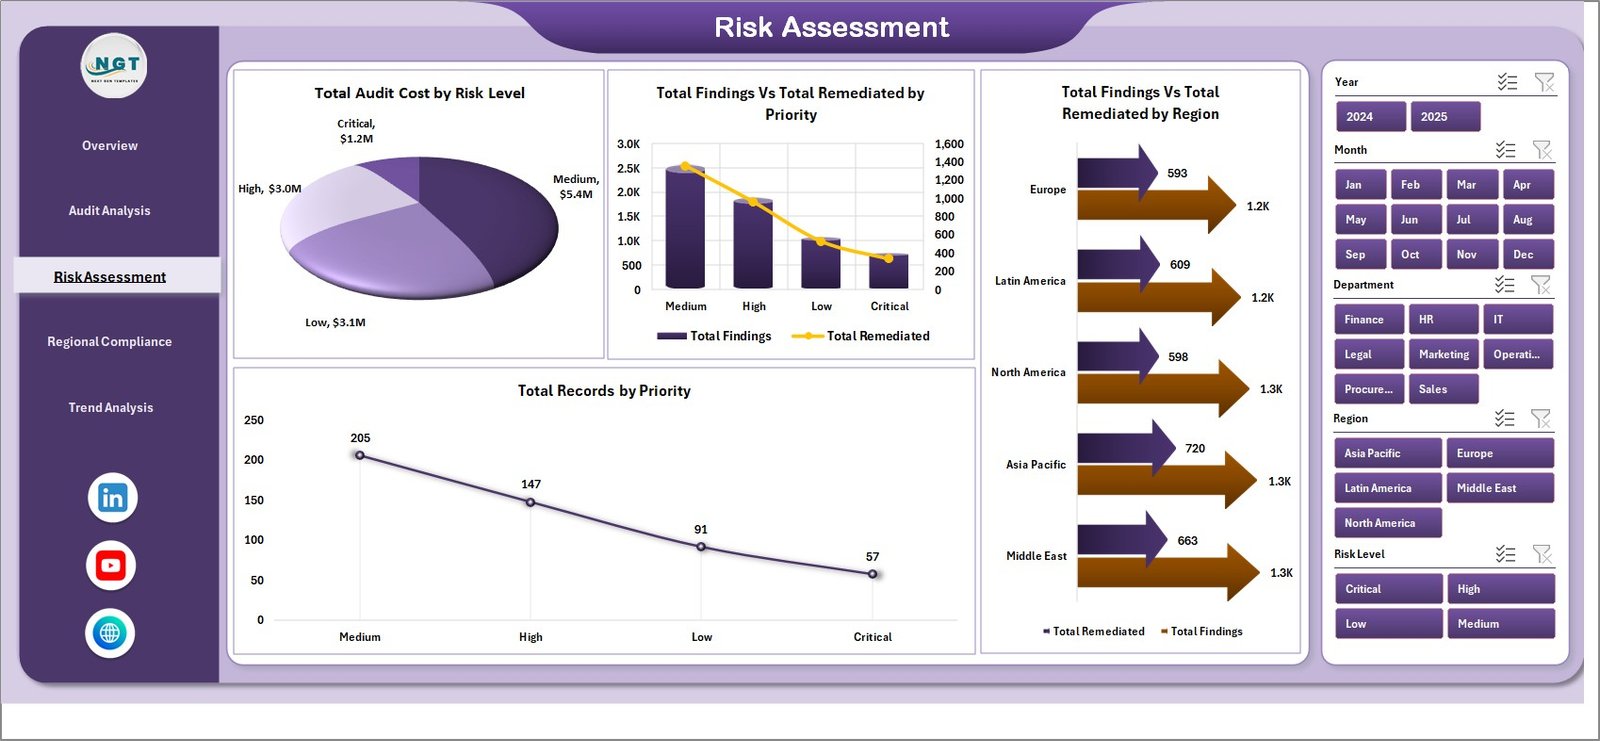
Risk Assessment
Regional Compliance
The Regional Compliance page is for multi-region or multi-entity compliance teams. Total Audit Cost by Region compares audit spend across geographies. Total Penalties by Region surfaces where regulatory fines are concentrated, so leadership can target compliance investment. Total Findings vs Total Remediated by Month tracks closure velocity, and Total Findings by Department identifies functions that need controls strengthening.
Click here to purchase Compliance Audits Dashboard in Excel
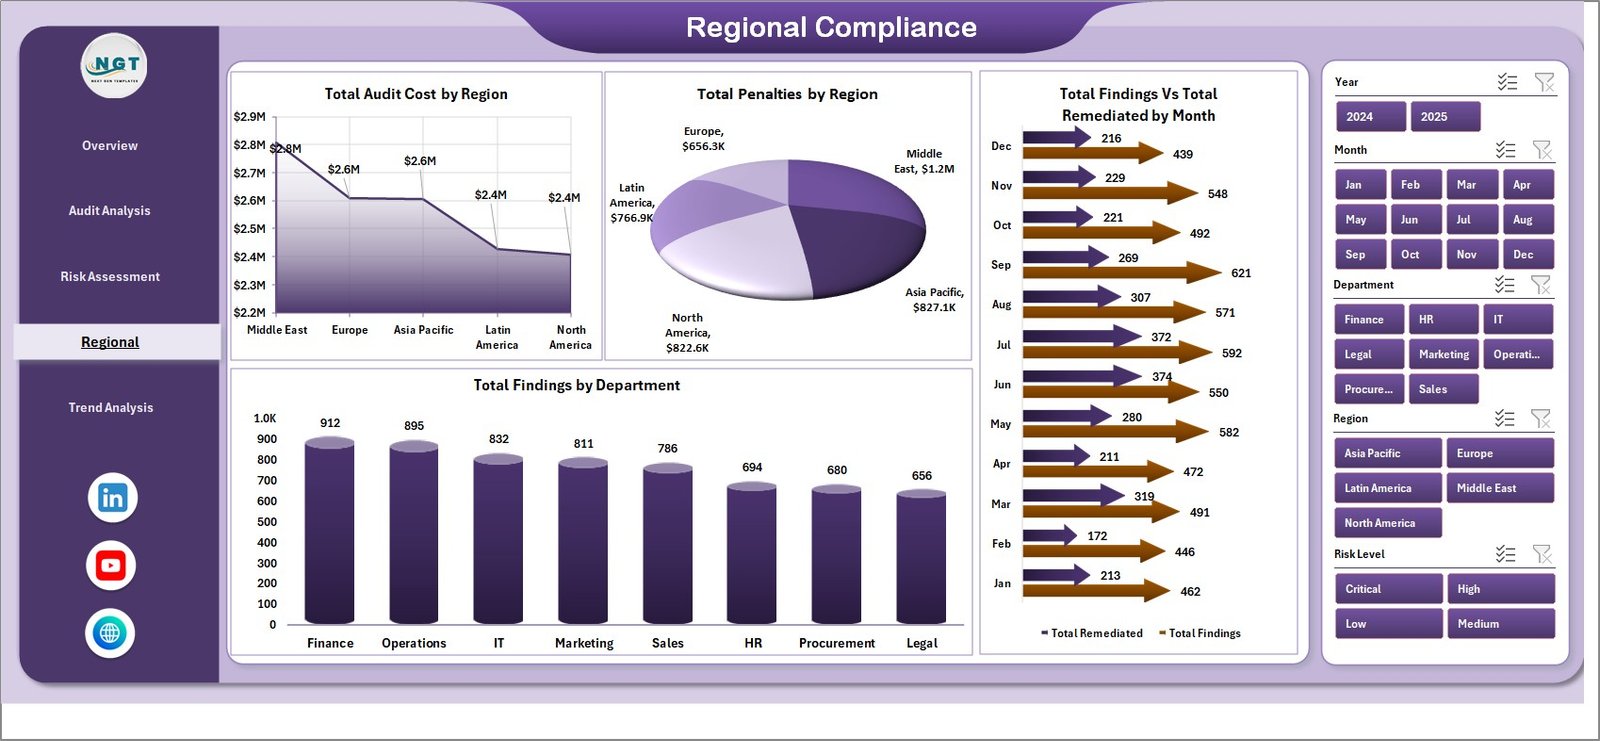
Regional Compliance
Trend Analysis
The Trend Analysis page supports year-over-year reporting for the audit committee and board risk committee. Total Audit Cost by Month reveals spending patterns across the audit calendar. Total Records by Status shows the open, in-progress, closed, and overdue audit pipeline. Total Records vs Total Findings by Year is the chart audit committee chairs love because it provides immediate context on whether finding rates are improving year over year.
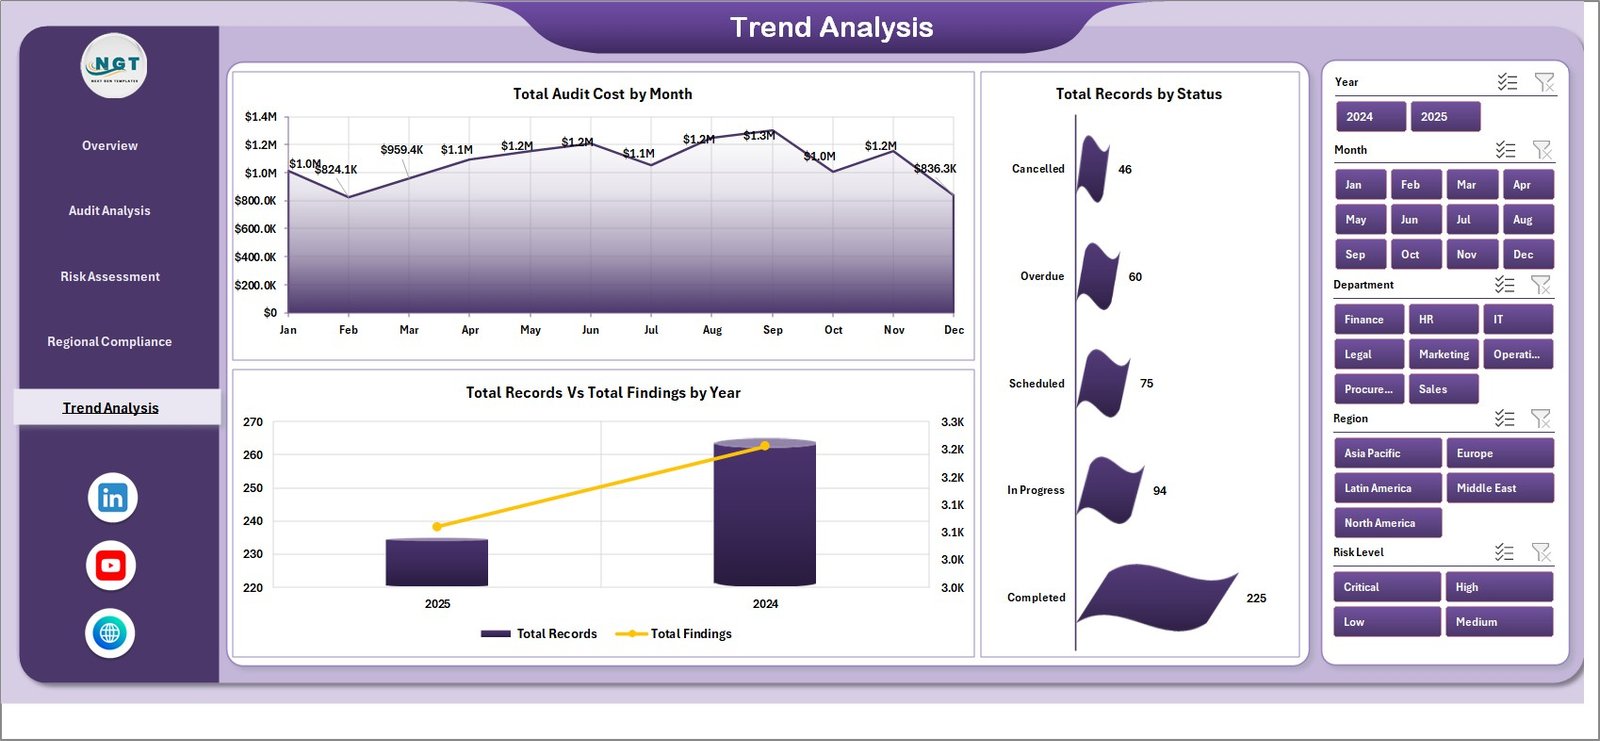
Trend Analysis
Data Sheet
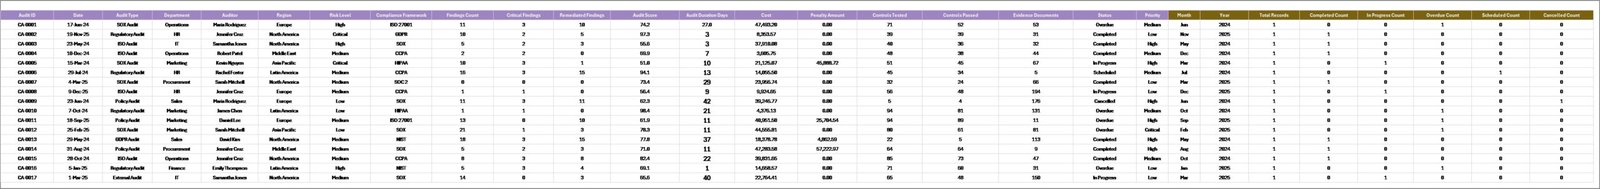
The Data Sheet is where you replace the sample audit records with your own data. Keep the same column structure (date, audit type, department, region, framework, risk level, priority, status, findings, remediated count, audit cost, penalties, audit score), paste your updated rows, and refresh the workbook.
Click here to purchase Compliance Audits Dashboard in Excel
Data Sheet tab
Support Sheet
The Support Sheet contains every pivot table that drives the dashboard. After replacing rows on the Data sheet, click Refresh All from the Excel Data ribbon. Once the dashboard is ready for the audit committee, you can keep this sheet hidden so reviewers only see the polished views.
Support sheet tab
Compliance Audit Dashboard in Excel vs Google Sheets vs Paid GRC Platforms – Feature Comparison
| Feature | Compliance Audit Dashboard in Excel | Google Sheets Alternative | Paid GRC SaaS (AuditBoard / LogicGate / MetricStream) |
|---|---|---|---|
| Cost | $17.99 one-time | $9.99 one-time browser version | Often $30,000 to $250,000+ per year |
| Platform | Microsoft Excel desktop workbook | Browser-based Google Sheets | Hosted GRC cloud platform |
| Setup time | Under 10 minutes | Under 10 minutes | Several months of onboarding |
| Real-time team collaboration | Possible via OneDrive or SharePoint | Built in | Built in |
| Customizable frameworks & KPIs | Fully editable | Fully editable | Limited to vendor configuration |
| Audit committee reporting | Built in | Built in | Built in |
| Year-1 cost at 5 users | $17.99 total | Typically under $20 total | Often $30,000 to $250,000+ |
For internal audit teams, compliance officers, and GRC consultants that want clear audit reporting without paying for an enterprise GRC platform, the Compliance Audit Dashboard in Excel sits in the sweet spot.
Click here to purchase Compliance Audits Dashboard in Excel
Who Should Use This Template
This template is a good fit for Chief Compliance Officers, Heads of Internal Audit, GRC managers, risk officers, SOX program managers, compliance analysts, and Big Four GRC consultants who already work from Excel exports. It is especially useful when the team needs monthly or quarterly visibility into findings, remediation status, audit cost, penalties by region, and risk concentration.
It is not meant to replace a full GRC automation platform. If your team needs live SAP or ServiceNow integration, automated control testing, evidence-collection workflows, SOC 2 audit logs, or enterprise SSO, a paid tool such as AuditBoard, LogicGate, MetricStream, or ServiceNow GRC may be the better choice.
Real-World Use Cases
Anita is Head of Internal Audit at a Fortune 500 manufacturer. Before every quarterly audit committee meeting she opens the Overview and Risk Assessment pages, filters by department and priority, and uses Total Findings vs Total Remediated by Priority to identify high-risk findings that are still open. The slicer-driven workflow has cut her prep time from a full day to roughly 90 minutes.
Marco runs the SOX program at a US public company. He uses the Audit Analysis page to show external auditors Total Findings vs Total Remediated by Compliance Framework. The chart helps him prove SOX readiness without dragging out individual control test results from multiple spreadsheets.
Priya is a Big Four GRC consultant. She creates one copy of the dashboard for each client engagement and uses the Regional Compliance page to compare audit cost and penalties across regions. The same workbook doubles as a discovery deck during the kickoff phase of new engagements.
Click here to purchase Compliance Audits Dashboard in Excel
Advantages of Compliance Audit Dashboard in Excel
The first advantage is speed. You do not need to design charts, configure pivot tables, or build the dashboard structure from scratch. The workbook is already organized around the questions audit committees ask: how many findings, where, what severity, what cost, and how much has been remediated.
The second advantage is data ownership. Your audit records stay in an Excel file you control. For compliance teams that need to demonstrate data residency to regulators or that work in sectors where sending audit data to a third-party GRC vendor is not allowed, this matters.
The third advantage is cost. At $17.99 one-time, the dashboard is easy to justify against a $30,000 to $250,000 annual GRC SaaS contract, especially when your immediate need is structured reporting, not workflow automation.
Opportunities for Improvement
The dashboard depends on clean data. If your audit records, GRC exports, or regional spreadsheets use inconsistent department, region, or framework names, you will need to standardize the values before pasting rows into the Data sheet. The workbook is also a manual-refresh template, so teams that need live updates every few minutes should consider a GRC platform or a Power BI model instead.
Advanced audit teams may want to extend the dashboard with additional fields such as control owner, remediation owner, due date, days overdue, evidence link, or root cause category. Because the workbook is editable, those additions are possible, but they require basic Excel pivot-table skills.
Click here to purchase Compliance Audits Dashboard in Excel
Best Practices
- Keep the Data Sheet headers consistent so the pivot tables refresh cleanly.
- Refresh the workbook before every audit committee or risk committee meeting.
- Use slicers before drawing conclusions so you are reviewing the right department, region, framework, or risk level.
- Hide the Support Sheet before sharing the workbook with the audit committee or external auditors.
- Save a quarterly snapshot of the file so you can compare audit performance over time and support audit committee narratives with historical context.
- Document each framework’s testing approach inside the workbook so external auditors and regulators see a complete picture, not just numbers. Microsoft Learn has a useful primer on creating pivot tables to analyze worksheet data if your team is new to pivot-driven workflows.
Explore Relevant Templates
For a cloud-based version, see the Compliance and Audits Dashboard in Google Sheets. For a Power BI version with DAX measures and drill-through pages, see the Compliance and Audit Dashboard in Power BI. If you need a peer compliance template, look at the Risk Management Dashboard in Excel. You can also browse the full Excel Dashboard Templates collection. Related reading on this blog: SaaS Customer Success Dashboard in Excel, which uses the same 7-sheet pivot-driven architecture.
Click here to purchase Compliance Audits Dashboard in Excel
Frequently Asked Questions
What KPIs does the Compliance Audit Dashboard in Excel track?
It tracks Total Records, Total Findings, Total Audit Cost, Avg. Audit Score, and Total Critical Findings, plus detailed views for Total Audit Cost by Audit Type, Total Findings vs Total Remediated by Compliance Framework, Total Penalties by Region, and year-over-year Total Records vs Total Findings.
How do I update the dashboard?
Replace the sample rows in the Data Sheet, keep the same headers, then click Refresh All from the Excel Data ribbon.
Does this workbook require macros?
No. It uses standard Excel tables, pivot tables, charts, and slicers. There are no macros, no VBA, and no security warnings on open.
Can I customize it for my compliance frameworks?
Yes. You can edit the framework list, add new departments or regions, adjust pivot fields, change chart formatting, and extend the workbook for your audit program.
Is this better than a GRC platform?
Click here to purchase Compliance Audits Dashboard in Excel
It is better for fast, low-cost audit reporting. A full GRC platform is better when you need live integrations, automated control testing, evidence workflows, audit logs, and enterprise permissions.
Can I use it for ESG audits or third-party risk?
Yes. It can work for ESG audits, third-party risk assessments, vendor compliance reviews, and operational risk audits if your data fits the date, audit type, department, framework, region, risk level, priority, and findings structure.
About the Author
Built by PK – Microsoft Certified Professional with 15+ years of Excel, Google Sheets, and Power BI experience. Founder of NextGenTemplates, reaching 300K+ subscribers across YouTube channels (@PK-AnExcelExpert, @NextGenTemplates, @NeoTechNavigators). Every template is hand-built and tested before release.
Click here to purchase Compliance Audits Dashboard in Excel
Conclusion
The Compliance Audit Dashboard in Excel gives internal audit teams, GRC managers, and compliance officers a practical way to review audit findings, remediation status, audit cost, penalties, and risk concentration from a single workbook. It is not trying to be a full GRC automation platform. It is a clean, affordable reporting layer for teams that want clarity now, using the Excel workflow they already know.
Click here to purchase Compliance Audits Dashboard in Excel
Watch Excel, dashboard, and reporting tutorials on Youtube.com/@PK-AnExcelExpert.
Last updated: May 2026