Ask the owner of a home inspection company how last month went and you usually get a story. The spring rush finally eased, two reports went out late because an inspector was off sick, a buyer’s agent called back about a missed roof issue, and the office cannot remember whether referrals are up or down. All of it is true, and none of it tells you whether the month was better or worse than the one before.
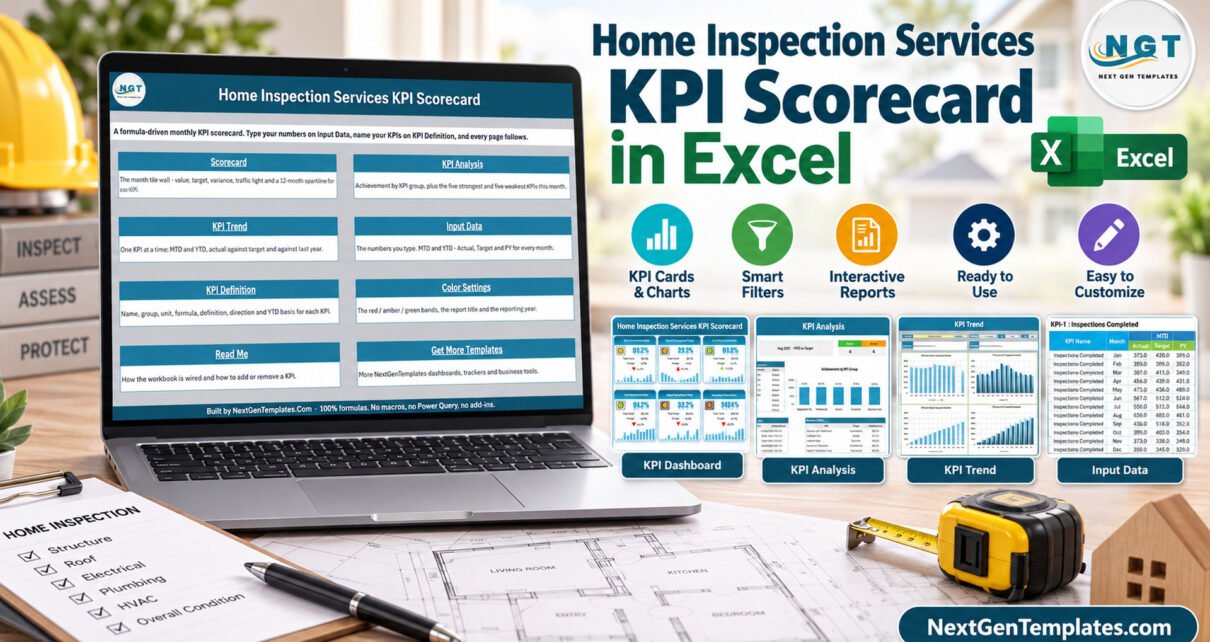
The Home Inspection Services KPI Scorecard in Excel turns those stories into numbers you can compare: 10 home inspection KPIs in 5 groups, laid out as tiles with traffic lights and a 12-month sparkline, across 9 visible sheets. It arrives loaded with a full 2025 sample year, and on Aug-2025 it reads 4 Green, 4 Amber and 2 Red. This article walks through what is on each sheet, how the lights decide, and how to load your own figures.
A quick word on naming, because NextGenTemplates sells several products with similar titles. This is the KPI Scorecard family – a tile-based monthly management report driven by numbers you type. The Home Inspection Services KPI Dashboard in Excel is a separate product in the larger KPI Dashboard family, and there is also a Google Sheets edition of this scorecard with its own KPI list. If you run another home services business, the Pest Control Business KPI Scorecard in Excel uses the same engine as this one.
Key Features of the Home Inspection Services KPI Scorecard in Excel
- Ten home inspection KPIs. Inspections Completed, On-Time Arrival Rate, Report Turnaround Time, Same-Day Report Rate, Defect Catch Rate, Callback Rate, Customer Satisfaction, Referral Rate, Revenue per Inspection and Inspector Utilization.
- A header you drive from dropdowns. Select Month, an MTD / YTD switch, a Vs. selector (Target, PY or Prior Month) and a KPI set picker for KPI 1-10 or KPI 11-20.
- Traffic lights that respect direction. Eight KPIs are upper-the-better and two are lower-the-better, so a shorter report turnaround or a lower callback rate turns green.
- Editable thresholds. The RAG bands live in ordinary cells on Color Settings. Amber defaults to within 10% of the comparison value.
- Analysis and trend pages. KPI Analysis ranks the Top 5 and Bottom 5 KPIs and rolls achievement up by group; KPI Trend charts one KPI by month against target and prior year.
- No macros at all. Formulas, conditional formatting, camera pictures and sparklines only, in a plain .xlsx that opens in Excel 2016 or later.
The Ten Home Inspection KPIs, and Why These Ten
The KPI set covers the five things that decide whether an inspection firm grows: how many jobs it completes and whether inspectors arrive on time, how fast reports reach the client, how reliable the findings are, whether clients and agents come back, and what each inspection earns.
| Group | KPI | What it measures | Direction |
|---|---|---|---|
| Inspection Ops | Inspections Completed | Total number of home inspections completed in the month | Higher is better |
| Inspection Ops | On-Time Arrival Rate | Share of appointments where the inspector arrived within the booked window | Higher is better |
| Turnaround | Report Turnaround Time | Average hours from finishing the inspection to delivering the report | Lower is better |
| Turnaround | Same-Day Report Rate | Share of inspections whose report is delivered the same calendar day | Higher is better |
| Quality | Defect Catch Rate | Share of known defects the inspector correctly identified in QA-audited jobs | Higher is better |
| Quality | Callback Rate | Share of inspections needing a return visit to correct or complete the report | Lower is better |
| Customer | Customer Satisfaction | Average client score from the post-inspection survey | Higher is better |
| Customer | Referral Rate | Share of new bookings that came from an existing client or agent referral | Higher is better |
| Commercial | Revenue per Inspection | Average billed revenue per completed inspection | Higher is better |
| Commercial | Inspector Utilization | Share of available inspector hours spent on billable inspection work | Higher is better |
Report Turnaround Time and Same-Day Report Rate are the pair worth reading together. Turnaround says how long the average client waits; the same-day share says how often you beat the deadline that buyers and agents actually care about. None of the ten names is fixed – every page looks a KPI up by name, so renaming one on KPI Definition carries through the whole workbook.
How the Traffic Lights Decide Green, Amber and Red
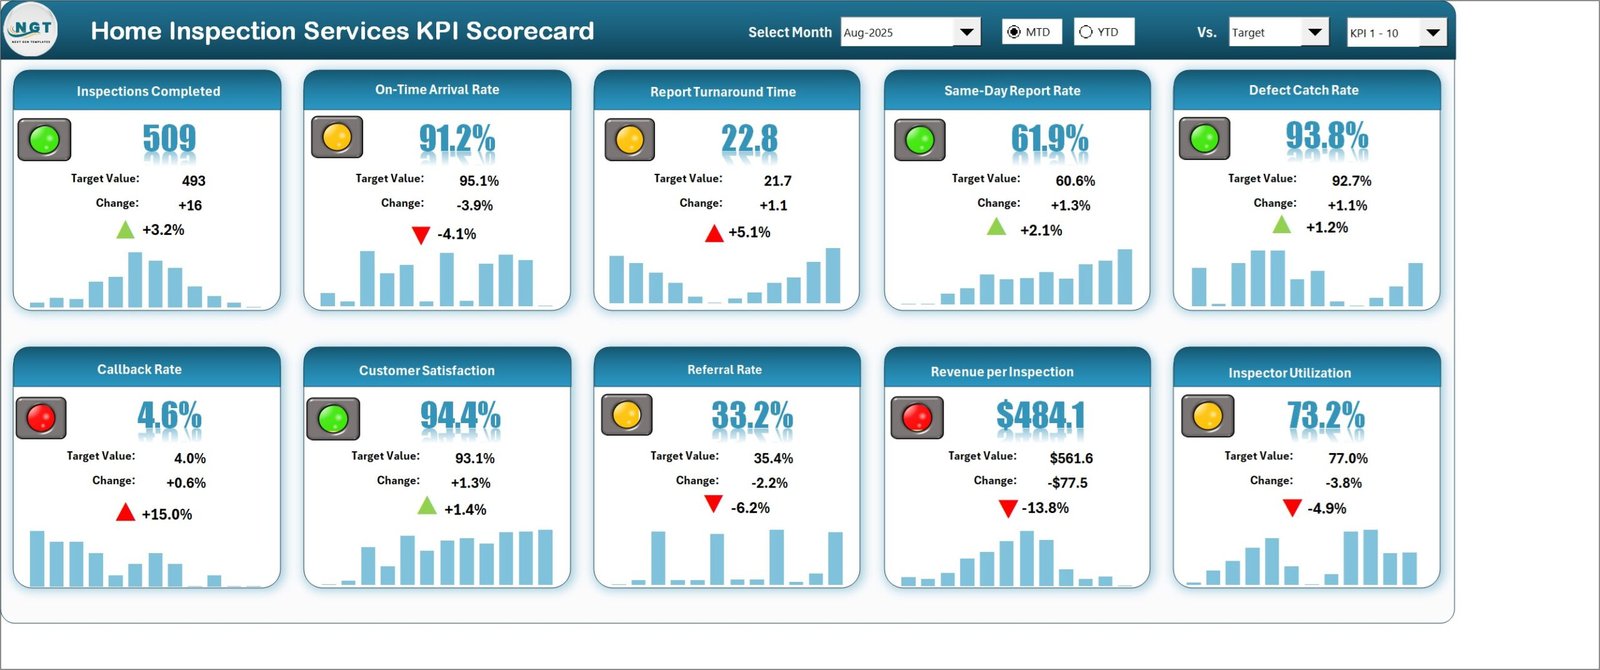
Each tile compares the selected value with the comparison value you chose in the Vs. box. For upper-the-better KPIs, Green means at or above the comparison, Amber means up to 10% below it and Red means more than 10% below. Lower-the-better KPIs flip the logic, so a Callback Rate of 4.6% against a 4.0% target is 15.0% worse and shows Red even though the number went up. A KPI with a blank or zero comparison value reads n/a instead of guessing.
The bands are the yellow cells on Color Settings. If a 10% amber band is too generous for arrival punctuality, tighten it there and every tile, the counter strip and the KPI Analysis tables re-flag themselves.
Workbook Sheets Explained
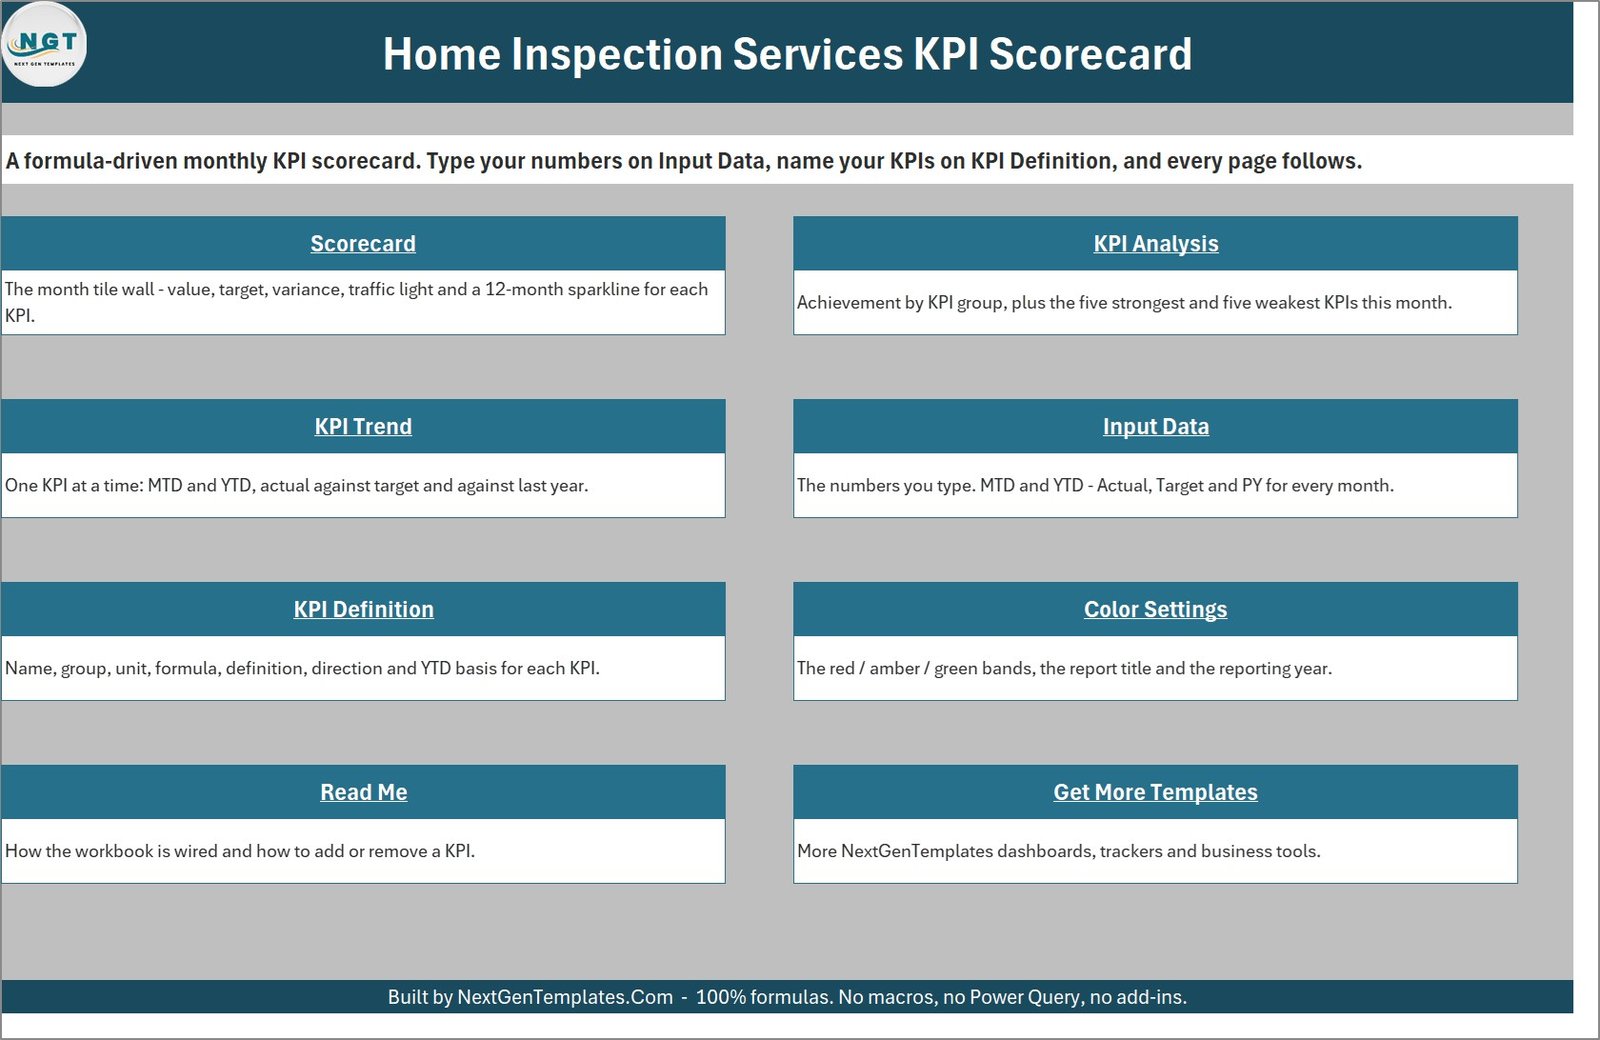
Scorecard
Ten KPI tiles for the selected month, each with a traffic light, the value, the target, the change, a direction arrow and a 12-month sparkline.
KPI Analysis
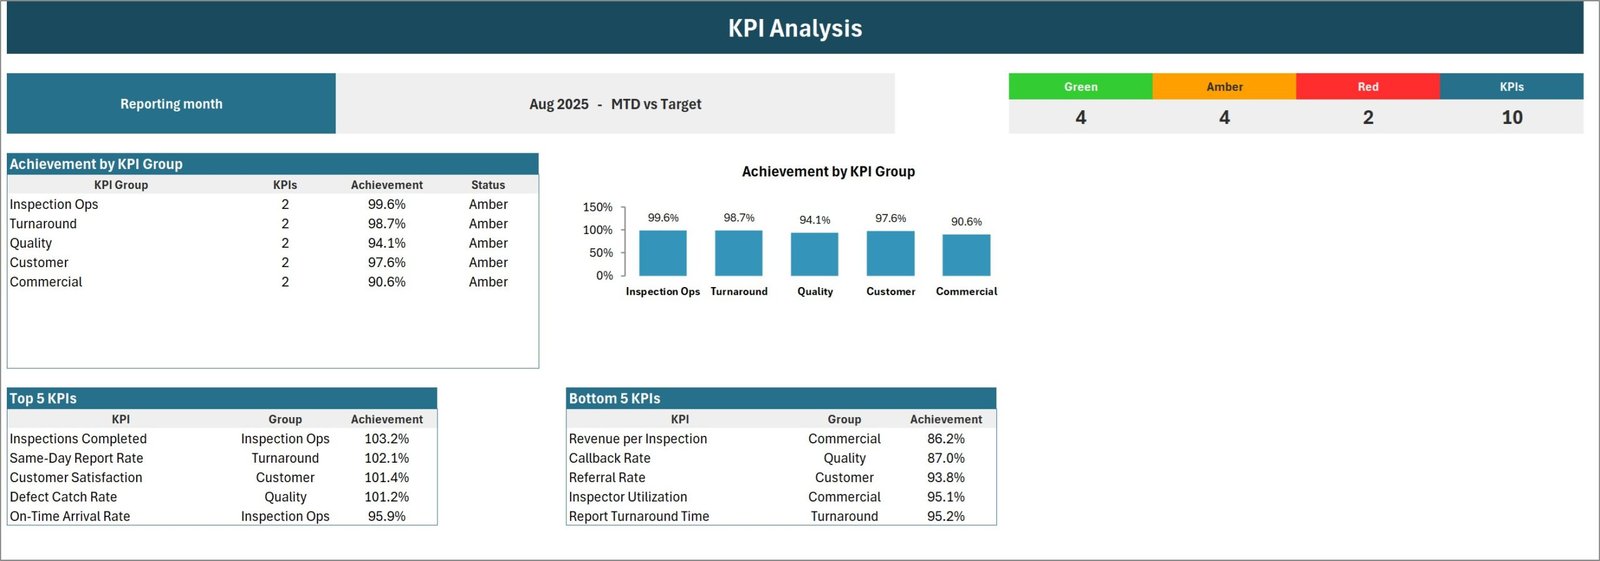
A Green / Amber / Red / KPIs counter strip, Achievement by KPI Group with a column chart, and the Top 5 and Bottom 5 KPIs for the month.
KPI Trend
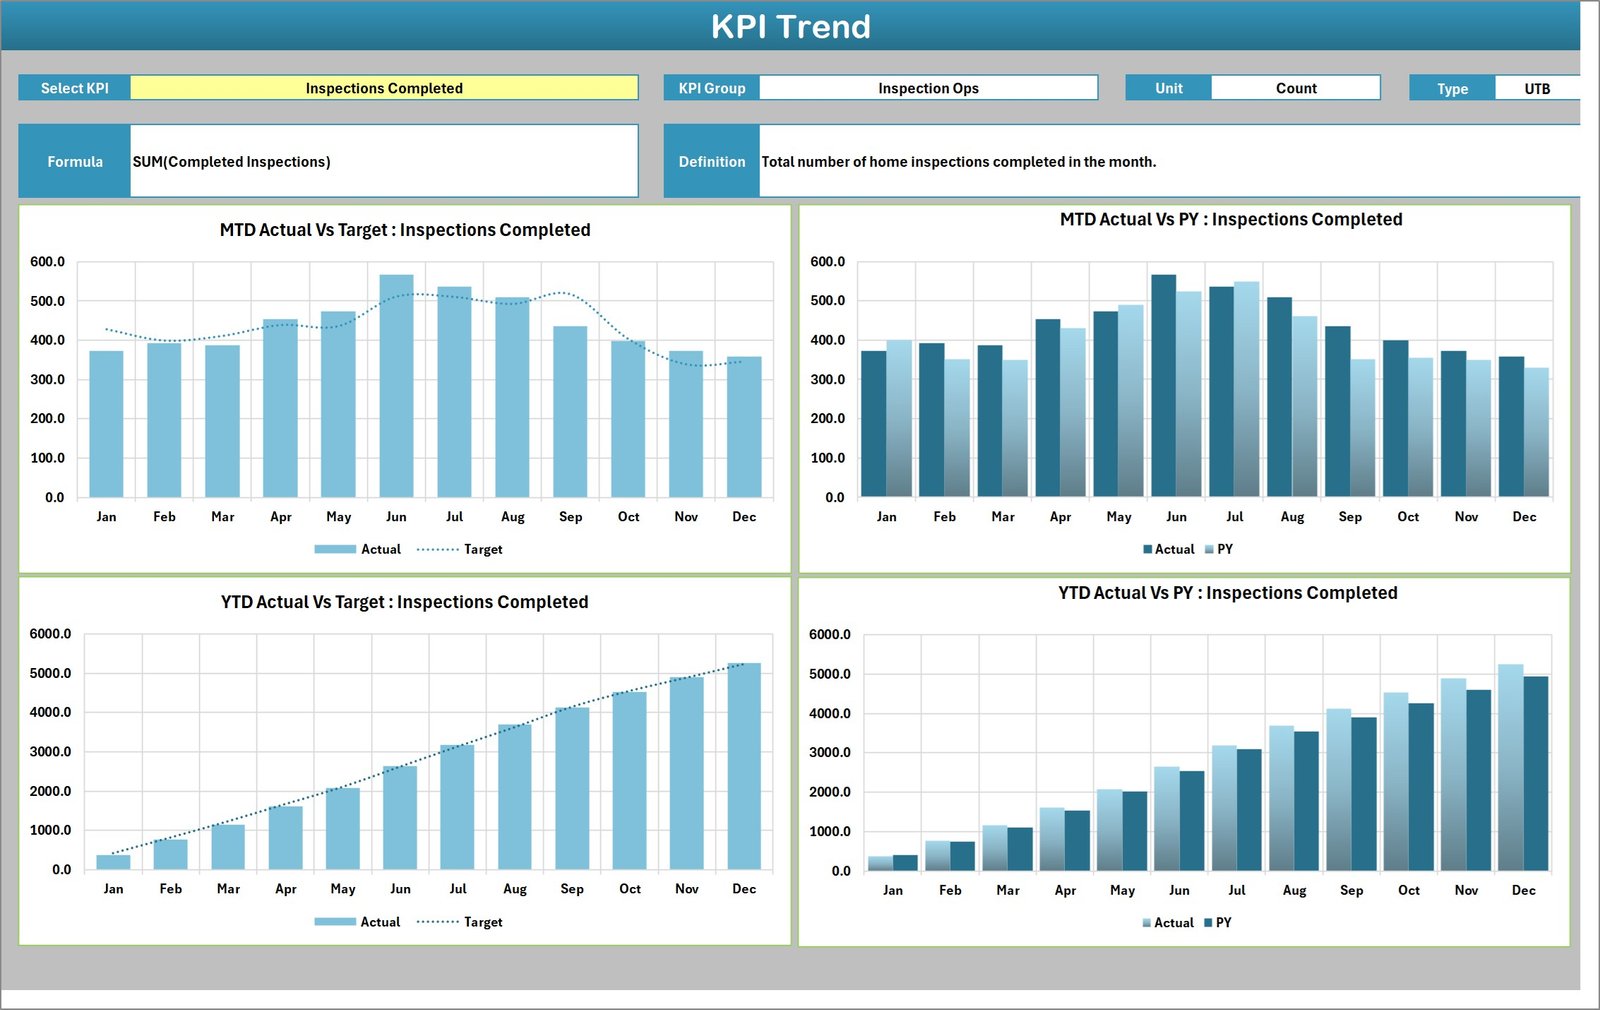
Choose one KPI and see its group, unit, type, formula and definition above four charts: MTD Actual vs Target, MTD Actual vs PY, YTD Actual vs Target and YTD Actual vs PY.
Input Data and KPI Definition
Input Data holds one block per KPI with twelve month rows of MTD Actual, Target and PY plus the YTD equivalents. KPI Definition holds the group, name, unit, formula text, definition, UTB / LTB type and YTD basis, with a Check column that flags duplicate names.

Color Settings, Read Me and Get More Templates
Color Settings stores the RAG bands, the report title and the reporting year. Read Me explains the wiring in nine short sections, and Get More Templates points to the other NextGenTemplates product lines.
Reading the Aug-2025 Sample Month
The sample month is a good example of what the page is for. Volume is healthy – Inspections Completed is 509 against a 493 target, and Same-Day Report Rate (61.9%), Defect Catch Rate (93.8%) and Customer Satisfaction (94.4%) are all green. Yet KPI Analysis puts every group in Amber and the Bottom 5 table is led by Revenue per Inspection at 86.2% achievement ($484.1 against $561.6), followed by Callback Rate at 87.0%.
Put together, the office is busy and clients are happy, but each job is earning less and more of them need a return visit. That is a conversation about job mix, pricing and review time, and the scorecard gets you to it in a minute. On the KPI Trend page, Inspections Completed peaks at 567 in June and finishes 2025 at 5,258 year-to-date, ahead of the 5,233 target and the 4,937 of the year before.
Excel KPI Scorecard vs. Google Sheets vs. Inspection Software – Feature Comparison
| Feature | This Excel KPI scorecard | A Google Sheets scorecard | Home inspection software (SaaS) |
|---|---|---|---|
| Cost | One-time purchase | One-time template price | Recurring monthly subscription |
| Setup time | Minutes – type numbers, rename KPIs | Minutes | Onboarding and data migration |
| Works offline | Yes | No | Partly, in the field app |
| Real-time collaboration | No – share the file | Yes | Yes |
| Writes inspection reports | No | No | Yes |
| Change a KPI or threshold | Type over a cell | Type over a cell | Admin settings or vendor support |
| Monthly one-page management report | Ready on day one | Ready on day one | Often needs a custom report |
The scorecard does not compete with report-writing software. It sits beside it and summarises the business once a month.
Who Should Use This Template
- Multi-inspector home inspection companies that want one monthly performance page.
- Office and operations managers reporting punctuality, report turnaround and callbacks to the owner.
- Owner-inspectors growing into a team who want revenue per inspection and referral share in view.
- Bookkeepers and consultants preparing a monthly pack for a property services client.
It is not a report writer, a scheduler or a client database, and it is not a licensing or standards-of-practice compliance record.
Real-World Use Cases
An office manager at a six-inspector firm types ten numbers each month, prints the Scorecard and KPI Analysis pages and walks the owner through the Bottom 5 table. Revenue per Inspection falling while Inspector Utilization sits at 73.2% says the team is busy on lower-priced jobs rather than short of work.
An owner-inspector building a second team watches Report Turnaround Time and Referral Rate together, because agents remember the inspector whose report arrived before the negotiation started.
A bookkeeper with several property services clients keeps one copy per client, switches Vs. to PY for the year-end meeting and uses KPI Trend to show whether a quiet winter was seasonal.
Advantages of an Excel KPI Scorecard for Home Inspection Companies
- One page, every month. The same ten figures in the same place make month-to-month comparison automatic.
- No subscription. A one-time purchase with no per-user fees, and the file is yours.
- Offline and private. It holds business-level monthly numbers only – no client names, addresses or findings.
- Easy to adapt. Rename KPIs, change units and move the RAG bands without touching a formula.
Opportunities for Improvement
- Figures are typed monthly; there is no link to scheduling or inspection software.
- YTD values are typed too, by design, so the right roll-up rule is up to you.
- It reports on the business as a whole, not per inspector. Keep one copy per inspector if you want individual scorecards.
- Collaboration is by sharing the file rather than editing live together.
Best Practices
- Fix a monthly cut-off day and fill Input Data from the same reports every time.
- Define how you measure a callback and a QA-audited defect before you start, and write it in the Definition column.
- Set targets from last year’s actuals plus a realistic improvement, not from wishful thinking.
- Review the Bottom 5 table first each month and agree one action per red KPI.
- Record the YTD Basis (sum or average) for every KPI so the next person fills it the same way.
For help with the Excel features behind the tiles, Microsoft’s Excel help and learning site covers sparklines and conditional formatting.
Explore Relevant Templates
- Home Renovation Contractor KPI Dashboard in Excel – KPI reporting for a neighbouring residential trade.
- Septic Tank Service KPI Scorecard in Excel – a property services scorecard on the same layout.
- Fire Safety Services KPI Scorecard in Excel – another inspection-led service business on this line.
- Pest Control Business KPI Scorecard in Excel – the same engine for a home services firm.
- The Home Inspection Services KPI Scorecard in Google Sheets on NextGenTemplates, for teams that share one live file.
Frequently Asked Questions
Does it connect to my inspection or scheduling software?
No. You type the monthly figures on Input Data. That keeps the file portable and offline, and a month’s update for ten KPIs takes a few minutes once your reports are open.
Do I need to enable macros?
No. The workbook is a plain .xlsx with no VBA. It uses formulas, conditional formatting, camera pictures and sparklines, and opens in Excel 2016 or later and Microsoft 365.
How long does setup take?
Usually under half an hour: set the year and title on Color Settings, keep or rename the ten KPIs, then paste twelve months of MTD and YTD figures into Input Data.
How many KPIs can it hold?
Twenty. The Scorecard displays ten at a time, and the set picker in the header switches between KPI 1-10 and KPI 11-20.
Does it check inspections against a standard or licensing rule?
No. Defect Catch Rate and Callback Rate show numbers you enter from your own reviews. The workbook stores no reports, findings or client details and makes no compliance or certification claim.
What is in the download?
A ZIP holding the Home Inspection Services KPI Scorecard workbook (.xlsx) and a PDF user manual for the Excel KPI Scorecard line.
About the Author
Built by PK – Microsoft Certified Professional with 15+ years of Excel, Google Sheets and Power BI experience. Founder of NextGenTemplates, reaching 300K+ subscribers across YouTube channels. Every template is hand-built and tested before release.
Conclusion
A home inspection business does not need another platform to know how its month went. It needs ten numbers in the same place every month, coloured by whether they are good. That is what the Home Inspection Services KPI Scorecard in Excel delivers, with a full sample year to show you the layout before you type a single figure.
Click here to purchase the Home Inspection Services KPI Scorecard in Excel
Instant download – One-time payment – No subscription
Last updated: September 2026
For video tutorials visit Youtube.com/@PKAnExcelExpert