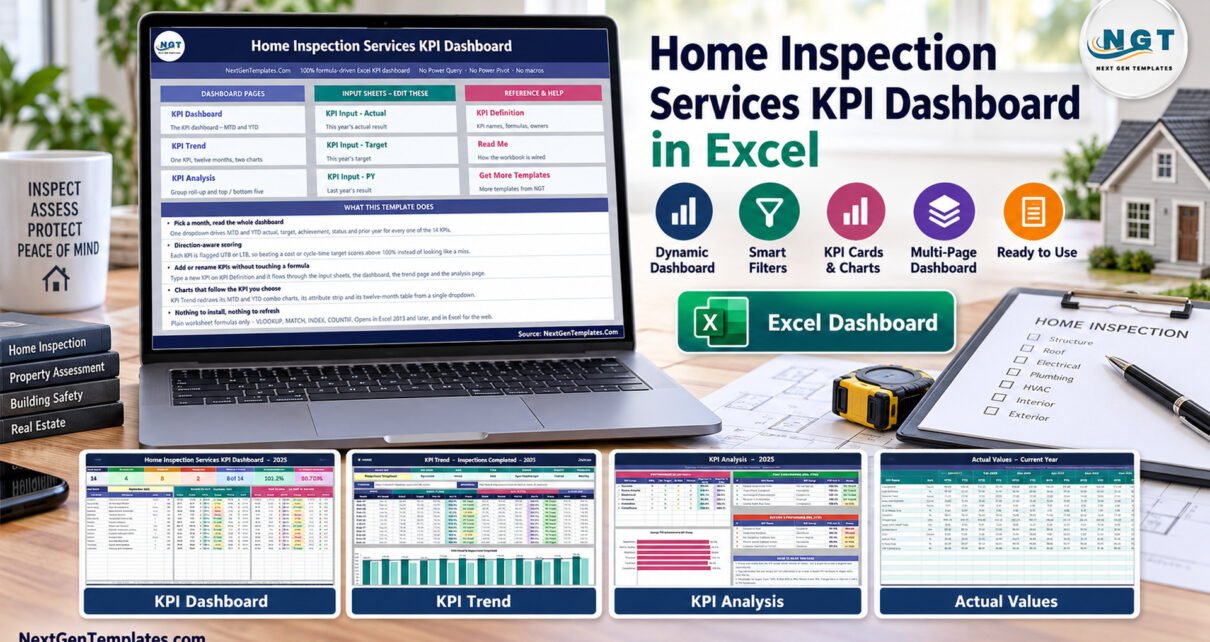
Home inspection services KPI dashboard in Excel turns monthly inspection-company figures into a structured management view. Instead of reviewing separate spreadsheets for jobs, turnaround, callbacks, revenue, customer feedback, and compliance, you can enter the figures in three input sheets and use one month selector to update the complete workbook. The supplied example contains 14 home inspection KPIs, seven summary cards, MTD and YTD comparisons, prior-year results, traffic-light statuses, trend charts, and group-level analysis. Home Inspection Services KPI Dashboard in Excel
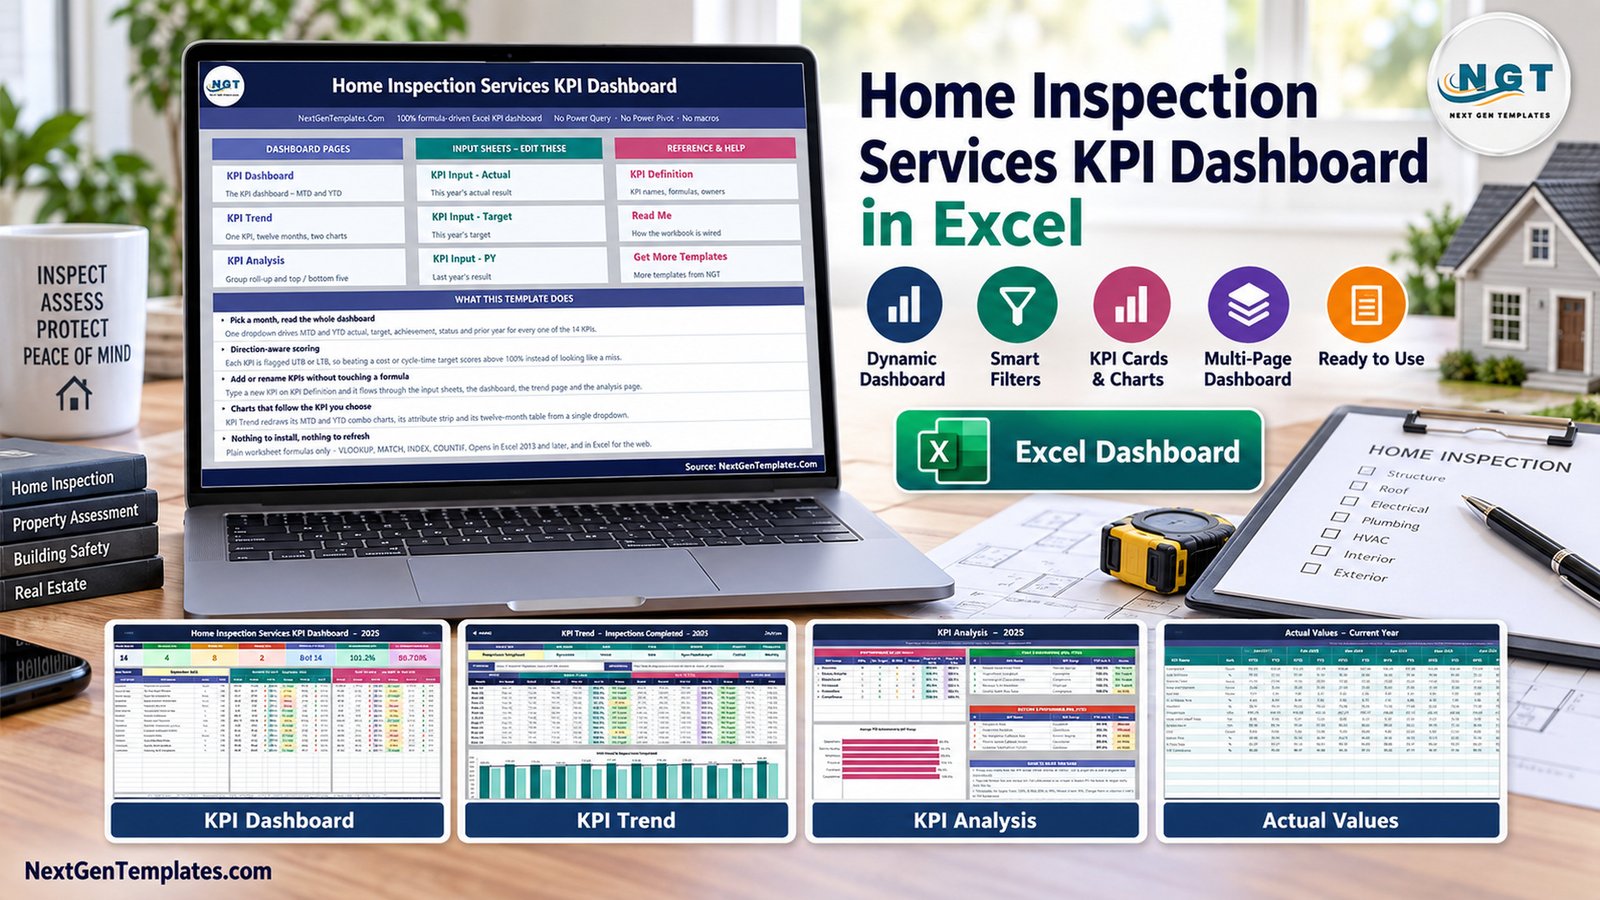
This is a reporting template, not field inspection software. It is designed for businesses that already collect operational data and want a repeatable monthly KPI review without macros, Power Query, Power Pivot, or a subscription platform. Home Inspection Services KPI Dashboard in Excel
Key Features of Home Inspection Services KPI Dashboard in Excel
The workbook is built around practical performance-review tasks rather than decorative charts. Its main capabilities include:
- Fourteen predefined measures across operations, service quality, workforce, finance, customer experience, and compliance.
- A month selector that updates MTD and YTD actual, target, achievement, status, prior-year, and variance results.
- UTB and LTB scoring, allowing both higher-is-better and lower-is-better KPIs to be evaluated correctly.
- Seven management cards for total KPIs, on-target, at-risk, missed, improving versus prior year, and average achievement.
- A selectable KPI Trend page with a 12-month table and separate MTD and YTD charts.
- A KPI Analysis page with group roll-ups, average achievement, and top/bottom-five rankings.
- An editable KPI Definition master list containing name, group, unit, formula, definition, type, owner, priority, and frequency.
- Formula-driven calculations with no macros, add-ins, Power Query, or Power Pivot.
If you search for a home inspection KPI dashboard Excel solution, this workbook is aimed at monthly management reporting rather than on-site checklist completion.
Dashboard Pages Explanation
Home
The Home sheet acts as an index. It groups the reporting pages, editable input sheets, and reference/help sheets so users can move quickly to the relevant part of the workbook. It also states that the file uses ordinary Excel formulas.
KPI Dashboard
The central home inspection performance dashboard shows the 14 KPIs with month-to-date and year-to-date actual, target, achievement, status, prior-year, and variance results. Summary cards immediately show how many KPIs are on target, at risk, or missed. The example measures include Inspections Completed, On-Time Report Delivery, Report Turnaround Time, Defects Found per Inspection, Inspection Duration, Re-Inspection Callback Rate, Inspector Utilisation, Revenue per Inspection, Booking-to-Inspection Lead Time, Customer Satisfaction, Complaint Rate, Referral and Repeat Rate, Quality Audit Pass Rate, and Licensing and CE Compliance. Home Inspection Services KPI Dashboard in Excel
KPI Trend
Select one KPI to display its attributes, formula, and definition together with 12 months of actual, target, prior-year, achievement, and status data. MTD and YTD charts make sustained movement easier to see than a single-month result.
KPI Analysis
This page groups performance into Operations, Service Quality, Workforce, Financial, Customer, and Compliance sections. It calculates group achievement, charts average YTD performance by group, and ranks the top and bottom five KPIs.
Actual, Target, and Prior-Year Inputs
These three sheets are where users normally type. They hold month-by-month MTD and YTD values, with KPI rows controlled by the KPI Definition sheet. Keeping inputs separate makes it clear which figures are results, goals, and historical comparators.
KPI Definition and Read Me
KPI Definition is the master list. Rename a KPI there and the other sheets follow it. Read Me explains the reporting year, month selection, scoring rules, achievement formulas, status thresholds, and how to add or remove measures.
Home Inspection Services KPI Dashboard in Excel vs. Google Sheets vs. Paid SaaS – Feature Comparison
| Area | This Excel template | Google Sheets alternative | Paid inspection SaaS |
|---|---|---|---|
| Cost | One-time template price | Workspace cost plus build effort | Recurring subscription |
| Platform | Excel 2013 or later; Excel for the web supported | Browser spreadsheet | Vendor web/mobile application |
| Setup time | Replace sample figures and select a month | Build KPI logic and charts | Configure workflows and migrate data |
| Live collaboration | Possible through shared cloud storage, but owner-controlled use is simplest | Native co-editing | Usually included |
| Custom fields | Edit the KPI master list | Flexible when correctly designed | Varies by product and plan |
| Mobile data collection | Not included | Limited spreadsheet entry | Often included |
| Year-1 cost at 5 users | Template price plus existing Excel access | Subscription and implementation time | Can reach hundreds or thousands of dollars |
| Best fit | Monthly KPI review | Collaborative spreadsheet reporting | End-to-end inspection operations |
For general workbook guidance, Microsoft maintains current Excel help and learning resources.
Who Should Use This Template
This Excel KPI dashboard for home inspectors is useful for independent inspection-company owners, multi-inspector operations, operations managers, client-services leads, quality-assurance managers, compliance coordinators, and analysts who prepare recurring performance reports.
It is especially helpful when monthly data already exists but reports are inconsistent. A defined KPI list gives every review meeting the same language for volume, speed, quality, customer outcomes, finances, and compliance.
The workbook is not a replacement for inspection-report authoring, appointment scheduling, evidence capture, customer relationship management, accounting, or licensing administration. It does not certify compliance and does not connect automatically to field systems.
Real-World Use Cases
Owner’s monthly performance review
An owner can assess whether inspection volume and revenue are improving without overlooking customer complaints, report turnaround, or callback rates. The summary cards keep the meeting focused on exceptions.
Operations and capacity planning
An operations manager can compare inspection duration, inspector utilisation, and booking lead time against targets. The trend page helps distinguish a one-month variance from a developing pattern.
Quality and compliance review
A quality lead can review audit pass rate, licensing and CE compliance, report turnaround, defects documented per inspection, and re-inspection callbacks. Lower-is-better scoring prevents shorter turnaround or fewer complaints from appearing as poor performance.
Advantages of Home Inspection Services KPI Dashboard in Excel
The strongest advantage is transparency. Every number is based on visible worksheet formulas. Users can trace the logic, rename KPIs, adjust owners and priorities, and review how UTB/LTB scoring works. The workbook opens with sample data, so the output can be evaluated before real figures are entered.
The home inspection metrics template also separates definitions from values. This reduces accidental mismatches: KPI names, groups, units, and directions come from one master list, while actual, target, and prior-year figures remain in dedicated input sheets.
Finally, MTD and YTD views answer different management questions. The month result highlights current performance, while the year-to-date result shows whether the business remains on course over a longer period.
Opportunities for Improvement
Because this is a general-purpose workbook, it requires manual or copy-and-paste data entry. Teams that need automatic integrations, mobile inspection forms, technician dispatching, photo storage, digital signatures, or client portals should consider specialized software.
The template begins with 14 KPIs and has formula-ready space for 22. Going beyond that capacity requires extending formulas and ranges as explained in Read Me. Shared multi-user editing also needs a considered file-storage process to avoid conflicting copies.
Best Practices
- Agree on each KPI’s exact formula, owner, frequency, and source before entering monthly data.
- Use UTB for measures where higher is better and LTB for costs, delays, complaints, or callbacks where lower is better.
- Keep the reporting-year start date consistent so current and prior-year month headers align.
- Validate actual, target, and prior-year values before the monthly review.
- Use KPI Trend to investigate movement and KPI Analysis to prioritize group-level action.
- Save an approved month-end copy when your reporting process requires an audit trail.
Explore Relevant Templates
Service and construction businesses may also find the Home Renovation Contractor KPI Scorecard in Excel, Bathroom Remodeling KPI Dashboard in Excel, and Kitchen Remodeling KPI Dashboard in Excel useful. These are published posts on this site, so readers can compare related reporting structures without leaving PK-AnExcelExpert.
Frequently Asked Questions
Does the workbook use VBA?
No. It contains no macros and does not require VBA, Power Query, Power Pivot, or an add-in.
Can I change the KPI names and groups?
Yes. Edit the KPI Definition master list, and the connected input and reporting sheets follow it.
How many KPIs can I track?
Fourteen example KPIs are populated. The workbook is wired for up to 22 rows before formulas and ranges need extending.
Can it calculate lower-is-better measures correctly?
Yes. Assign LTB to measures such as turnaround time, complaint rate, callback rate, or booking lead time.
Is this an inspection report or checklist?
No. It is a monthly performance dashboard. It does not capture property defects, photos, signatures, or client reports.
What files are included?
The customer ZIP contains the Excel .xlsx workbook and a PDF user manual.
Where can I download it?
Get the template from NextGenTemplates.
About the Author
Built by PK – Microsoft Certified Professional with 15+ years of Excel, Google Sheets, and Power BI experience. Founder of NextGenTemplates, reaching 300K+ subscribers across YouTube channels. Every template is hand-built and tested before release.
Conclusion
The Home Inspection Services KPI Dashboard in Excel provides a practical bridge between scattered monthly figures and an expensive operational platform. It gives owners and managers a consistent way to review workload, report speed, quality, inspector capacity, customer outcomes, revenue, and compliance while keeping all logic visible.
Download the workbook from NextGenTemplates, replace the sample values, and adapt the KPI definitions to your operating model. For more Excel tutorials, visit the PK: An Excel Expert YouTube channel.