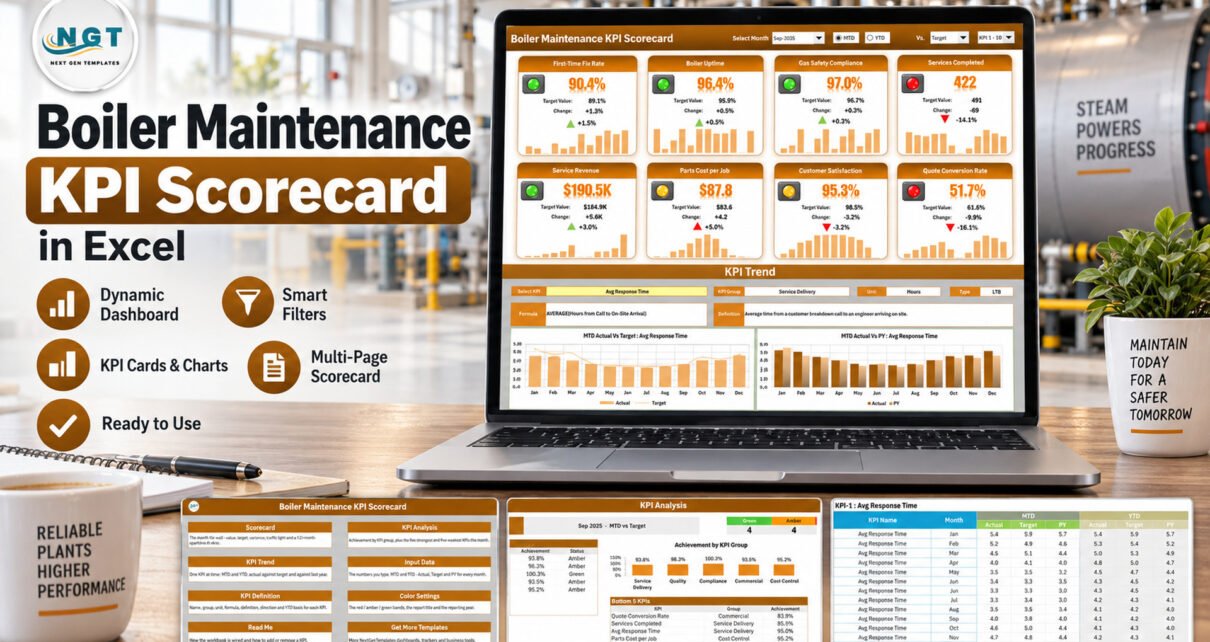
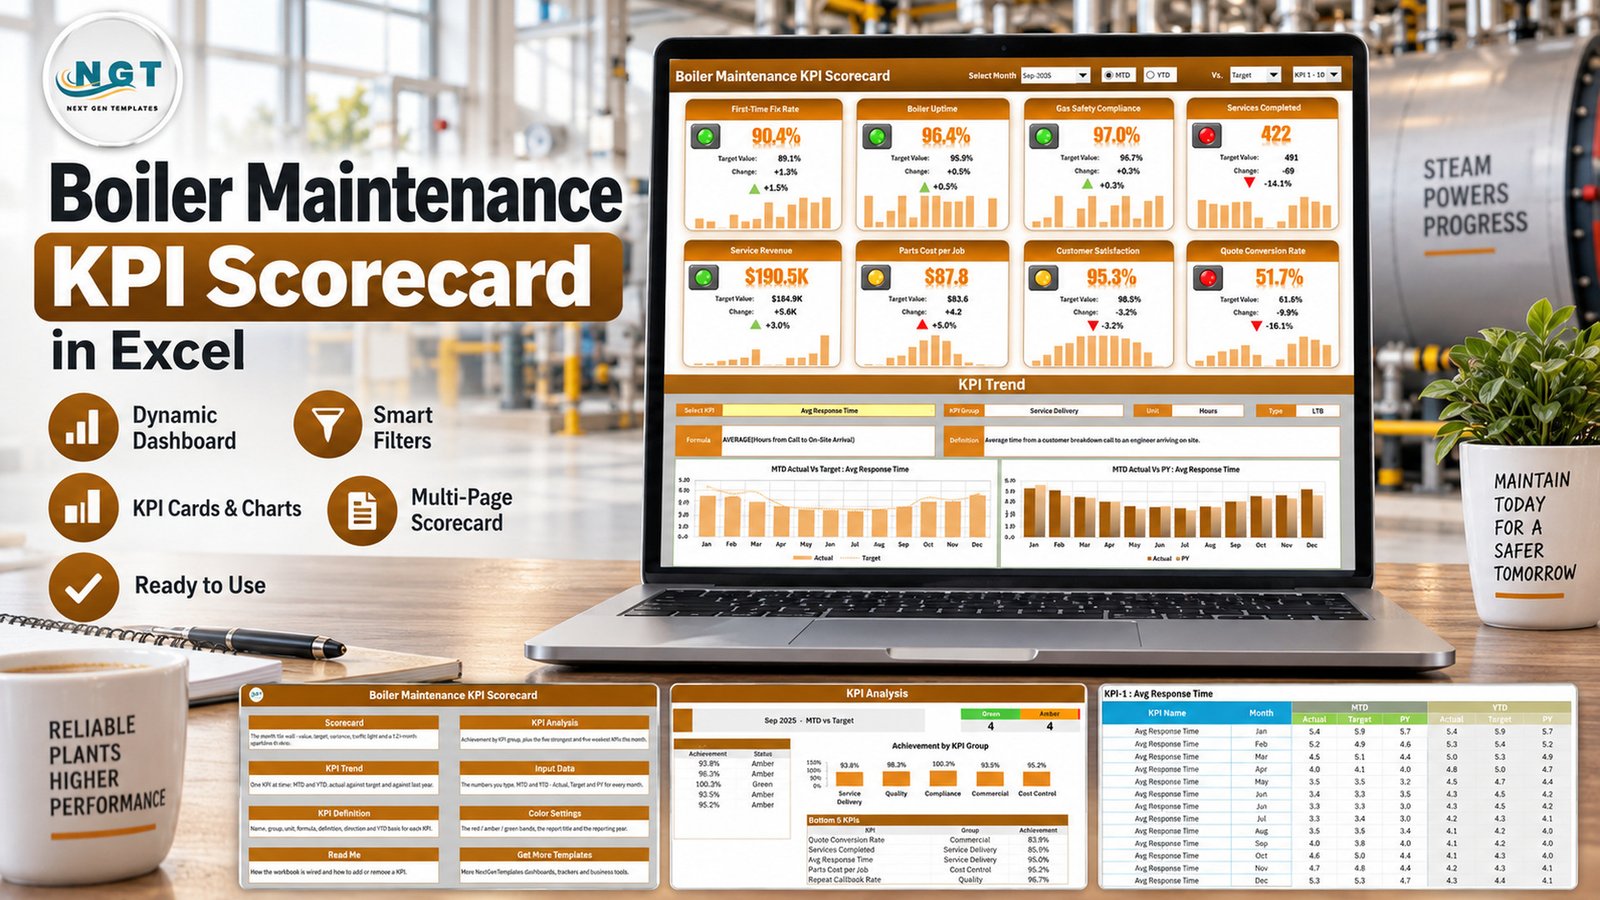
The Boiler Maintenance KPI Scorecard in Excel turns final monthly maintenance figures into a consistent scorecard for management review. Instead of rebuilding cards and charts every month, you type MTD and YTD Actual, Target and PY values into one input sheet. The workbook then updates traffic lights, variance, sparklines, KPI-group analysis and selected-KPI trend charts.
Ten boiler-service examples are ready on day one: Avg Response Time, First-Time Fix Rate, Boiler Uptime, Gas Safety Compliance, Services Completed, Repeat Callback Rate, Service Revenue, Parts Cost per Job, Customer Satisfaction and Quote Conversion Rate. The workbook has room for up to 20 KPIs, uses standard Excel formulas and requires no macros, Power Query or add-ins.
This article covers the KPI scorecard edition. It is not the separate Boiler Maintenance KPI Dashboard in Excel, which is a different draft product with a dashboard-oriented design. The scorecard described here centres on traffic-light KPI cards, KPI-group analysis and selected-KPI trends.
Key Features of the Boiler Maintenance KPI Scorecard in Excel
- 20-KPI capacity: switch between KPI 1-10 and KPI 11-20 from the Scorecard header.
- MTD and YTD views: review monthly and year-to-date values without changing sheets.
- Target, PY and prior-month comparisons: choose the benchmark that fits the meeting.
- UTB and LTB directions: higher-is-better and lower-is-better KPIs receive correct status logic.
- Editable RAG bands: change green, amber and red thresholds for both KPI directions.
- KPI Analysis: summarise achievement by group and identify the top and bottom five KPIs.
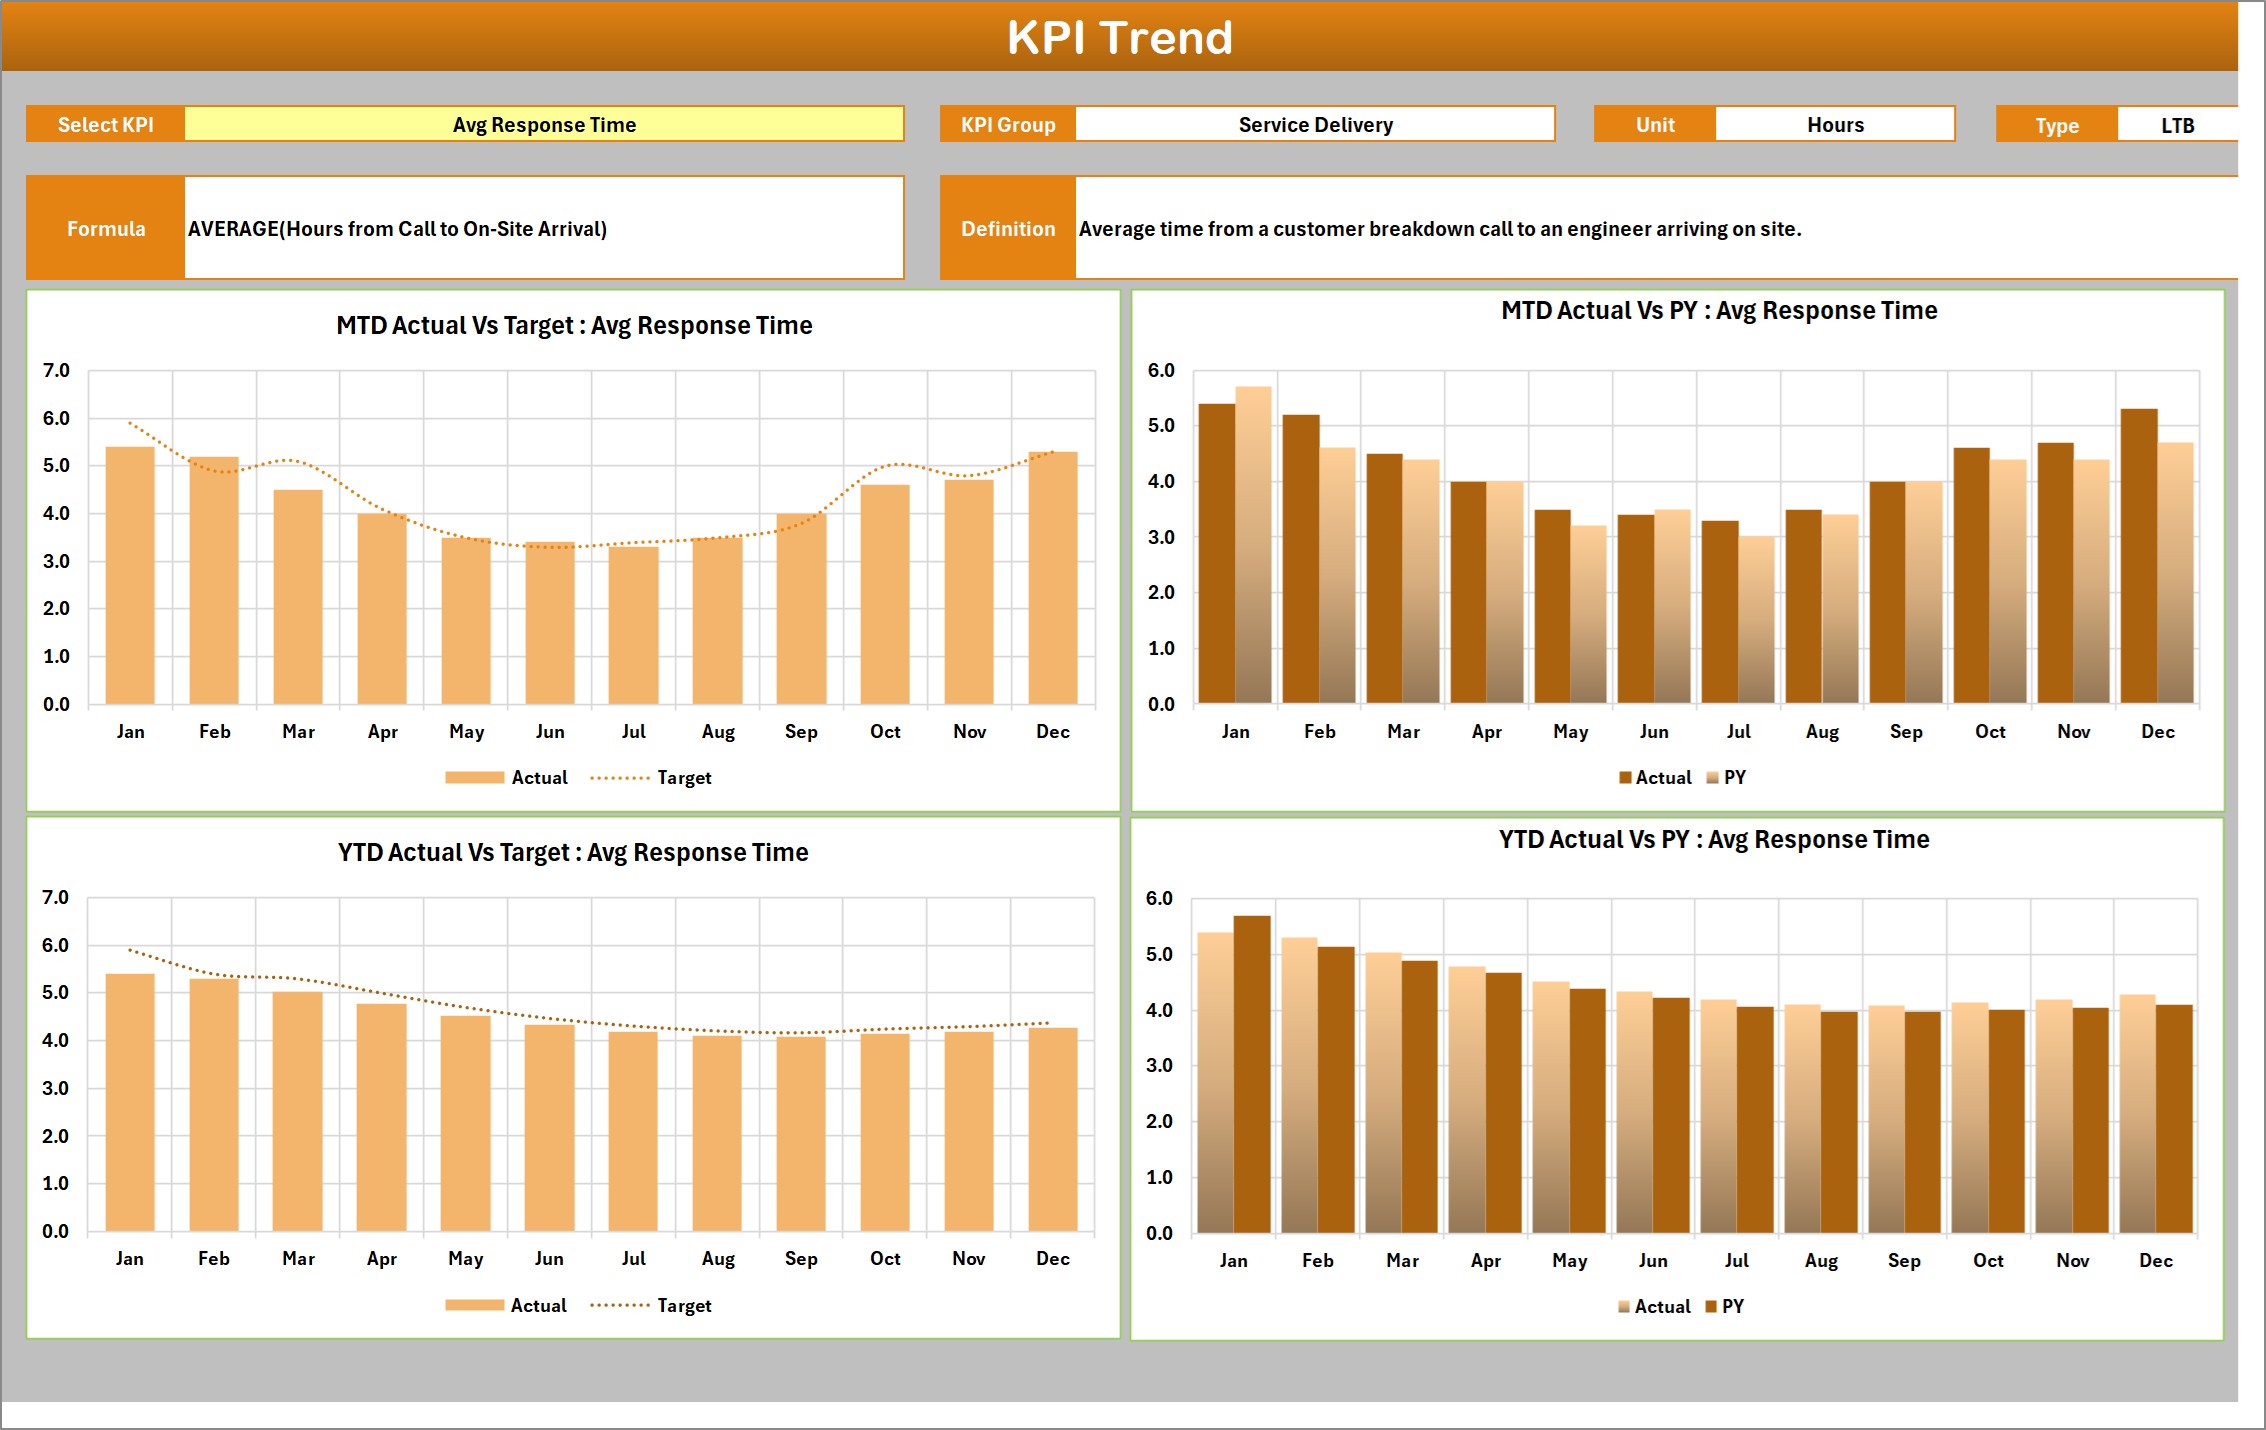
- KPI Trend: compare MTD and YTD Actual with Target and previous year across 12 months.
- Duplicate KPI check: KPI Definition warns when repeated names could corrupt lookups.
- Formula-only Excel file: no macro prompt and no external connection to maintain.
Workbook Pages Explained
Home
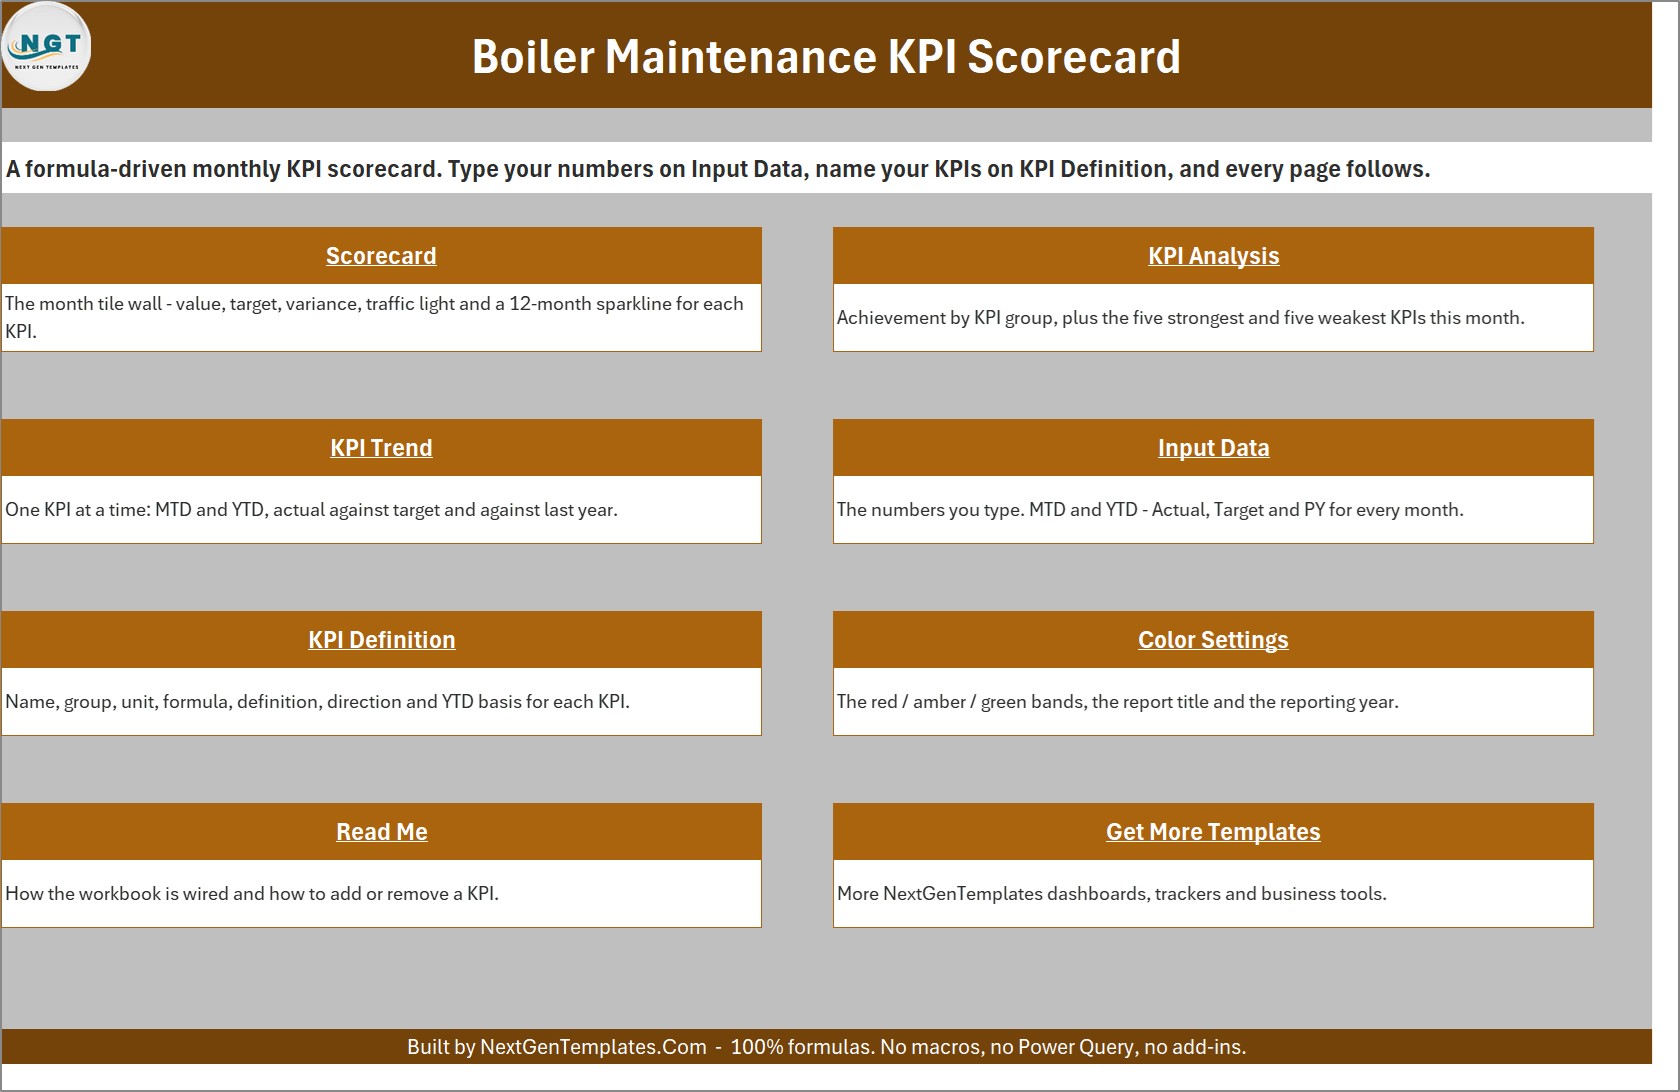
The Home sheet is a navigation page for Scorecard, KPI Analysis, KPI Trend, Input Data, KPI Definition, Color Settings, Read Me and Get More Templates. Its opening note makes the workflow clear: enter numbers on Input Data, define KPIs on KPI Definition, and let the report pages follow.
Scorecard
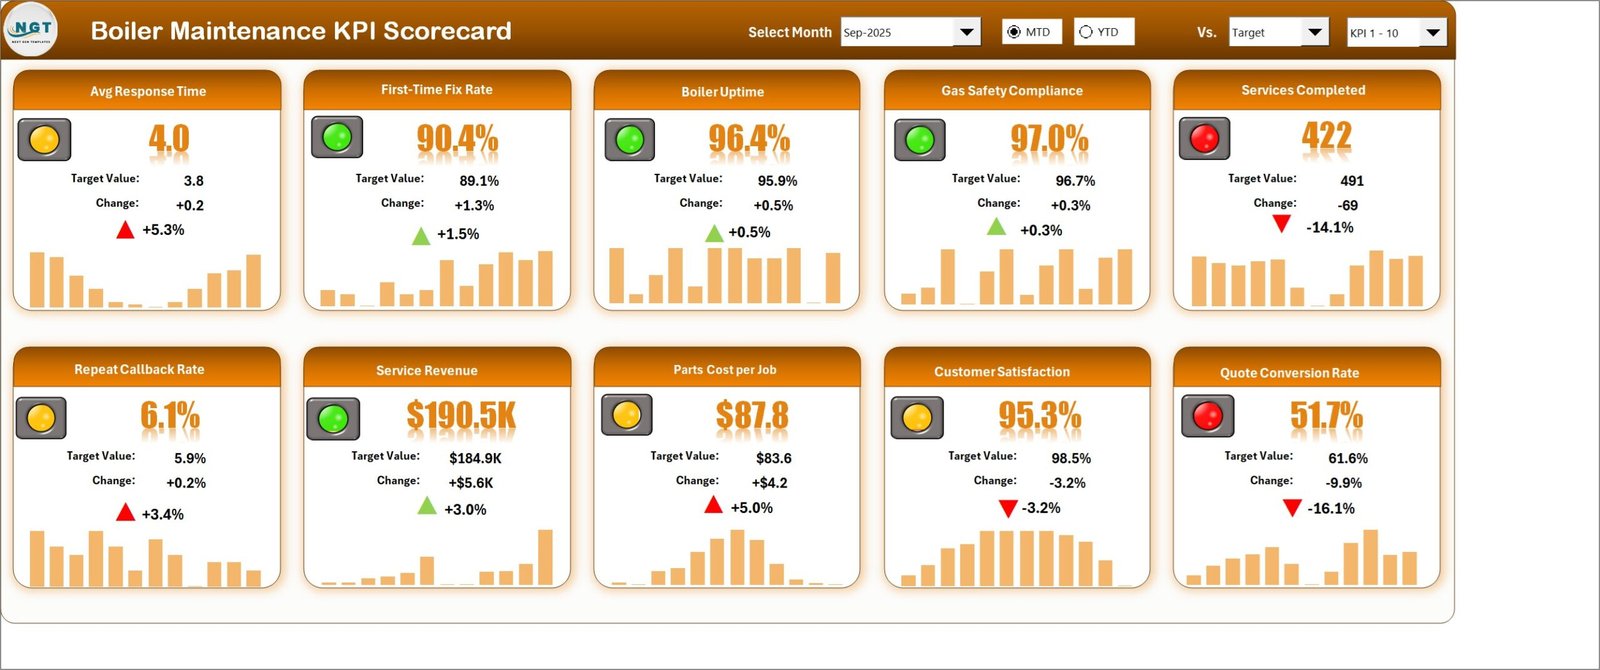
The Scorecard page displays ten KPI cards at a time. Each card shows the selected value, comparison value, absolute change, percentage change, status light and 12-month sparkline. The header lets you pick the reporting month, MTD or YTD, the benchmark, and either the first or second set of ten KPIs.
KPI Analysis
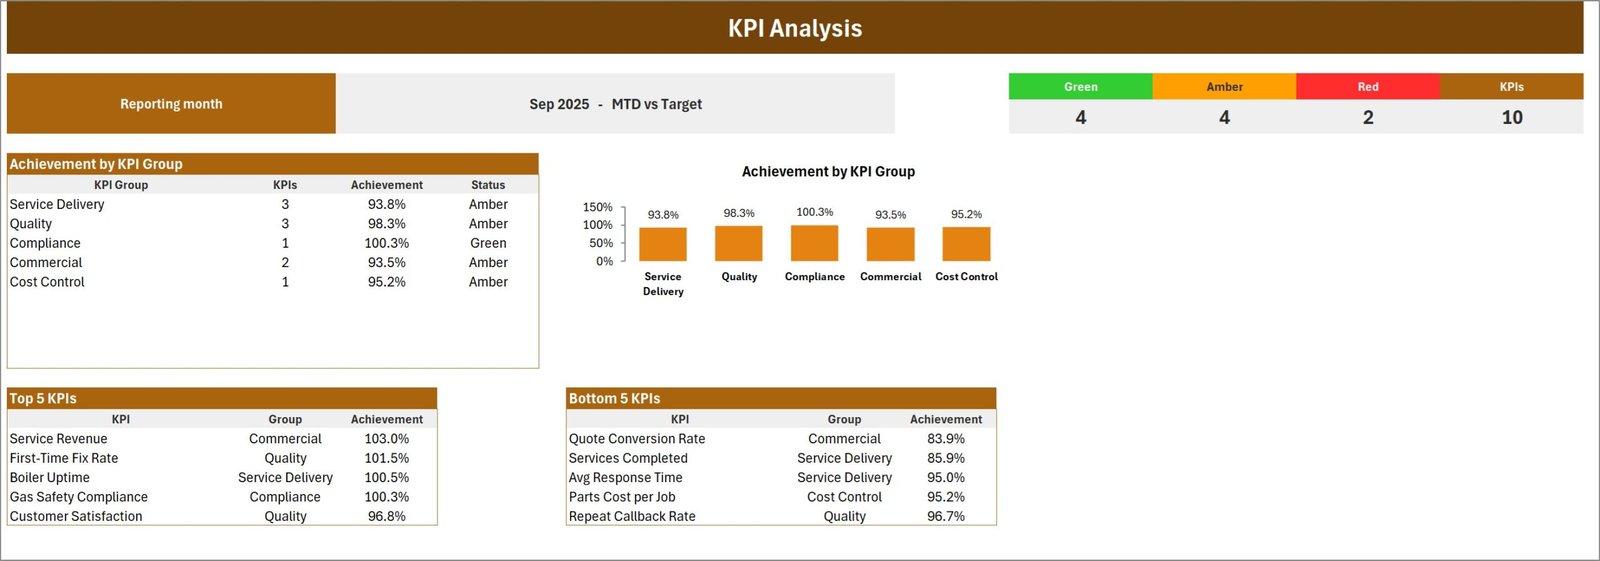
KPI Analysis counts green, amber and red measures for the reporting month, calculates achievement by KPI group, draws a group chart, and lists the five strongest and five weakest KPIs. This is useful when the scorecard shows a mixture of service-delivery, quality, compliance, commercial and cost-control measures.
KPI Trend
Select one KPI to display its group, unit, UTB/LTB type, formula and definition. Four charts then show MTD Actual vs Target, MTD Actual vs PY, YTD Actual vs Target, and YTD Actual vs PY month by month.
Input Data
This is one of the two sheets you normally edit. Each KPI has 12 monthly rows and six value columns: MTD Actual, Target and PY plus YTD Actual, Target and PY. You supply completed figures because the correct YTD roll-up differs: volumes and amounts may be summed, rates may be averaged, and specialised measures may need their own method.
KPI Definition
The second main input sheet stores KPI Group, KPI Name, Unit, Formula, Definition, Type and YTD Basis. The included definitions describe what each boiler-service measure means, while the Check column flags duplicate KPI names. You can keep the examples, rename them or replace them with your own measures.
Color Settings and Read Me
Color Settings controls the report title, year and RAG bands. Read Me explains the entry workflow, UTB/LTB logic, header controls, KPI expansion and formula-only design. The ZIP also contains a separate PDF user manual.
Boiler Maintenance KPI Scorecard in Excel vs. Google Sheets vs. Field-Service SaaS – Feature Comparison
| Area | This Excel scorecard | Google Sheets scorecard | Field-service SaaS |
|---|---|---|---|
| Cost model | $15.99 regular / $9.99 sale, one-time | Usually one-time template price | Recurring subscription |
| Platform | Excel 2016 onward | Browser and Google account | Vendor web/mobile app |
| Setup | Replace sample monthly values | Replace sample values online | Configure assets, users and workflows |
| Offline use | Yes | No | Usually no |
| Editable KPIs | Names, groups, units, direction and formulas | Depends on template | Depends on plan and permissions |
| Team collaboration | Shared via OneDrive or SharePoint | Native browser collaboration | Native account-based collaboration |
| Work orders, dispatch and alerts | Not included | Not included | Often included |
| Best use | Monthly KPI reporting | Browser-first KPI reporting | End-to-end service operations |
Who Should Use This Template
The boiler maintenance KPI template is suitable for boiler service firms, commercial heating contractors, plant-engineering departments, facility managers and operations teams that already calculate monthly results. It provides an Excel KPI scorecard for people who want control of the workbook and do not need another cloud subscription.
It is not suitable if you need live IoT readings, automatic work-order imports, technician scheduling, asset history, statutory inspection records, invoice generation or compliance certification. This workbook visualises entered KPI results; it does not validate gas safety or replace competent technical review.
Real-World Use Cases
Ravi manages a regional boiler-service team. He enters response time, first-time fix, callback and service-completion results after month end. The scorecard shows which service-delivery measure is off target, while KPI Trend reveals whether the issue is isolated or recurring.
Anita oversees boilers across a manufacturing site. She groups uptime, compliance and service completion separately from commercial measures. KPI Analysis lets her discuss engineering and business results in one review without pretending they are the same kind of metric.
James leads a small heating contractor. He tracks service revenue, parts cost per job, customer satisfaction and quote conversion beside operational measures. He uses the UTB/LTB setting so rising revenue is good while rising parts cost and response time are treated correctly.
Advantages of the Boiler Maintenance KPI Scorecard in Excel
The main advantage is consistency. The cards, comparisons and charts already have a working structure, so monthly reporting becomes a data-entry task rather than a design project. The boiler performance scorecard also keeps definitions beside the metrics, reducing disagreements about what a figure means.
Direction-aware scoring matters because boiler reporting mixes KPIs that should rise with KPIs that should fall. First-time fix rate, uptime and satisfaction are typically UTB; response time, callback rate and parts cost may be LTB. One generic variance formula would mislabel half the scorecard.
Finally, the workbook is transparent. Standard formulas, conditional formatting, sparklines and camera pictures are visible inside Excel. Microsoft’s guide to Excel formulas explains the same calculation environment, with no hidden service or recurring licence.
Opportunities for Improvement
The workbook deliberately starts with completed monthly KPI values. A future version could add Power Query imports or a transaction table, but that would introduce source-specific setup and make the simple scorecard harder to reuse. Teams that need automatic data refresh should connect their own model or use a field-service platform.
It also does not send alerts, assign work or store equipment history. Those are operational workflow features, not scorecard features. The cleanest setup is to keep work orders in the system that creates them, calculate agreed monthly KPIs, and use this workbook for review.
Best Practices
- Agree the KPI formula, owner, unit, direction and YTD basis before entering live data.
- Keep KPI names unique so lookups and analysis do not combine measures accidentally.
- Set RAG bands to your service agreements and risk appetite rather than accepting arbitrary defaults.
- Enter MTD and YTD results consistently and document how YTD was calculated.
- Do not treat an amber or green cell as evidence of statutory compliance; retain source records and competent approvals.
- Save a month-end copy before replacing values for the next cycle.
Explore Relevant Templates
For more published guidance on the same host, see the Elevator Maintenance KPI Scorecard in Excel, the Fire Safety Services KPI Scorecard in Excel, and the Maintenance Work Order Data Entry System in Excel. Each solves a different layer: scorecard reporting, safety-service reporting or transaction entry.
Frequently Asked Questions
Does the workbook use macros?
No. It is a standard .xlsx with formulas, conditional formatting, camera pictures and sparklines.
Can I add more than ten KPIs?
Yes. The workbook supports up to 20 and the Scorecard selector switches between the first and second set of ten.
Why do I enter YTD separately?
Because the correct YTD rule depends on the KPI. Volumes may be summed, rates averaged and specialised measures handled differently.
Can I compare against prior month?
Yes. The comparison selector supports Target, PY and Prior Month.
Can I change the RAG thresholds?
Yes. Color Settings has separate bands for UTB and LTB metrics.
Is this the Boiler Maintenance KPI Dashboard?
No. It is the separate scorecard edition, with traffic-light cards, a 20-KPI selector, KPI Analysis and KPI Trend pages.
Does it calculate KPIs from work orders?
No. It expects final monthly KPI results and does not connect to work-order systems.
About the Author
Built by PK – Microsoft Certified Professional with 15+ years of Excel, Google Sheets, and Power BI experience. Founder of NextGenTemplates, reaching 300K+ subscribers across YouTube channels. Every template is hand-built and tested before release.
Conclusion
The boiler maintenance KPI scorecard in excel is a practical choice when the calculations already exist and the missing piece is a clear monthly review. It combines maintenance KPI tracking, group analysis and trend views without macros or a recurring platform fee.
Download the Boiler Maintenance KPI Scorecard in Excel, replace the sample values with your own, and turn each reporting cycle into a repeatable process.
Watch more Excel dashboard and template tutorials at PK: An Excel Expert.